Marcella Ottonello, PsyD1,2*, Leonardo Pellicciari, MSc, PT1*, Andrea Giordano, PhD3 and Calogero Foti, MD4
From the 1PhD Program in Advanced Sciences and Technologies in Rehabilitation Medicine and Sports, Tor Vergata University, Rome, 2Department of Physical & Rehabilitation Medicine, Salvatore Maugeri Foundation, Clinica del Lavoro e della Riabilitazione, IRCCS, Nervi, 3Bioengineering Service, Salvatore Maugeri Foundation, Clinica del Lavoro e della Riabilitazione, IRCCS, Veruno and 4Chair in Physical and Rehabilitation Medicine, Tor Vergata University, Rome, Italy. *These authors contributed equally to this work.
OBJECTIVE: To perform a psychometric analysis of the Fatigue Severity Scale (FSS) using Rasch analysis in a sample of Italian subjects with multiple sclerosis.
METHODS: The 9-item FSS was administered to 156 Italian-speaking subjects with multiple sclerosis. Responses were assessed using Cronbach’s alpha, item-remainder correlations, factor analysis and Rasch analysis.
RESULTS: The FSS showed good internal consistency (Cronbach’s alpha = 0.95), but presented problems in the rating categories and failed to fit the Rasch model. After re-coding and deletion of item 1 (infit mean-square (MnSq) = 1.65; outfit MnSq = 1.72), the 8-item version fitted the latent construct that the scale was intended to measure and showed satisfactory reliability indices. The scale was not optimally targeted to the sample, but no sex or age bias was found.
CONCLUSION: The 8-item FSS shows better psychometric properties than the 9-item version. However, a significant ceiling effect emerged in our sample of Italian adults with multiple sclerosis and, consequently, there is a targeting problem for patients with low-level disability. To consider this a valid tool for use in clinical practice and research, further studies with a larger sample of subjects with multiple sclerosis are needed.
Key words: fatigue; psychometrics; questionnaires; outcome assessment; validation studies.
J Rehabil Med 2016; 48: 597–603
Correspondence address: Marcella Ottonello, Department of Physical & Rehabilitation Medicine, Salvatore Maugeri Foundation, Clinica del Lavoro e della Riabilitazione, Via Missolungi, 14, IT-16167 Nervi (GE), Italy. E-mail: marcella.ottonello@fsm.it
Accepted Apr 21, 2016; Epub ahead of print Jun 16, 2016
INTRODUCTION
Fatigue is one of the most common symptoms in multiple sclerosis (MS), with a prevalence of 55–83% (1). It determines disability and social costs, and has an impact on functioning, autonomy and quality of life (2). Considering the high prevalence of this symptom in people with MS, it is important to have a reliable and valid instrument to measure fatigue in order to improve its management. Many questionnaires measuring level of fatigue have been developed and studied in patients with MS, such as the Fatigue Severity Scale (FSS) (3), the Fatigue Impact Scale (4) and the Neurological Fatigue Index (5). A systematic review of fatigue measures showed that the FSS demonstrated good psychometric properties (6). The FSS, which was developed to facilitate research in the area of fatigue, and assessment and treatment of patients with this symptom, includes 9 items related to severity of fatigue. The FSS has been translated into different languages (7, 8), is widely used in clinical practice (9) and has been used in several trials to measure fatigue in different conditions, including in people with MS (10–12).
The advent of item response theory (IRT) has opened up new possibilities in the development and assessment of clinical tools for healthcare (13). Rasch analysis (RA), for instance, can be used to study a scale’s psychometric properties at the item and patient level (item “difficulties” and patient “abilities”) to determine if the items measure a unidimensional construct and to transform the ordinal raw item scores of a questionnaire into interval measures (14, 15).
Many authors have attempted to analyse the fit of the FSS to the Rasch model, and adapt it for specific clinical groups, thus producing several versions of the instrument. There are studies in Parkinson’s disease (16), polio (17) and MS (18). The transfer of knowledge about fatigue from one group to another is critical in research and healthcare. A recent study (19) showed that some items of the scale fail to meet the set criterion for stability across diagnostic groups. Given the subjective nature of the symptom of fatigue, the tool should reflect the patient’s experience, and a change in score should reflect a meaningful change for the patient. However, semantic interpretations of the word “fatigue” can differ from patient to patient, and some characteristics of fatigue might be disease-specific (20), e.g. people with MS are more likely to be bothered by heat sensitivity than are patients with other conditions. As the validity and reliability of an assessment is contextual (i.e. related to the specific patient group studied), for a reliable use of the questionnaire in Italian MS patients it is crucial to evaluate the psychometric properties of the FSS as a measure of the severity/impact of physical symptoms of fatigue in Italian patients with MS. Therefore, the aim of this study was to perform a comprehensive psychometric analysis of the FSS using RA in a sample of Italian patients with MS, in order to examine its validity and metric properties and provide further insight for the clinical use of the scale in rehabilitation settings in Italy.
METHODS
Participants
This study recruited 156 consecutive adult (aged over 18 years) Italian-speaking patients with clinically diagnosed MS who accessed the Day Hospital of the Department of Clinical Science and Translational Medicine of the Tor Vergata Polyclinic Foundation in Rome, Italy, for rehabilitation between January 2008 and March 2014. Exclusion criteria were psychiatric disorders, sleep disturbances, infections, other comorbidities potentially causing fatigue, presence of severe cognitive or communication impairments, and problems with reading and understanding Italian. All participants gave written consent for the treatment, and the research was conducted according to the principles of the Declaration of Helsinki.
Fatigue Severity Scale
The FSS (3) was originally developed for individuals with systemic lupus erythematosus and MS. The questionnaire is composed of 9 items related to the severity of symptoms commonly present in these patients. Each item consists of a statement about the presence of symptoms over the past week and is rated on a 7-point Likert scale, from 1 (indicating strong disagreement) to 7 (strong agreement). The total score is the mean of the score of the 9 items, yielding a score range between 1 and 7; a higher mean score indicates greater severity of fatigue symptoms.
According to the classification proposed by Johansson et al. (21), we defined 3 groups in relation to categorization into non-fatigue (FSS ≤ 4.0), borderline fatigue (4.0 < FSS < 5.0) or fatigue (FSS ≥ 5.0). However, the different cut-off values used to categorize severity of fatigue in people with MS have not been validated clinically. More recent studies in MS use a cut-off ≥ 5 to classify severe fatigue (22).
An Italian version of the FSS (Appendix I) was produced according to the procedure of forward-backward translation and cross-cultural adaptation (23), with no particular semantic difficulty being found.
Statistical analysis
The internal consistency of the questionnaire was assessed by calculating:
• Cronbach’s coefficient alpha (24); the closer this is to 1.0 the greater the internal consistency of the items in the scale. An alpha of 0.8 is a reasonable goal. Rules of thumb (25) are: “Alpha > 0.9 Excellent; > 0.8 Good; > 0.7 Acceptable”;
• Item-remainder correlation through the Spearman’s rank correlation (rs) coefficient to examine the correlations between each item and the sum of the remaining items, omitting that item from the total.
The dimensionality of the FSS was investigated using factor analysis (FACTOR software) (26): an estimate of the number of factors in the questionnaire responses was obtained with parallel analysis (PA) (27) and minimum average partial (MAP) (28) methods; then an exploratory factor analysis (29) for ordinal data was used to study the contribution of each item to the factors identified previously. We considered representative a loading of each item on the latent factor > 0.5.
RA (rating scale model) of the matrix of item responses was performed using Winsteps software analysis program, version 3.69.1.96. Using a rating scale model, a sample size of 100 subjects allows us to estimate the item calibrations within ±½ logit with 95% confidence (30).
The steps of analysis were as follows:
1. Rating scale diagnostic. We investigated whether the rating scale was being used in the expected manner. We evaluated the response categories as suggested by Linacre (31).
2. Validity was assessed by evaluating the goodness of fit of the real data to the modelled data, to test if there were items that did not fit the model expectations. We considered mean-square (MnSq) > 0.7 and < 1.3 as an indicator of acceptable fit (14). Items outside this range were considered underfitting (MnSq > 1.3, suggesting the presence of unexpectedly high variability), or overfitting (MnSq < 0.7, indicating a too predictable pattern).
3. Reliability was evaluated in terms of separation, defined as the ratio of the person (or item) “true” standard deviation to the error standard deviation (15, 32). Item separation is used to verify the item hierarchy and reflects the number of “strata” of measures that are statistically discernible. A separation of 2.0 is considered good and sufficient to allow stratification into 3 groups (32). A related index is the reliability of these separation indexes, which provides the degree of confidence that can be placed in the reproducibility of these estimates; the value of the coefficient varies from 0 to 1 (values > 0.80 are considered good, and > 0.90 excellent) (15).
4. Principal component analysis (PCA) on the standardized residuals was used to investigate:
4.1. The presence of subdimensions, as an independent confirmation of the dimensionality of the scale. In this case “unidimensionality” assumes that, after the removal of the trait that the scale intended to measure (the “Rasch factor”), the residuals will be uncorrelated and normally distributed (i.e. there are no principal components). The following criteria were used to determine whether additional factors were likely to be present in the residuals: at least 50% of the variance explained by the Rasch factor, eigenvalue of the first contrast smaller than 3, and variance explained by each contrast smaller than 5%.
4.2. The local independence of items. High correlation (> 0.30) of residuals for 2 items indicates that they may not be locally independent or that there is a subsidiary dimension in the measurement that is not accounted for by the main Rasch dimension (33).
In addition, differential item functioning (DIF) analysis was performed for the 2 person factors: sex and age. In particular, we searched possible differences due to context effects between males vs females and younger vs older participants (as separated by the median age of the sample, 47 years). The magnitude of DIF was evaluated using the Mantel-Haenszel statistic for polytomous scales in the Winsteps program, Bonferroni corrected.
RESULTS
Sample characteristics
A total of 156 subjects completed the questionnaire. The main demographic and clinical characteristics of the sample are reported in Table I. The mean FSS score was 4.9 (standard deviation (SD) 1.6) (median = 5.2, interquartile range = 2.2). Approximately one-quarter (24.4%) of the participants showed non-fatigue, 21.8% borderline fatigue, and 53.8% fatigue or severe fatigue.
|
Table I. Main demographic and clinical characteristics of the sample (n=156) |
|
|
Characteristics |
Values |
|
Age, years, mean (SD) |
46.03 (11.17) |
|
Sex, n (%) Women Men |
61 (39.1) 95 (60.9) |
|
Disease type, n (%) Relapsing-remitting Secondary progressive Primary progressive |
97 (62.2) 38 (24.3) 21 (13.5) |
|
EDSS score, mean (SD) |
4.5 (1.5) |
|
Duration of symptoms, years, mean (SD) |
12 (9.9) |
|
Time since MS diagnosis, years, mean (SD) |
8.9 (8.4) |
|
Barthel Index (0–100a), mean (SD) |
85.3 (13.6) |
|
MSQOL-54 (0–100b), mean (SD) Physical composite Mental composite |
51.3 (16.1) 57.5 (19.3) |
|
School education, n (%) None Primary Secondary High school Degree |
1 (0.7) 5 (3.2) 46 (29.5) 89 (57) 15 (9.6) |
|
Employment, n (%) Employees Not employed Retired |
104 (69.8) 20 (13.4) 25 (16.8) |
|
Marital status, n (%) Married Unmarried |
99 (63.5) 57 (36.5) |
|
a100 = no disability. b100 = better physical/mental status. EDSS: Expanded Disability Status Scale; MSQOL-54: Multiple Sclerosis Quality of Life-54; SD: standard deviation; MS: multiple sclerosis. |
|
Internal consistency and dimensionality
Cronbach’s alpha was 0.95 and the item-remainder correlation coefficients ranged from 0.64 (item 1) to 0.84 (item 5 and item 6). The FSS resulted unidimensional at both PA and MAP, with a single factor accounting for 86.4% of the variance and all items loading meaningfully onto the factor (loadings between 0.65 and 0.87).
Rasch analysis
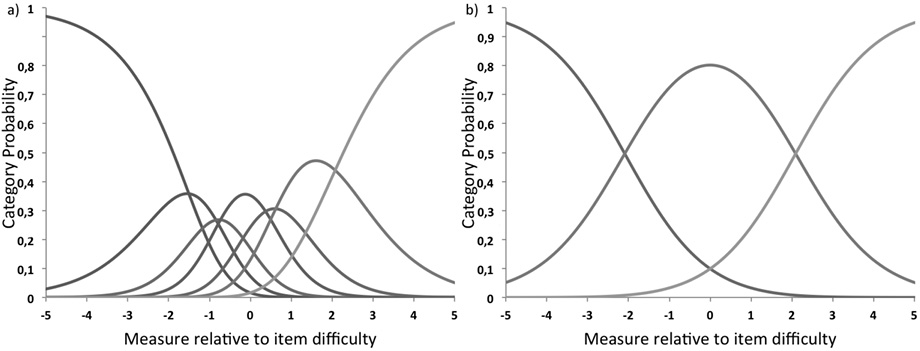
Sample size was adequate to estimate item calibrations within ±½ logit with 95% confidence, even in the presence of poor targeting (30). Rating scale diagnostics showed that the 7 levels of rating categories did not comply with criteria for category function. Category endorsement frequencies ranged between 90 (6%) and 351 (25%). The first 3 categories showed a relative infrequency compared with the other categories. We compared different category collapsing schemes, examining the category diagnostic, and reliability indices and selecting the solution that maximized statistical performance and clinical meaningfulness. The model that best met the established criteria was then adopted (Fig. 1). Response categories were revised to reduce rating from 7 to 3 levels by combining categories 1 with 2, 3 with 4 and 5, and 6 with 7 (1122233).
After resolving the rating scale functioning, item 1 “my motivation is lower when I am fatigued” did not demonstrate an acceptable goodness of fit, as in the initial model testing for all items. Item 1 was underfitting (infit mean-square (MnSq) = 1.65; outfit MnSq = 1.72) and was removed because of misfit, while 8 out of the 9 items fitted the underlying construct that the scale was intended to measure (infit and outfit MnSq between 0.7 and 1.29) (Table II).
|
Table II. Item fit statistics after removing item 1 |
|||||
|
Item number |
Measure |
SE |
Infit MnSq (ZStd) |
Outfit MnSq (ZStd) |
Pt-Meas Corr |
|
2. Exercise brings on my fatigue |
–0.52 |
0.21 |
0.95 (–0.3) |
1.21 (1.2) |
0.80 |
|
3. I am easily fatigued |
–0.09 |
0.20 |
0.90 (–0.8) |
0.95 (–0.3) |
0.83 |
|
4. Fatigue interferes with my physical functioning |
–0.65 |
0.21 |
0.92 (–0.6) |
0.88 (–0.6) |
0.82 |
|
5. Fatigue causes frequent problems for me |
0.23 |
0.20 |
0.75 (–2.1) |
0.70 (–2.4) |
0.86 |
|
6. My fatigue prevents sustained physical functioning |
–0.65 |
0.21 |
0.91 (–0.6) |
0.81 (–0.1.1) |
0.83 |
|
7. Fatigue interferes with carrying out certain duties and responsibilities |
0.95 |
0.20 |
1.16 (1.3) |
1.13 (0.9) |
0.81 |
|
8. Fatigue is among my 3 most disabling symptoms |
–0.26 |
0.21 |
0.99 (0.0) |
0.88 (–0.8) |
0.84 |
|
9. Fatigue interferes with my work, family, or social life |
0.99 |
0.20 |
1.29 (2.0) |
1.29 (1.9) |
0.79 |
|
SE: standard error; MnSq: mean-square; ZStd: z standardized statistics; Pt-Meas Corr: point-measure correlation. |
|||||
The item difficulty estimates (Table II) spanned from –0.65 to +0.99 logits, showing a limited range of difficulty, and the distribution of patients’ abilities (Fig. 2) showed that ability levels spanned from –5.49 to 5.53 (mean 1.75). The mean level of ability for our sample was quite far (1 logit or more) from the mean difficulty of the items, set by convention at 0 logits. This indicates problems with targeting: the mean fatigue impact of our patients was rated as considerably higher than the mean difficulty of the items of the scale. The threshold map for the 8 items indicated that the difficulty of overcoming the same threshold for items of FSS was not the same, since the skill required to move from one score to another differed among items.
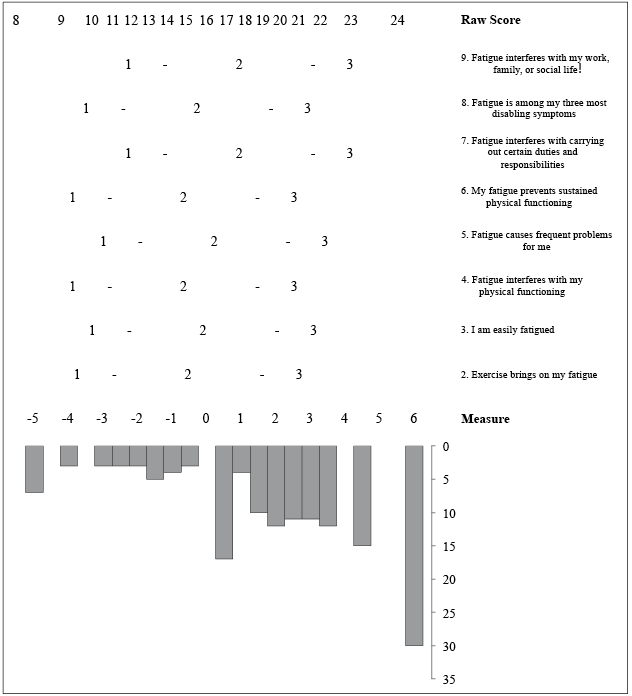
Fig. 2. The Fatigue Severity Scale 8-item Person-Item keyform. Fatigue, as tapped by Fatigue Severity Scale 8 items, increases as raw scores increase. In the middle, there is the threshold map for each item. Each threshold, the crossing between adjacent response options (from 1 = disagree to 3 = agree), is marked by “-”. The distribution of the subjects in the study sample according to their fatigue level is shown at the bottom.
The reliability indices were satisfactory: item separation index = 2.80, item separation reliability = 0.89, person separation index = 2.30, person separation reliability = 0.85. The variance explained by the Rasch measures was 55.2% (eigenvalue 9.9), while the eigenvalue from the first contrast of the residuals was 1.7. The PCA of standardized residuals showed no residual correlations > 0.30. The scale was free from DIF for the 2 factors analysed (sex and age) (Fig. 3).
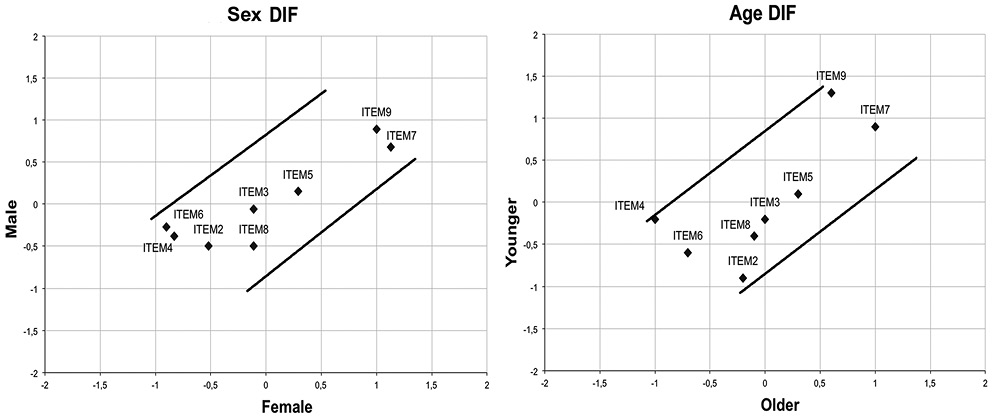
Fig. 3. Differential item functioning (DIF) of the 9-item Fatigue Severity Scale according to (a) sex and (b) age. Separate Rasch item logit calibrations were performed for men and women and for younger and older respondents, and plotted against one another with 95% 2-sided confidence bands.
DISCUSSION
Fatigue is a typical feature of many neurological conditions, including MS. Most tools to measure fatigue were originally developed to evaluate fatigue in other conditions, and then applied to people with neurological diseases. Consequently, items often refer to the impact of fatigue on physical, mental and emotional function, which can be directly limited by neurological conditions, thus confounding the score. The FSS, however, was originally developed and tested for use in MS and systemic lupus erythematosus (3) and it has also been widely used in physiological studies and clinical trials (12). The current study assessed the psychometric properties of the FSS in a sample of patients with MS using IRT analyses. To our knowledge, this study is the first to evaluate the FSS in MS patients in the Italian context. As any assessment is contextual, it is essential to evaluate the psychometric properties of the FSS in the MS population to which it will be specifically applied. Furthermore, certain characteristics of fatigue might be disease specific. The subjects in our sample were relatively young people with a mean age of less than 60 years. Approximately 70% were still able to hold down a job and 63% were in a marital relationship, showing a good level of functional autonomy. Before proceeding with RA, we investigated the dimensionality of the questionnaire in our sample by classical test theory methods (Cronbach’s α values, item-remainder correlations and factor analysis), and found good internal consistency. In fact, the unidimensionality of the scale is a requisite for RA (34).
RA was used to test rating scale diagnostics. According to RA, our respondents were unable to discern between 7 response categories. The collapsing procedure produced a 3-level rating scale (1 = disagree; 2 = neutral; 3 = agree) that ensured that each rating category was distinct from the other; this is in line with a study of FSS in polio survivors (17). This solution improved the measurement qualities of the scale, maintaining at the same time high reliability indexes. It has been observed that 6 or more categories in a rating scale decrease the distinction between categories (35). However, a lesser number of levels can compromise the rater’s ability to discriminate the latent variable, which could result in a loss of information (36), or decrease the reliability indices of the scale. This was not our case.
Item fit to the Rasch model, on the other hand, indicated one misfitting item: item 1 (fatigue-related lack of motivation) did not adhere as much as the other items to the predominant underlying concept. When this item was removed from the analysis, the explained variance of the unidimensionality was satisfactory and higher in the 8-item FSS than in the original 9-item FSS version. This result is in agreement with the literature; in fact, it was reported that item 1 did not show acceptable goodness-of-fit in polio survivors (17), in Parkinson’s disease (16), or in MS in an English (18), and Norwegian and Swedish context (37). Our results support the conclusion that item 1 does not measure the unidimensional construct of the FSS. In fact, item 1 seems to measure the patient’s motivation, not directly the fatigue; in this case fatigue is used to quantify the level of motivation, but not the unidimensional construct under investigation. Moreover, a study on the content validity of the FSS (38) argued that item 1 investigates the consequences of being fatigued, while the remaining items concern the experience of being fatigued. Our data, together with previous studies, support the notion that the unidimensionality of the FSS can be improved after removing item 1.
Mills et al. (18) suggested a 5-item scale for measuring fatigue in subjects with MS; 2 studies (19, 37) showed a 7-item version with better psychometric properties than the original instrument. In contrast, we propose an 8-item scale; in fact, after collapsing categories and removing only item 1, the FSS showed good psychometric properties. Similarly, an 8-item version, with item 1 removed, was validated by RA as a measure of the severity/impact of physical symptoms of fatigue in polio survivors and the appropriateness of simplifying its rating categories was confirmed (17). The item hierarchy of the FSS-8 showed that item 6 (“my fatigue prevents sustained physical functioning”) and item 4 (“fatigue interferes with my physical functioning”) were the items most easily agreed with, while item 7 (“fatigue interferes with carrying out certain duties and responsibilities”) and item 9 (“fatigue interferes with my work, family, or social life”) were the most difficult for subjects to agree with. Similar results were found in the study of Mills et al. (18) in which both the FSS-5 and FSS-9 showed item 4 to be the easiest and item 9 the most difficult.
Our sample reported a mean duration of symptoms of 12 years, and more than 50% of the sample showed severe fatigue. The scale, however, tends to be less precise in estimating people at high fatigue severity levels. Mills et al. (18) also reported a large ceiling effect in person abilities and a narrow range of item difficulties, with the tendency to cluster around the arbitrary mean of zero. This ceiling effect can be explained by the fact that all items are formulated in the negative; as Lerdal et al. (38) suggest, this may have encouraged respondents to give a “set response” without reading the question carefully. The ceiling effect limits the scale’s use in Italian patients with MS, as it probably reduces the sensitivity to change and the ability to discriminate the severity/impact of fatigue across different patient subgroups.
Regarding reliability issues, the high value of item separation reliability indicates good replicability of item placement in other samples. In other words, the reliability values for the items indicate a high internal consistency and ability to define a distinct hierarchy of items. In the same way, the person separation index or level of patients’ “separation” along the “fatigue” construct was able to detect 3 “strata” of patients: those in agreement, those in disagreement, and those neutral with respect to the severity of perceived fatigue. This finding could be in agreement with the 3 levels of fatigue that several authors have tried to classify MS patients as having (1, 21, 22).
The results of PCA on standardized residuals showed that the latent trait measured by the questionnaire is sufficiently unidimensional, confirming the results of previous studies on the other versions of the questionnaire (17). Furthermore, the scale was free from DIF for sex and age. This suggests the stability of item hierarchy across these variables.
Care should be taken in generalizing our results, because the study sample was drawn from a single facility and is of relatively young mean age. The ability levels of our sample were not well targeted by the FSS items. Compared with the mean value of 0 logits routinely assigned for items, the mean fatigue impact of our sample was rated as considerably higher by the present scale. Consequently, persons at high fatigue impact levels, such as patients with severe MS, tend to be estimated less precisely with this questionnaire.
Another critical aspect of the scale is that 6 of the 8 items (in increasing order of difficulty) are clustered in just over half a logit (from –0.65 to –0.09), where only a minority of subjects’ ability levels fall. This highlights a certain redundancy of items and a poor discriminative power of items to differentiate between the abilities of individuals. It might be difficult for people to appreciate the difference between saying that something makes you “easily” fatigued (item 3) or causes “frequent” problems (item 5). However, this limited range of measurement in itself is not a critically small range and also characterizes almost all the validation studies of FSS: in Lerdal et al. (37), 4 of the 7 items clustered in a range similar to ours; in Mills et al. (5), 4 of 5 items, and in Johansson et al. (19), 5 of 7 items. Although it is not a limit to the validation of the scale, this aspect limits its effectiveness and should be an incentive to improve the scale with items that test the latent variable to its extremes.
The absence of DIF supports the validity of FSS across sex and age groups in this sample of patients. However, there is need for further DIF evaluations in FSS to assess the stability of item hierarchy across subsamples defined according to potentially relevant clinical and cultural criteria. In addition, it should be taken into account that the instrument is a self-report questionnaire in which patients give subjective opinions and may have different interpretations of the word “fatigue”.
Although the 8-item scale met the Rasch criteria for satisfactory psychometric properties, it still presents some problems in an Italian context that limit its use in clinical practice and research. The scale has many items clustered within a narrow span of difficulties, thus failing to discriminate the different abilities of individuals and it shows a severe ceiling effect in the sample studied. Our sample consisted of young patients with MS with a low level of disability who were undergoing a day hospital rehabilitation programme at our department. It is likely that their perception of fatigue or their expectation of strength in the performance of daily activities was high, so it cannot be properly discriminated by the FSS. The apparent inconsistency between a low disabled group of patients who nevertheless appear to have high levels of fatigue can be explained by the fact that the FSS is a self-administered test. It rates the severity of fatigue symptoms from the patient’s perspective and is used to measure subjective severity of fatigue (3). This psychological dimension of fatigue reveals that, in MS, fatigue is independent of physical disability and more closely linked to depression (1). Therefore, we recommend that future studies investigate the psychometric properties of the instrument in a sample of patients with different levels of disability.
In conclusion, this new translation of the FSS questionnaire into Italian was easily understood by patients with MS. The 8-item version of the FSS derived from RA showed better psychometric properties than the original FSS-9 version in this Italian sample of adults with MS. However, although RA showed it has some good psychometric properties, in the sample of subjects examined here problems emerged that limit its use in clinical practice and research. Therefore, in order to be considered a valid tool for use in clinical practice and quality surveys to measure the impact of fatigue in MS in a rehabilitation facility, further studies on a larger sample of patients with MS are needed.
REFERENCES
Appendix I. Italian version of the Fatigue Severity Scale | |||||||
La mia motivazione è minore quando sono affaticato / My motivation is lower when I am fatigued | 1 | 2 | 3 | 4 | 5 | 6 | 7 |
L’esercizio mi procura fatica / Exercise brings on my fatigue | 1 | 2 | 3 | 4 | 5 | 6 | 7 |
Io sono facilmente affaticato / I am easily fatigued | 1 | 2 | 3 | 4 | 5 | 6 | 7 |
La fatica interferisce con il mio funzionamento fisico / Fatigue intereferes with my physical functioning | 1 | 2 | 3 | 4 | 5 | 6 | 7 |
La fatica causa frequenti problemi per me / Fatigue causes frequent problems for me | 1 | 2 | 3 | 4 | 5 | 6 | 7 |
La mia fatica impedisce un funzionamento fisico sostenuto / My fatigue prevents sustained physical functioning | 1 | 2 | 3 | 4 | 5 | 6 | 7 |
La fatica interferisce con lo svolgimento di certi doveri e responsabilità / Fatigue interferes with carrying out certain duties and responsibilities | 1 | 2 | 3 | 4 | 5 | 6 | 7 |
La fatica è tra i miei tre sintomi più disabilitanti / Fatigue is among my three most disabling symptoms | 1 | 2 | 3 | 4 | 5 | 6 | 7 |
La fatica interferisce con il mio lavoro, la famiglia, o la vita sociale / Fatigue interferes with my work, family, or social life | 1 | 2 | 3 | 4 | 5 | 6 | 7 |

