Thomas Kienbacher, MD1*, Josef Kollmitzer, PhD2, Philipp Anders, BSc1, Richard Habenicht, BSc1, Christian Starek, BSc1, Markus Wolf, BSc1, Birgit Paul, PhD1, Patrick Mair, PhD3 and Gerold Ebenbichler, MD3
From the 1Karl Landsteiner Institute of Outpatient Rehabilitation Research, 2Josef Kollmitzer, University of Applied Sciences, Department of Biomedical Engineering, Vienna, Austria, 3Department of Psychology, Harvard University, Cambridge, MA, USA and 4Department of PMR, Vienna Medical University, Vienna, Austria
OBJECTIVE: To investigate the short- and long-term reliability of isometric trunk strength measurements in patients with chronic low back pain in different age groups.
DESIGN: Test-retest reliability study.
Patients: A total of 210 patients (age groups 18–39, 40–59 and 60–90 years).
METHODS: Patients performed testing at baseline, 1–2 days (day 2) and 6 weeks.
RESULTS: Only the oldest age group showed similar extension strength on all three test days All age groups showed significant changes in rotation and flexion scores from baseline to 6 weeks. Younger age groups (18–39 and 40–59 years) showed significant increases in extension, flexion, and rotation strength at both short-term (baseline to day 2) and long-term (baseline to 6 weeks) retests, but not from day 2 to 6 weeks. In patients over 60 years of age the smallest real differences normalized to baseline (%) were smaller from day 2 to 6 weeks than from baseline to 6 weeks. Long-term intraclass correlation coefficients were lowest between baseline and 6 weeks. No relevant impacts of feelings, motivation, or pain on reliability were detected.
CONCLUSION: Reliability of isometric trunk strength measurements in patients with chronic low back pain is similar in older and younger patients. Short-term test repetition a few days after baseline is recommended, if clinically feasible, and especially in research evaluating the effects of exercise on strength.
Key words: low back pain; ageing; muscle strength dynamometer; torque; reproducibility of results; outcome assessment; rehabilitation.
J Rehabil Med 2016; 00: 00–00
Correspondence address: Thomas Kienbacher, Karl Landsteiner Institute of Outpatient Rehabilitation Research, Porschestraße 29, AT-1230 Vienna, Austria. E-mail: kienbacher@rehabzentrum.at
Accepted Sep 6, 2016: Epub ahead of print Oct 13, 2016
INTRODUCTION
Impaired force-generating capacity of the trunk-stabilizing muscles has been found to correlate with the incidence and severity of low back pain (1, 2). Back muscle weakness may reduce a person’s ability to protect the spinal segments, thereby predisposing the facet joints and discs to greater mechanical stress and structural damage (3). This may be particularly relevant in elderly patients with declining strength. Thus, evaluation of the performance of trunk muscles has been recommended for all functional back assessments (4–7), for load adjustment during progressive trunk muscle exercise programmes (8), and for monitoring treatment outcome (2) . Static strength testing appears to be suitable and safe in both older and younger patients (9, 10) and is required for reimbursement of treatment costs in many industrialized countries; however, tests must be shown to have an adequate level of reliability.
Evidence of such reliability is available for isometric strength testing in patients with chronic low back pain (cLBP) who are under 55 years of age. This suggests that these measures provide an acceptable level of detection of expected strength changes related to therapeutic exercise interventions (11, 12). An extensive literature review by our group found no comprehensive test-retest studies investigating the reliability of isometric trunk muscle strength measurements in patients with cLBP who are over 60 years of age. Older patients may be more vulnerable to day-to-day fluctuations in physical and mental states, and their motivation to perform maximum strength tests may be different from that of younger age groups. Anticipatory feelings and pain in older patients could also be more distinctly modulated from test to retest, which probably affects the reliability of measurements (13).
The aim of this comprehensive study was to investigate the short- and long-term absolute and relative test-retest reliability of maximum isometric trunk muscle strength measurements in patients with cLBP over 60 years of age. Moreover, examination of absolute and relative test-retest reliability of maximum trunk strength tests in middle-aged (40–60 years) and young (18–40 years) patients descriptively explored age-specific differences in test–retest reliability of maximum strength measurements. As motivation, positive and negative feelings, and pain shortly before the maximum test may differ between older and younger ages, which could affect the reliability differently, it was also investigated whether levels of these feelings, motivation, and pain shortly before maximum strength performance would differ between age groups and would have an impact on measurement reliability.
METHODS
Participants
All patients with back pain who were referred, by family doctors, orthopaedic surgeons, and doctors practicing in social security institutions, to the referral ambulatory rehabilitation centre between January 2012 and September 2014 for diagnostic evaluation and treatment were asked to participate in this study and were informed that they would be provided with 6 months of cost-free training after the study, but would receive no exercise programme, training, or therapy during the study. Those patients who were interested in participating completed a short screening questionnaire that assessed the location, duration, and intensity of their pain and some functional limitations and co-morbidities. Thereafter, eligible patients were scheduled for an examination performed by physical medicine and rehabilitation specialists.
A total of 210 patients (112 women, 98 men), age range 18–90 years, were included in this test–retest reliability study. Of these, 67 were in the age range 60–90 years (37 women), 81 were in the range 40–59 years (44 women), and 62 were in the range 18–39 years (31 women). Included patients were generally healthy and had low back pain, with a visual analogue scale (VAS 0–100 mm) score minimum of 30 mm, and neck pain of less than 30 mm on the VAS during the 12 weeks prior to screening. Exclusion criteria were: receipt of healthcare advice for headaches within the past year and more than 5 episodes of headache (1 or more lasting more than 2 days); headache within the last 6 weeks (14); peripheral neurological deficit; spinal fracture, infection, or cancer; previous surgery involving the back region; previous experience of trunk muscle strength testing; performance of exercise more than twice per week or at a competitive level (15); inability to follow verbal instructions in German; and a body mass index (BMI) greater than 35 kg/m2. Patients were asked not to take analgesic drugs, muscle relaxants, or psychochemicals from 2 days before testing.
Data collection was performed in accordance with the principles of the Declaration of Helsinki. The study protocol was approved by the ethics committee of the city of Vienna. Before inclusion, all patients received oral and written information about the study and signed a consent form.
Instrumentation
Isometric trunk muscle moments were collected using specially designed measuring and training units that test trunk extension (F110 extension; DAVID®, David Health Solutions Ltd, Helsinki, Finland), flexion (F130 flexion; DAVID®, Fi), and axial right and left side rotation (F120 rotation; DAVID®, Fi). The methods for obtaining these measurements have been described in detail previously (10). In short, the patient’s lower body was fixated with foot plates, knee pads and belts. A pelvic belt and a dorsal back pad were used to stabilize the hips. Additional shoulder pads were applied for flexion and rotation testing according to the manufacturer’s recommendations. For extension, the trunk was flexed 30° anterior relative to the vertical; for flexion, the position was upright without flexion or extension; and for rotation, the upper body was upright and the lower body was laterally rotated right and left 30° (Fig. 1). A monitor provided visual real-time display of torques to the participants.
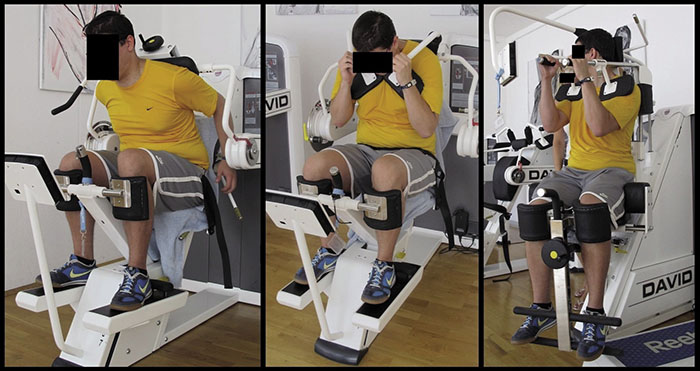
Fig. 1. Isometric testing positions.
Patients’ self-ratings of their positive and negative feelings, motivation and pain were derived and processed from the Avoidance Endurance Questionnaire (16) according to guidelines (10, 17) . Questions addressing positive feelings asked how: “happy, cheerful/in a good mood, optimistic, and relaxed” patients felt, whereas questions addressing negative feelings asked how: “down, anxious/tense, sad/blue, hesitant/wary, nervous/uneasy, vulnerable/sensitive, and depressed/gloomy” they felt. Assessment of motivation comprised questions about the “importance of physical performance, bodily health, physical learning and improvement, and physical well-being” to patients. Patients had to rate their respective expectations using the Borg scale shortly before strength testing was performed. Ratings ranged from 0 (nothing at all) through 10 (extremely strong), allowing a maximum score of 11 if the perceived intensity was higher than extremely strong. This scale has been shown to have excellent reliability (18). Patients also completed the International Physical Activity Questionnaire (IPAQ) (19) and the Pain Disability Index (PDI) (6). Examiners were all experienced in strength testing and performed the measurements under the supervision of physiotherapists working in the referral ambulatory rehabilitation centre. A clinical psychologist provided psychological guidelines for optimum maximum trunk torque measurements and supervised the accuracy and integrity of questionnaire data acquisition.
Procedures
Each patient was evaluated 3 times at approximately the same time of day to control for the effect of circadian rhythms on muscle strength and psychometric measures. The first 2 evaluations (baseline and day 2) were separated by 1–2 days, and the third evaluation (6 weeks) was taken after an interval of approximately 6 weeks. Six weeks is considered the minimum duration of a therapeutic exercise intervention that demonstrates clear improvement of strength (20), and a 6-week intervention is covered by social security in many industrialized countries. For assessment, the following basic steps were conducted under the supervision of 3 experienced examiners: (i) questionnaires that evaluated anticipatory positive and negative feelings, motivation, and back pain were completed on electronic tablets by the patients at baseline, days 2, and 6 weeks, and questionnaires that evaluated physical activity (IPAQ) and disability (PDI) were completed on days 1 and 3; (ii) muscle warm-up and familiarization (21), followed by performance of maximum isometric trunk extension, flexion, and right and left rotation testing was performed on all test days. Patients were asked to maintain their physical activity level during the study.
Detailed methods for the isometric trunk muscle tests have been described previously (10). Standardization of the protocol and verbal instructions given to the patients during testing by the clinically experienced examiners were emphasized. A clinical psychologist (BP) developed the specific encouragements and trained and supervised the examiners during the course of the study. Under these instructions patients performed standardized sub-maximum warm-up and pre-test trials for familiarization, followed by 2 attempts at maximum isometric contractions (extension followed by flexion and then right and left rotation). If the variability in maximum strength exceeded 10%, a third trial was performed. Intervals between maximum test repetitions were a minimum of 15 s. The best result out of the 2 or 3 trials was stored in a central computer. For rotation, the means of the best right and the best left scores were calculated.
The main outcomes were the maximum isometric trunk moments (Nm) derived from the trunk extension, flexion, and rotation tests on different days. Mean rating scores of patients’ anticipatory positive and negative feelings, motivation, and pain were measured as explanatory variables.
Statistical analyses
All statistical analyses were performed using R® environment for statistical computing (21). Procedures that tested the reliability of the maximum strength measurements followed previously published recommendations (22, 23). Appropriate reliability indices were compiled using data inspection procedures (24) that explored the following aspects (22, 23): (i) the systematic bias, determined by calculating the mean differences and accompanying 95% confidence intervals (95% CIs) between experimental days (short- and long-term learning effects); (ii) the precision of measurements, determined by calculating the standard error of measurement (SEM = s√(1.00–r), where s is the standard deviation (SD) and r is the test–retest intraclass correlation coefficient (ICC)), the smallest real difference (SRD =1.96 ×√2 ×SEM), and the smallest real difference relative to the baseline mean in % (SRD %) (25), Bland–Altman plots (26); and (iii) relative reproducibility, as indicated by the ICC2,1 (23). The limits of agreement (LOA) in the Bland–Altman plot were calculated by using the mean and the standard deviation (SD) of the differences between 2 measurements. Differences within the LOA limits were not considered clinically important. In that case, the 2 measurement methods were used interchangeably.
After median splitting (high, low level) of the sub-scores of positive and negative feelings, motivation, and pain, as calculated from the Avoidance Endurance Questionnaire, the generated dichotomized categories were used to examine the impact of these factors on the short- and long-term retest ICCs (95% CIs). For each subgroup, an ICC with the corresponding 95% CI was computed.
RESULTS
Of the 210 patients included in the study, 8 (1 middle-aged women, 3 middle-aged men and 4 young men) refused to undergo retests for personal reasons. Five patients (2 older women, 2 older men, and 1 middle-aged men) were excluded from the study due to medical treatment/inter-current disease. One older women dropped out due to severe pain after the second test. Another older women was excluded because she was unable to comply with the instructions. A total of 195 patients completed all assessments; 38 out of the 1,755 planned measurement results (i.e. 195 patients with 3 tests (extension, flexion, rotation) on 3 days) were lost due to unsuccessful saving of the data. Patient characteristics are presented in Table I.
Patients’ IPAQ and PDI ratings remained unchanged during the study, and the interval between test days was similar in all groups (data not shown).
|
Table I. Demographics, pain, disability, physical activity, feelings, and motivation at baseline |
||||||||
|
Age/sex |
Age, years |
BMI, kg/m2 |
Paina |
PDI |
IPAQb |
Pos. feelingsc |
Neg. feelingsc |
Motivationc |
|
Median (IQR) |
Median (IQR) |
Median (IQR) |
Median (IQR) |
Median (IQR) |
Median (IQR) |
Median (IQR) |
Median (IQR) |
|
|
18–39 years |
||||||||
|
All |
27.5 (22.8; 33.2) |
23.13 (20.78; 26.67) |
3.10 (2.58; 3.90) |
15.00 (8.25; 24.75) |
3,424 (1,548; 6,027) |
2.83 (2.02; 3.42) |
1.04 (0.79; 1.56) |
5.70 (4.42; 6.59) |
|
Men |
29.7 (25.4; 35.5) |
24.96 (22.62; 28.32) |
3.10 (2.65; 3.85) |
17.00 (10.50; 30.50) |
2,424 (860; 6,070) |
2.80 (2.01; 3.38) |
1.01 (0.79; 1.49) |
6.08 (4.47; 6.71) |
|
Women |
25.4 (20.7; 31.6) |
21.37 (20.18; 25.89) |
3.10 (2.50; 3.90) |
11.00 (7.00; 23.50) |
3,965 (2,067; 5,914) |
2.85 (2.04; 3.41) |
1.07 (0.81; 1.66) |
5.53 (4.26; 6.24) |
|
40–59 years |
||||||||
|
All |
49.8 (44.9; 54.2) |
25.78 (22.84; 28.55) |
3.10 (2.88; 4.00) |
14.50 (7.75; 21.00) |
5,055 (2,002; 8,212) |
2.89 (2.26; 3.63) |
1.07 (0.78; 1.52) |
5.44 (4.07; 7.16) |
|
Men |
48.6 (44.9; 52.6) |
26.70 (25.33; 28.43) |
3.10 (3.00; 4.00) |
15.00 (10.00; 21.00) |
4,416 (1,262; 7,280) |
3.08 (2.60; 3.58) |
1.07 (0.77; 1.87) |
5.60 (4.80; 6.83) |
|
Women |
51.3 (45.8; 55.4) |
24.68 (22.08; 28.52) |
3.10 (2.85; 4.00) |
14.00 (7.00; 20.50) |
5,445 (2,506; 9,014) |
2.52 (2.08; 3.67) |
1.07 (0.80; 1.47) |
4.80 (3.75; 7.86) |
|
60–90 years |
||||||||
|
All |
68.3 (64.9; 72.1) |
27.26 (24.57; 30.20) |
3.00 (2.00; 3.90) |
19.50 (10.00; 27.00) |
3,243 (2,044; 6,106) |
2.77 (1.98; 3.60) |
1.10 (0.80; 1.86) |
5.30 (4.28; 7.05) |
|
Men |
68.5 (65.3; 72.4) |
27.16 (25.13; 30.41) |
2.75 (1.88; 3.20) |
20.00 (13.50; 24.25) |
3,586 (2,258; 6,408) |
2.61 (1.99; 3.12) |
0.92 (0.73; 1.67) |
5.33 (4.20; 7.44) |
|
Women |
68.1 (64.1; 71.5) |
27.36 (23.87; 29.84) |
3.20 (2.00; 4.10) |
17.50 (9.00; 30.25) |
2,529 (2,030; 5,614) |
3.15 (1.98; 3.67) |
1.26 (1.07; 1.86) |
5.30 (4.33; 6.72) |
|
aBorg Scale rating; btotal physical activity (MET/week); cAvoidance Endurance Questionnaire (Borg Scale rating). BMI: body mass index; IQR: interquartile range; M: male; F: female; PDI: Pain Disability Index; IPAQ: International Physical Activity Questionnaire. |
||||||||
Maximum isometric trunk strength scores of older patients were similar to those of younger patients, except for trunk flexion (F: 6.1; p < 0.003). Males demonstrated significantly higher scores than females in all age groups and on all test days. Absolute trunk extension torques were higher than those of flexion and rotation (Table II). Patients’ positive feelings, motivation, and pain were found to be moderate, whereas their negative feelings were minimal (Table I). No significant differences in any of these factors were found between age groups or sex (data not shown).
|
Table II. Absolute torques and longitudinal changes |
|||||||
|
Age/sex |
na |
Baseline Mean (SD) |
Day 2 Mean (SD) |
6 weeks Mean (SD) |
Baseline/day 2 Mean (95% CI) |
Baseline/6 weeks Mean (95% CI) |
Day 2/6 weeks Mean (95% CI) |
|
Lumbar/thoracic extension torque (Nm) |
|||||||
|
60–90 years |
|||||||
|
All |
61, 61, 61 |
201.84 (88.64) |
204.44 (87.54) |
210.11 (86.77) |
2.61 (–5.04;10.25) |
8.28 (–0.57;17.13) |
5.67 (–1.63;12.98) |
|
Men |
28, 28, 28 |
270.79 (80.14) |
275.39 (78.05) |
275.79 (75.13) |
4.61 (–9.56;18.78) |
5.00 (–10.55;20.55) |
0.39 (–11.33;12.11) |
|
Women |
33, 33, 33 |
143.33 (40.32) |
144.24 (32.98) |
154.39 (48.78) |
0.91 (–7.31;09.13) |
11.06 (0.63;21.49)* |
10.15 (0.70;19.60)* |
|
40–59 years |
|||||||
|
All |
76, 76, 76 |
199.66 (75.76) |
204.01 (75.98) |
209.72 (81.44) |
4.36 (–2.27;10.98) |
10.07 (2.23;17.90)* |
5.71 (–2.02;13.44) |
|
Men |
33, 33, 33 |
258.55 (62.30) |
261.21 (57.64) |
268.36 (68.78) |
2.67 (–10.61;15.95) |
9.82 (–4.98;24.62) |
7.15 (–8.37;22.67) |
|
Women |
43, 43, 43 |
160.12 (56.88) |
164.72 (58.85) |
5.65 (–0.71;12.01) |
10.26 (1.70;18.81)* |
4.60 (–2.80;12.01) |
|
|
18–39 years |
|||||||
|
All |
58, 58, 58 |
207.97 (78.71) |
222.16 (83.83) |
225.36 (88.67) |
14.19 (6.32;22.06)* |
17.40 (8.05;26.74)* |
3.21 (–4.10;10.52) |
|
Men |
27, 27, 27 |
266.15 (66.58) |
282.52 (75.05) |
287.59 (81.44) |
16.37 (2.78;29.96)* |
21.44 (3.22;39.67)* |
5.07 (–6.66;16.81) |
|
Women |
31, 31, 31 |
157.29 (47.20) |
169.58 (48.31) |
171.16 (51.66) |
12.29 (2.80;21.78)* |
13.87 (5.42;22.33)* |
1.58 (–8.12;11.28) |
|
Lumbar/thoracic flexion torque (Nm) |
|||||||
|
60–90 years |
|||||||
|
All |
60, 61, 61 |
109.43 (41.15) |
112.31 (39.93) |
116.30 (40.52) |
2.33 (–1.39;6.06) |
6.23 (2.25;10.21)* |
3.98 (0.70;7.26)* |
|
Men |
27, 28, 28 |
146.07 (28.07) |
147.96 (27.24) |
151.68 (28.77) |
2.00 (–4.35;8.35) |
5.52 (–1.02;12.06) |
3.71 (–02.43;9.86) |
|
Women |
33, 33, 33 |
79.45 (20.55) |
82.06 (17.52) |
86.27 (18.83) |
2.61 (–2.06;7.27) |
6.82 (1.62;12.01)* |
4.21 (0.75;07.68)* |
|
40–59 years |
|||||||
|
All |
76, 75, 75 |
122.37 (49.93) |
128.80 (51.28) |
127.39 (51.89) |
5.71 (1.65;09.76)* |
4.69 (0.56;8.83)* |
–1.65 (–5.29;1.99) |
|
Men |
33, 33, 33 |
168.21 (35.78) |
174.79 (36.15) |
175.30 (35.07) |
6.58 (–1.09;14.24) |
7.09 (–1.28;15.46) |
0.52 (–6.54;7.57) |
|
Women |
43, 42, 42 |
87.19 (23.62) |
92.67 (26.18) |
89.74 (24.50) |
5.02 (0.67;9.38)* |
2.81 (–0.88;6.50) |
–3.39 (–6.95;0.17) |
|
18–39 years |
|||||||
|
All |
56, 58, 57 |
124.00 (52.22) |
131.76 (55.12) |
129.65 (55.44) |
9.18 (5.93;12.43)* |
7.73 (4.08;11.37)* |
–1.75 (–5.63;2.12) |
|
Men |
27, 27, 26 |
164.52 (42.77) |
177.00 (44.21) |
175.08 (45.37) |
12.48 (7.30;17.66)* |
9.96 (3.89;16.03)* |
–2.88 (–10.24;4.47) |
|
Women |
29, 31, 31 |
86.28 (24.52) |
92.35 (25.13) |
91.55 (27.09) |
6.10 (2.11;10.09)* |
5.72 (1.22;10.23)* |
–0.81 (–4.82;03.21) |
|
Lumbar/thoracic rotation torque mean right/left (Nm) |
|||||||
|
60–90 years |
|||||||
|
All |
60, 61, 60 |
76.01 (44.16) |
84.80 46.22) |
87.04 (46.67) |
7.84 (3.90;11.79)* |
9.40 (3.77;15.03)* |
1.82 (–2.79;6.42) |
|
Men |
27, 28, 28 |
111.63 (40.90) |
125.91 34.98) |
124.43 (39.97) |
13.69 (5.60;21.77)* |
11.46 (–0.52;23.44) |
–1.48 (–10.72;7.76) |
|
Women |
33, 33, 32 |
46.86 (17.03) |
49.92 15.50) |
54.33 (19.69) |
3.06 (0.88;5.24)* |
7.66 (4.12;11.20)* |
4.70 (1.24;8.17)* |
|
40–59 years |
|||||||
|
All |
74, 74, 73 |
83.04 (37.84) |
91.85 41.76) |
93.16 (43.04) |
8.86 (4.32;13.40)* |
8.83 (3.67;13.99)* |
–0.10 (–4.57;4.37) |
|
Men |
32, 32, 33 |
114.08 (30.80) |
126.12 (33.36) |
127.11 (34.88) |
12.74 (3.36;22.13)* |
12.83 (2.97;22.69)* |
0.73 (–8.30;9.77) |
|
Women |
42, 42, 40 |
59.39 (22.53) |
65.74 (25.45) |
65.16 (25.36) |
5.93 (2.05;09.81)* |
5.55 (0.52;10.58)* |
–0.78 (–4.66;3.09) |
|
18–39 years |
|||||||
|
All |
57, 57, 55 |
82.11 (46.63) |
92.93 (47.88) |
95.59 (49.41) |
11.43 (5.49;17.37)* |
13.20 (7.13;19.28)* |
1.41 (–3.58;6.40) |
|
Men |
27, 26, 25 |
110.89 (50.55) |
127.48 (45.61) |
133.56 (44.87) |
15.50 (4.29;26.71)* |
19.22 (8.29;30.15)* |
2.94 (–7.89;13.77) |
|
Women |
30, 31, 30 |
56.20 (21.03) |
63.95 (25.35) |
63.95 (24.54) |
7.90 (2.11;13.69)* |
8.02 (1.69;14.34)* |
0.18 (–3.28; 3.65) |
|
*Significant changes in the mean. an: number of patients at baseline, Day 2 after baseline, and 6 weeks after baseline. CI: 95% confidence interval. SD: standard deviation; 95% CI: 95% confidence interval; M: male; F: female. |
|||||||
Absolute test-retest reliability measures in patients over 60 years of age with chronic low back pain:
Bland–Altman plots revealed similar variability across performance differences between days for the extension, flexion, and rotation tests for older male and female patients compared with the younger patients (Figs 2 and 3). For the female older patient group, the SEMs were smaller than those for males in all 3 test directions (Table III). SEMs normalized to the means were, except for that of trunk rotation, close to or less than 10% (data not shown). In the short- and long-term, the SRDs were higher for lumbar extension than for flexion and rotation, and for males than for females (Table III). For the entire group of older patients, as well as for the 2 sex-specific groups, the SRD %, normalized to the baseline values, of the extension and flexion strength assessments were smaller than those of the rotation test, and overall, the SRD % values were higher between baseline and 6 weeks than between day 2 and 6 weeks.
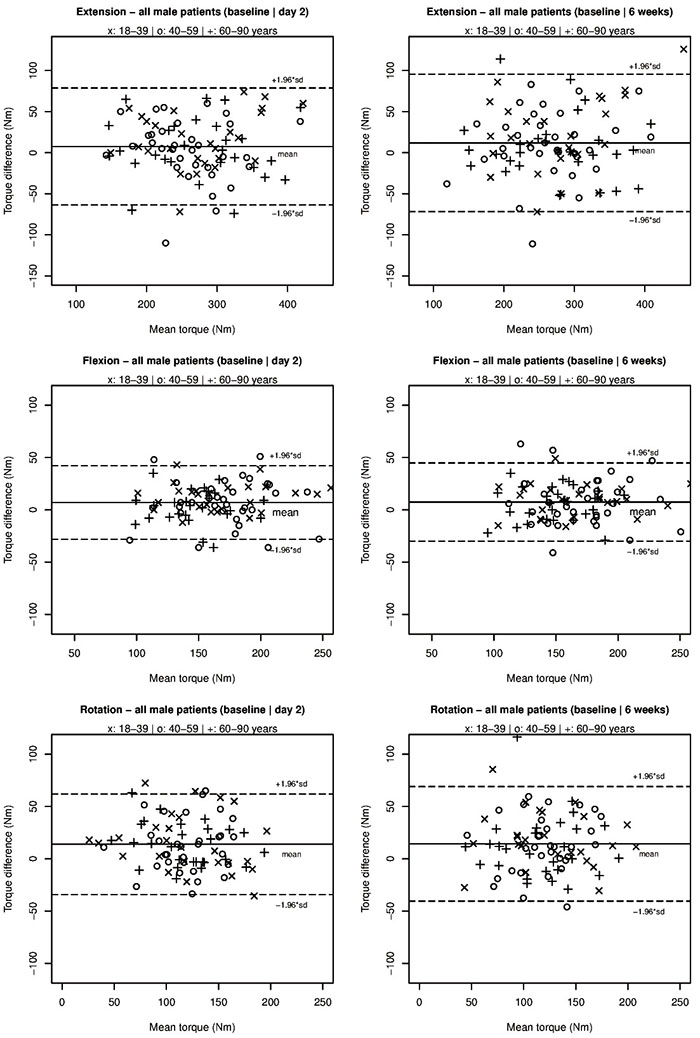
Fig. 2. Bland–Altman plots of torque changes between test days in males. Solid line: mean difference; dashed lines: 95% limits of agreement (LOA; mean difference ± 1.96 standard deviation (SD)).
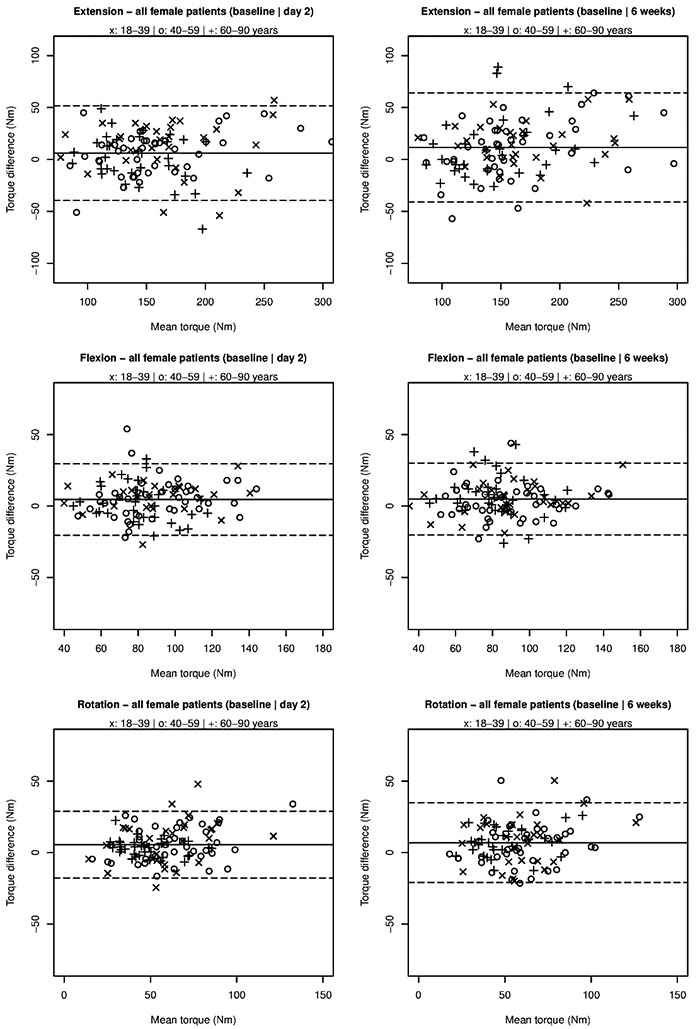
Fig. 3. Bland–Altman plots of torque changes between test days in females.
|
Table III. Measures of reliability |
|||||||||
|
Age/sex |
Baseline/day 2 ICC Mean (95% CI) |
Baseline/6 weeks ICC Mean (95% CI) |
Day 2/6 weeks ICC Mean (95% CI) |
Baseline/day 2 SEM |
Baseline/6 weeks SEM |
Day 2/6 weeks SEM |
Baseline/day 2 SRD (%) |
Baseline/6 weeks SRD (%) |
Day 2/6 weeks SRD (%) |
|
Lumbar/thoracic extension torque (Nm) |
|||||||||
|
60–90 years |
|||||||||
|
All |
0.94 (0.91;00.97) |
0.92 (0.87;00.95) |
0.95 (0.91;00.97) |
21.11 |
24.43 |
20.17 |
±58.47 (28.80) |
±67.68 (32.88) |
±55.87 (26.97) |
|
Men |
0.90 (0.79;00.95) |
0.87 (0.74;00.94) |
0.92 (0.84;00.96) |
25.84 |
28.35 |
21.37 |
±71.57 (26.23) |
±78.54 (28.76) |
±59.20 (21.50) |
|
Women |
0.81 (0.64;00.90) |
0.77 (0.57;00.88) |
0.78 (0.58;00.89) |
16.39 |
20.79 |
18.84 |
±45.41 (31.61) |
±57.60 (38.72) |
±52.18 (34.97) |
|
40–59 yearsl |
|||||||||
|
All |
0.93 (0.89;00.95) |
0.90 (0.84;00.94) |
0.91 (0.86;00.94) |
20.50 |
24.25 |
23.91 |
±56.77 (28.15) |
±67.17 (32.84) |
±66.23 (32.04) |
|
Men |
0.81 (0.65;00.90) |
0.79 (0.62;00.89) |
0.76 (0.57;00.87) |
26.49 |
29.51 |
30.95 |
±73.37 (28.25) |
±81.75 (31.05) |
±85.73 (32.40) |
|
Women |
0.92 (0.86;00.96) |
0.86 (0.74;00.92) |
0.91 (0.84;00.95) |
14.62 |
19.66 |
17.02 |
±40.49 (25.76) |
±54.46 (34.15) |
±47.13 (29.04) |
|
18–39 years |
|||||||||
|
All |
0.92 (0.84;00.96) |
0.89 (0.78;00.94) |
0.95 (0.91;00.97) |
21.16 |
25.12 |
19.65 |
±58.61 (27.27) |
±69.59 (32.14) |
±54.44 (24.35) |
|
Men |
0.86 (0.69;00.94) |
0.78 (0.55;00.90) |
0.93 (0.85;00.97) |
24.30 |
32.58 |
20.98 |
±67.30 (24.55) |
±90.24 (32.62) |
±58.11 (20.40) |
|
Women |
0.83 (0.64;00.92) |
0.86 (0.65;00.94) |
0.86 (0.74;00.93) |
18.30 |
16.30 |
18.70 |
±50.70 (31.04) |
±45.15 (27.51) |
±51.80 (30.42) |
|
Lumbar/thoracic flexion torque (Nm) |
|||||||||
|
60–90 years |
|||||||||
|
All |
0.94 (0.90;00.96) |
0.92 (0.85;00.95) |
0.95 (0.91;00.97) |
10.19 |
10.89 |
9.06 |
±28.22 (25.47) |
±30.18 (26.75) |
±25.09 (21.96) |
|
Men |
0.84 (0.68;00.92) |
0.82 (0.65;00.92) |
0.84 (0.68;00.92) |
11.35 |
11.69 |
11.21 |
±31.44 (21.40) |
±32.39 (21.76) |
±31.05 (20.74) |
|
Women |
0.76 (0.57;00.87) |
0.69 (0.43;00.84) |
0.84 (0.67;00.92) |
9.31 |
10.36 |
6.91 |
±25.79 (31.95) |
±28.70 (34.66) |
±19.14 (22.76) |
|
40–59 years |
|||||||||
|
All |
0.93 (0.89;00.96) |
0.93 (0.90;00.96) |
0.95 (0.93;00.97) |
12.47 |
12.72 |
11.11 |
±34.53 (27.52) |
±35.22 (28.23) |
±30.77 (24.04) |
|
Men |
0.81 (0.65;00.90) |
0.77 (0.58;00.88) |
0.85 (0.71;00.92) |
15.28 |
16.69 |
14.06 |
±42.33 (24.70) |
±46.23 (26.93) |
±38.95 (22.27) |
|
Women |
0.83 (0.69;00.91) |
0.88 (0.78;00.93) |
0.90 (0.81;00.94) |
9.89 |
8.38 |
7.97 |
±27.38 (30.48) |
±23.22 (26.27) |
±22.08 (24.22) |
|
18–39 years |
|||||||||
|
All |
0.96 (0.85;00.98) |
0.96 (0.90;00.98) |
0.97 (0.94;00.98) |
8.58 |
9.53 |
10.32 |
±23.78 (18.60) |
±26.41 (20.84) |
±28.59 (21.89) |
|
Men |
0.92 (0.55;00.97) |
0.92 (0.75;00.97) |
0.92 (0.83;00.96) |
9.26 |
10.62 |
12.87 |
±25.65 (15.03) |
±29.43 (17.35) |
±35.65 (20.26) |
|
Women |
0.89 (0.71;00.95) |
0.88 (0.73;00.95) |
0.91 (0.83;00.96) |
7.41 |
8.38 |
7.73 |
±20.54 (22.98) |
±23.20 (26.09) |
±21.42 (23.31) |
|
Lumbar/thoracic rotation torque mean right/left (Nm) |
|||||||||
|
60–90 years |
|||||||||
|
All |
0.93 (0.85;00.96) |
0.87 (0.76;00.93) |
0.93 (0.88;00.96) |
10.79 |
15.27 |
12.61 |
±29.90 (37.19) |
±42.30 (51.92) |
±34.93 (40.69) |
|
Men |
0.81 (0.50;00.92) |
0.70 (0.44;00.85) |
0.80 (0.62;00.90) |
14.45 |
21.42 |
16.85 |
±40.04 (33.69) |
±59.32 (50.25) |
±46.68 (37.31) |
|
Women |
0.91 (0.80;00.96) |
0.79 (0.40;00.92) |
0.83 (0.64;00.92) |
4.35 |
6.94 |
6.80 |
±12.04 (24.90) |
±19.23 (38.08) |
±18.82 (36.16) |
|
40–59 years |
|||||||||
|
All |
0.86 (0.75;00.92) |
0.84 (0.73;00.90) |
0.90 (0.85;00.94) |
13.66 |
15.41 |
13.35 |
±37.84 (43.31) |
±42.69 (48.51) |
±36.98 (40.01) |
|
Men |
0.65 (0.35;00.82) |
0.62 (0.33;00.80) |
0.74 (0.53;00.86) |
18.09 |
19.34 |
17.73 |
±50.11 (41.75) |
±53.56 (44.41) |
±49.10 (38.80) |
|
Women |
0.85 (0.69;00.92) |
0.78 (0.60;00.88) |
0.89 (0.80;00.94) |
8.70 |
10.97 |
8.46 |
±24.09 (38.52) |
±30.38 (48.87) |
±23.42 (35.80) |
|
18–39 years |
|||||||||
|
All |
0.87 (0.73;00.93) |
0.86 (0.68;00.93) |
0.93 (0.88;00.96) |
15.68 |
15.74 |
12.93 |
±43.42 (49.65) |
±43.61 (49.18) |
±35.82 (38.03) |
|
Men |
0.80 (0.54;00.91) |
0.78 (0.40;00.91) |
0.84 (0.66;00.93) |
19.62 |
18.73 |
18.13 |
±54.34 (45.68) |
±51.88 (42.63) |
±50.23 (38.53) |
|
Women |
0.75 (0.48;00.88) |
0.71 (0.43;00.86) |
0.93 (0.87;00.97) |
10.97 |
11.76 |
6.56 |
±30.39 (50.57) |
±32.58 (54.27) |
±18.17 (28.43) |
|
Note that the SRD is equal to the minimal detectable change (MDC). ICC: intraclass correlation coefficient; SEM: standard error of measurement; SRD: smallest real difference; SRD%: smallest real difference (%); SD: standard deviation; M: male; F: female. |
|||||||||
The female patients over 60 years of age showed significantly higher extension, flexion and rotation torques at long-term retests compared with baseline with significant short term rotation changes (Table II). The results for the males with respect to the same variables were not significant. However, on a descriptive level older males showed the same tendency as older females.
Younger low back pain patient groups
The SEM, SRD and SRD % results for the younger male and female groups were similar to those for the oldest patients, except that the middle-aged groups did not have smaller extension SRD % values than for rotation. Moreover, the youngest patients did not show smaller flexion SRD % values than for rotation from days 2 to 6 weeks.
In the female middle-aged patient group, the maximum extension torques increased significantly from baseline to 6 weeks. In addition, flexion torques increased significantly for the female subgroup from baseline to day 2. The rotation scores of both the middle-aged sex-specific subgroups improved from baseline to day 2 and from baseline to 6 weeks. No long-term changes in the means of any of the test results were observed when day 2 was used as baseline for either the sexes or sex-specific data.
In both of the sex-specific youngest groups, all trunk torque measurements improved in both the short- and long-term relative to baseline. There were, however, no changes in the means between test days 2 and 6 weeks.
Relative test-retest reliability measures
The short- and long-term extension and flexion ICCs for the older male group were overall higher than those for the female group. The ICCs of both sex subgroups between baseline and 6 weeks were lower than those between days 2 and 6 weeks for all tests (Table III).
The extension, flexion, and rotation ICCs were similar in the sex-specific younger, middle-aged, and older patient groups.
Impact on reliability of patients’ anticipatory positive and negative feelings, motivation, and pain
Graphical inspection of the ICCs, each related to a pair of low and high categories of positive feelings, negative feelings, motivation, and pain, revealed clearly overlapping 95% CIs. This suggests that none of these factors had a relevant impact on reliability for patients in any of the subgroups (Fig. 4).
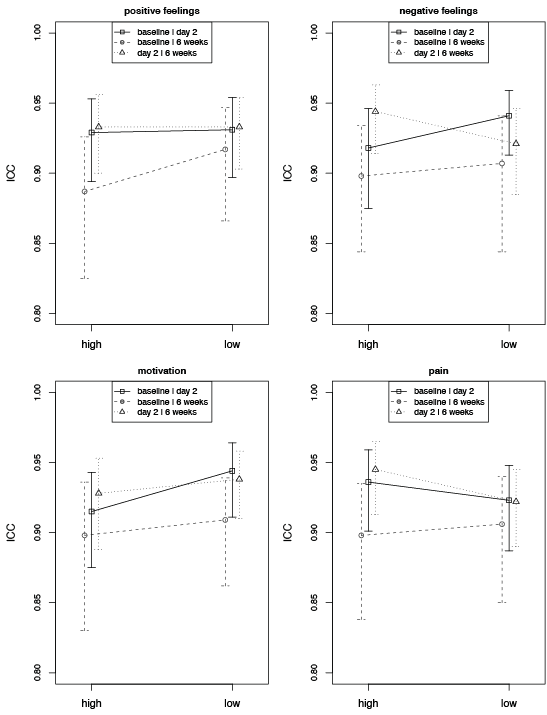
Fig. 4. Low=score lower than median; high=score higher than median; ICC: interclass correlation coefficient.
DISCUSSION
This study, which addressed the short- and long-term reliability of maximum isometric trunk strength measurements in patients with cLBP according to age, revealed 3 main findings. First, older patients’ short- and long-term strength reliability measures were good to excellent (27) and they were similar to those of younger patients. Secondly, patients over 60 years of age demonstrated fewer learning effects than younger patients. Thirdly, older patients’ feelings, motivation, and pain were similar to those of younger patients and did not affect the reliability of test results.
Consistent with findings from this study, absolute trunk muscle strength has repeatedly been demonstrated to be smaller in female than male patients with LBP (9, 12). Mean measurement errors, as observed in our study, consequently revealed overall smaller absolute values in female than in male patients, with no major differences between the 3 different age groups, suggesting sex-related, but not age-related, heteroscedasticity of the data. Normalization of the SEMs to the mean of 2 measurements for pooled data and each of the sex-specific age groups, however, revealed all relative values of approximately 10%. This suggests an overall measurement error that would be deemed acceptable for clinical use (22). In addition, SEM values normalized to the mean of 2 measurements were found to be unanimous between the young, middle-aged and old males and females. Such observation has a relevant implication: with test variability being relatively equivalent for healthy young and elderly persons, it may be suggested that the previously reported SEM of the different isometric trunk muscle test devices that assessed the maximum sitting-position trunk muscle moments for young participants can be extended to elderly persons. The methods error observed in elderly people in this study indeed seemed comparable to that observed in previous research in younger patients if they had similar maximum strength values (11).
The mean SRD and their normalized values in % (SRD %) of the trunk extension and flexion torques of all age and sex groups suggest that these tests are sufficiently sensitive to detect a change caused by a therapeutic exercise intervention (28). Other studies have found a variety of isometric strength changes after exercise programmes in patients with cLBP. One study reported a 30% increase in isometric strength after 8 weeks, whereas others found smaller changes after 6 months (29) and after 8 weeks (30). It seems that research protocols and clinical practice vary considerably with regard to the type of exercise used, intensity, frequency, progression, and duration. The present study found SRD % values of approximately 20–30%, with lower long-term SRD % values when a test repetition was performed for baseline in all tests for the older patients and almost all tests for the younger patients. Thus, for detection of a training-related strength change, a second baseline test before the initiation of specific rehabilitation programmes seems to be important, especially in a research context.
Patients over 60 years of age showed relevant learning effects in isometric flexion and rotation trunk strength tests that were similar to those demonstrated by younger patients. This seems inconsistent with a previous study that used a similar sitting test device and observed no systematic changes in 12 patients with cLBP in the age range 20–52 years (11). The number of patients participating in that study was deemed too small for the determination of learning effects because changes in the mean were reportedly larger when retesting patients 1 to 7 days after the first assessment. In the present study, all long-term changes in the means of the measurements in patients under 60 years of age disappeared from days 2 to 6 weeks. Thus, performing a second strength assessment a few days after the first assessment should be considered for baseline evaluation before treatment in all patients with cLBP under 60 years of age. In contrast, the group of patients over 60 years of age showed no learning effects for the trunk extension; only the female subgroup showed minor long-term learning effects from baseline to 6 weeks and days 2 to 6 weeks. This is important, because the muscular deficit of the trunk in patients with cLBP is predominately in the extensor muscles, and a second assessment a few days after the first assessment would not help minimize this bias in older females (31).
The excellent relative reliability of sagittal plane and the good to excellent relative reliability of the rotational strength measurements observed in patients over 60 years of age seems to be in agreement with previously published data from younger age groups (11, 12, 32–34). Such findings suggest that the ICCs reported for extension and flexion tests in younger age groups can be generalized to older age groups. Since long-term ICCs derived from test repetition after baseline (days 2 to 6 weeks) were higher than those from the baseline test (baseline to 6 weeks) in all age groups and all 3 test conditions (extension, flexion, and rotation), a second strength test a few days after the first is recommended for baseline evaluation in everyday clinical practice.
We hypothesized that pain, feelings, or motivation to perform a maximum strength test would differ between the different age groups, thus interfering with the reliability of the measurements observed from older and younger patients with cLBP. However, neither age-specific differences nor correlations were found for any of the patient age groups, nor for either sex. These findings are similar to those of a previous study performed in healthy individuals (10).
Study limitations
Patients in this strength testing study were community-dwelling active patients with few negative feelings and relatively low pain scores. It is likely that our sample may not be representative of all patients with cLBP. Measurement reliability for the different subgroups was not addressed in this research and will have to be clarified in the future.
Conclusion
The reliability of isometric trunk strength measurements is similar in older and younger patients with cLBP. Short-term test repetition before therapy a few days after baseline is recommended in research and, whenever feasible, in clinical practice, especially when measurements are used to monitor the progress of treatment programmes, and for improvement of the sensitivity to detect a change caused by an exercise intervention. Novel SRD data are provided for the interpretation of strength changes.
The authors declare no conflicts of interests.
REFERENCES

