
From the 1Department of Rehabilitation Sciences, Faculty of Health and Social Sciences, 2School of Nursing, Faculty of Health and Social Sciences, The Hong Kong Polytechnic University, Hong Kong (SAR), China
Objectives: To investigate: (i) the intra-rater, inter-rater and test-retest reliabilities of completion times and step counts on the Standardized Walking Obstacle Course test (SWOC); (ii) correlations between SWOC scores and stroke-specific impairments; (iii) the cut-off SWOC completion times and step counts for distinguishing differences in obstacle negotiation ability in people with chronic stroke and healthy older adults.
Design: Cross-sectional study.
Setting: University-based rehabilitation centre.
Subjects: Twenty-nine people with stroke and 30 healthy older adults.
Methods: SWOC completion times and step counts were measured under 3 conditions: (i) normal walking; (ii) walking with a tray; and (iii) walking with dark-glasses. The Fugl-Meyer Assessment of lower extremity, the Five-Times-Sit-to-Stand Test, the Berg Balance Scale, the Timed Up and Go Test (TUG), and the Community Integration Measure questionnaire, were also administered.
Results: SWOC completion times and step counts showed very satisfactory to excellent reliabilities (intraclass correlation coefficient; ICC = 0.851–0.993). TUG times correlated significantly with SWOC completion times and step counts under the 3 conditions (r = 0.586–0.815, p < 0.001). SWOC completion times of 14.73–16.00 s and step counts of 23.06–24.13, depending on different walking conditions, were able to discriminate between stroke survivors and healthy older adults.
Conclusion: The SWOC is a reliable clinical tool for assessing obstacle negotiation ability in people with stroke.
Key words: walking; stroke; rehabilitation; balance; outcomes.
Accepted Jun 15, 2017; Epub ahead of print Sep 1, 2017
J Rehabil Med 2017; 49: 00–00
Correspondence address: Shamay S. M. Ng, Department of Rehabilitation Sciences, The Hong Kong Polytechnic University, Hong Kong (SAR), China. E-mail: Shamay.Ng@polyu.edu.hk
Stroke was the third leading cause of global disability-adjusted life-years in 2010, a measure of the number of life-years lost due to disability or early death (1). Walking adaptability, defined as the ability to modify walking to meet task goals and environmental demands, is often severely compromised after stroke, yet it is rarely assessed (2). Walking adaptability comprises 9 aspects: temporal demands, ambient demands, terrain demands, physical load, cognitive dual-tasking, motor dual-tasking, postural transitions, obstacle negotiation and manoeuvring in traffic, and is crucial to safe ambulation in different environments (2). A previous study found that people with stroke had delayed onset and reduced amplitude of muscle activation during obstacle crossing (3). Obstacle negotiation is especially important for people with stroke, as fall rates were found to be 6 times higher in those who failed an obstacle crossing task than those who passed (4).
Existing instruments for measuring obstacle negotiation have some limitations. A previous study used a laboratory-based obstacle avoidance test, in which obstacles were dropped by an electromagnet while patients walked on a treadmill (3). The spatial and temporal characteristics of the avoidance strategy were captured by a 3-dimensional motion analysis system. However, the clinical administration of this instrument is limited by the need for specialized equipment. In addition, performance on the treadmill could not reflect overground walking in real life. Another test, the Obstacle-negotiating Gait, consisting of 6 obstacle blocks placed 2 m apart on a 10-m course, was used to test obstacle negotiation (5). However, evenly placed regular-shaped obstacles cannot adequately simulate normal community circumstances.
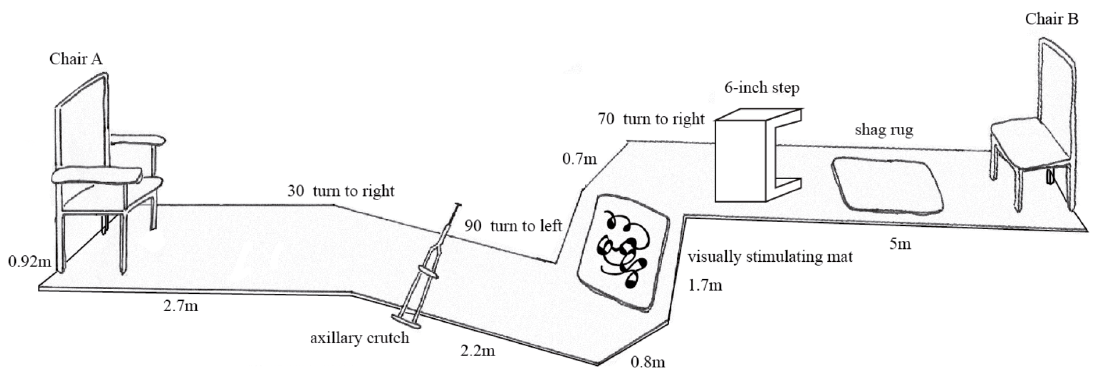
The Standardized Walking Obstacle Course (SWOC) is a safe, efficient, easy-to-administer and convenient test of obstacle negotiation (6). The SWOC consists of a 12.2-m long, 0.92-m wide curved pathway, with obstacles commonly encountered in daily life. Completion times, step counts, step offs and number of stumbles are measured. High reliabilities (intraclass correlation coefficient; ICC = 0.84–0.99) have been demonstrated in previous studies of community-dwelling older adults with arthritis (6) and children with developmental disability (7).
Although the SWOC can be used to assess obstacle negotiation, the psychometric properties of the SWOC have not been investigated in people with stroke. The objectives of this study were to: (i) establish the intra-rater, inter-rater and test-retest reliabilities of SWOC completion times and step counts; (ii) investigate the correlation between SWOC completion times and step counts and measures of impairments, activity and participation limitations; (iii) identify the minimal detectable change (MDC) of SWOC completion times and step counts; (iv) determine the cut-off SWOC completion times and step counts that best differentiate people with stroke from healthy older adults.
This was a cross-sectional study. Clear explanations were given to all participants. Written consent was obtained before the data collection process. The ethics committee of the local institution approved the protocol of this study and all procedures were performed according to the principles of the Declaration of Helsinki.
A previous study of 23 children with developmental disabilities yielded excellent reliabilities (ICC = 0.83–0.99) for SWOC completion times and step counts (7). Power analysis (using version 3.1.7 of the G-power software package) showed that a sample size of 27 participants per group was required in order to achieve 80% power to detect an ICC of 0.90 at a significance level of 0.05.
People with stroke were recruited through a local rehabilitation network via poster advertisements. Participants were included if they were: (i) aged 50 years or above; (ii) post-stroke duration > 1 year; (iii) able to finish the assessments independently; (iv) able to give written consent; (v) mentally stable, with an Abbreviated Mental Test score ≥ 7; and (vi) in a stable general medical condition. People with neurological disorders other than stroke or with co-morbidities, such as uncontrolled diabetes, cardiovascular or musculoskeletal conditions that might hinder proper assessment, were excluded.
Healthy older adults aged over 50 years were recruited from a local community centre. Participants with neurological or musculoskeletal conditions that affected their mobility were excluded.
Tests were conducted on 2 separate days. On day 1, demographic data were collected and the SWOC was performed. The SWOC was conducted again with a test-retest interval of 7–10 days. Measurements were taken simultaneously by 2 trained, fixed and independent raters. Raters were required to attend a 2-h training on the procedures of the SWOC test. Each trial consisted of 2 routes: start-to-end (SE) and end-to-start (ES). For each condition, a practice trial and 2 test trials were taken with at least 2 min rest in between to avoid fatigue. Individuals completed other outcome measures on either testing day with a random sequence selected by drawing cards.
Standardized Walking Obstacle Course (SWOC). The SWOC assesses obstacle negotiation (6) as the individual walks (with or without walking aids) along a pathway from chair A to B as start-to-end (SE) and back as end-to-start (ES) in 1 trial (Fig. 1). Completion times are measured with a stopwatch and step counts are counted as the number of contacts between foot and ground. A stumble is counted if the individual’s leg hits an obstacle and a step off is counted if a whole foot steps off the course.
Fig. 1. Side view of the Standardized Walking Obstacle Course (SWOC), from chair A to chair B (start-to-end) and chair B to chair A (end-to-start).
There are 3 conditions: (i) normal walking, (ii) walking with a tray, and (iii) walking with dark-glasses (7). In condition (i), the individual walks as usual. In condition (ii), the individual walks while holding a tray, on which wooden chopsticks, a plastic knife and fork, a paper plate and cup are placed. No restrictions are given regarding how to carry the tray to mimic daily functioning. In condition (iii), the individual wears a pair of dark-glasses to simulate dim-light conditions, such as walking at night or entering a tunnel. The test begins with condition (i), then conditions (ii) and (iii). Standardized instructions are given: “When I say ‘start’, stand up and walk to the chair at the other end and sit down. Try to avoid stumbling or stepping off the track. Walk at normal speed.” For each condition, a practice trial and 2 test trials were taken. Completion times and step counts were taken from the mean of 2 timed trials.
Fugl-Meyer Assessment of lower extremity (FMA-LE). The FMA-LE was developed to quantify lower extremity motor function impairment in hemiplegic stroke patients (8). It was found to have excellent reliability (ICC = 0.89–0.96) in people with stroke (9).
Berg Balance Scale (BBS). The BBS was developed to assess functional balance in older adults while carrying out by 14 functional tasks (10). The scale has excellent reliabilities (ICC = 0.95–0.98) (11).
Five-Times-Sit-To-Stand Test (FTSTS). The FTSTS is used to assess lower limb muscle strength and balance in patients with stroke by measuring the time taken to complete 5 sit-to-stand cycles (12, 13). It showed excellent reliabilities (ICC = 0.970 –0.999) (12). Each participant underwent 3 trials after a practice trial, and the mean of 3 trials was calculated.
Timed up and go test (TUG). The TUG assesses functional mobility by measuring the time taken to complete a series of movements, including transition in and out of a chair, walking and turning (14). Excellent reliability (ICC = 0.95) has been demonstrated in people with stroke (15). Each participant underwent 3 trials after a practice trial, and the mean of 3 trials was calculated.
Community Integration Measure – Cantonese version (CIM). The CIM measures the level of community integration (16). As ability to negotiate obstacles is expected to affect the level of community integration, the CIM was included as one of the outcome measures. The CIM was conducted through an individual face-to-face interview. High test-retest reliability (ICC = 0.84), good internal consistency (Cronbach’s alpha = 0.84) and content validity were established in people with chronic stroke (16).
SPSS software (version 22) (IBM Corp.) was used for data analysis. ICCs were computed to establish intra-rater reliability (ICC3,1), inter-rater reliability (ICC2,2) and test-retest reliability (ICC3,2) (17). As the raters were fixed, model 3 was used for calculating intra-rater and test-retest reliabilities. Model 2 was chosen for calculating inter-rater reliability as the rater is assumed to be a random effect for the generalization of results (17).
Normality was checked with the Shapiro-Wilk test. Correlations were established using Pearson’s r for parametric data and Spearman’s rho for non-parametric data. Since 2 primary outcome measures were used (FMA-LE and BBS) in 3 conditions of SWOC test, the significance level was set to p ≤ 0.008 (0.05/6) after Bonferroni correction. Correlations were classified as good to excellent (r > 0.75), moderate to good (r = 0.5–0.75), fair (r = 0.25–0.49) or no correlation (r < 0.25) (17).
Receiver operating characteristic (ROC) curves were generated to find the best cut-offs for the SWOC completion times and step counts to discriminate between people with stroke and healthy older adults, with a trade-off between sensitivity and 1 minus specificity, as determined by Youden’s Index (17). The area under the curve (AUC) quantitatively measures the accuracy of the discrimination (17).
The MDC represents the smallest amount of change in test result that reflects a real change in ability. It was computed with the test-retest reliability results (17). SEM = Sx√, where Sx is the standard deviation of the SWOC scores and rxx is the reliability coefficient (17).
Twenty-nine people with stroke and 30 healthy older adults were recruited. The participants’ demographics information and test results are shown in Tables I and II. Between-group differences were found for demographics. SE and ES values were analysed separately, as significant differences were found under some conditions using the paired t-test (t = 1.000–2.320, p = 0.028–0.326) but not the Wilcoxon signed-rank test (Z=–1.926, p = 0.054). In general, the completion times and step counts of people with stroke were 84% and 63% higher than those of healthy older adults across the 3 conditions. Significant differences in SWOC results were found between normal walking and walking with tray conditions (t = –10.269–7.281, p < 0.01), as well as between walking with dark-glasses and walking with tray conditions (t = 6.696–8.964, p < 0.01). No significant differences were found between normal walking and walking with dark-glasses conditions (t = –1.868–0.168, p = 0.072–0.892). The reliabilities and correlations for the number of stumbles and step offs were not investigated because only 4–8 people with stroke stumbled or stepped off. No adverse events were reported.
Table I. Demographics of the people with stroke and the healthy older adults
Table II. Mean Standardized Walking Obstacle Course (SWOC) completion times and step counts and stroke-specific impairment outcome measurements for people with stroke and healthy older adults
The SWOC completion times and step counts demonstrated very satisfactory to excellent intra-rater, inter-rater and test-retest reliabilities for normal walking (ICC = 0.856–0.993), walking with a tray (ICC = 0.883–0.989) and walking with dark-glasses (ICC = 0.851–0.993) (Tables III–V). The MDC of SWOC completion times ranged from 2.37 to 3.89 s under different conditions (Table V) and the MDC of step counts ranged from 2.89 to 4.01 (Table V).
Table III. Intra-rater reliability of Standardized Walking Obstacle Course (SWOC) completion times and step counts of people with stroke
Table IV. Inter-rater reliability of Standardized Walking Obstacle Course (SWOC) completion times and step counts of people with stroke
Table V. Test-retest reliability and minimal detectable change (MDC) of Standardized Walking Obstacle Course (SWOC) completion times and step counts of people with stroke
Moderate to excellent positive correlations were shown between the SWOC completion times (r = 0.657–0.815, p < 0.001) and step counts (r = 0.586–0.754, p < 0.001) with TUG completion times. SWOC completion times and step counts showed no significant correlations with other outcome measures. The details are presented in Table VI.
Table VI. Correlations between Standardized Walking Obstacle Course (SWOC) and other instruments (all correlations are Pearson coefficients unless otherwise indicated)
The cut-offs for completion times and step counts in normal walking condition were 15.43 s and 23.19 for SE and 14.73 s and 23.06 for ES, respectively (sensitivity = 97–100%; specificity = 90–97%; AUC = 0.975–0.987; p < 0.001) (Fig. 2). The cut-offs for completion times and step counts in the walking with tray condition were 15.27 s and 24.13 for SE and 16.00 s and 23.19 for ES, respectively (sensitivity = 97–100%; specificity = 90–93%; AUC = 0.989–0.992; p < 0.001) (Fig. 3). The cut-offs for completion times and step counts in walking with dark-glasses condition were 15.30 s and 24.00 for SE and 14.89 s and 23.56 for ES, respectively (sensitivity = 93–100%; specificity = 90–97%; AUC = 0.984–0.987; p < 0.001) (Fig. 4). The values of area under ROC curve, sensitivity and specificity for the optimal cut-off are summarized in Table VII and Fig. 2–4.
Fig. 2. Receiver operating characteristic curves for Standardized Walking Obstacle Course (SWOC) for discriminating between people with stroke and healthy older adults in condition 1 (normal walking): (a) completion times of start-to-end (SE) (area under the curve (AUC) = 0.975); (b) completion times of end-to-start (ES) (AUC = 0.980); (c) step counts of SE (AUC = 0.981); (d) step counts of ES (AUC = 0.987).
Fig. 3. Receiver operating characteristic curves for Standardized Walking Obstacle Course (SWOC) for discriminating between people with stroke and healthy older adults in condition 2 (walking with a tray): (a) completion times of start-to-end (SE) (area under the curve (AUC) = 0.990); (b) completion times of end-to-start (ES) (AUC = 0.990); (c) step counts of SE (AUC = 0.989); (d) step counts of ES (AUC = 0.992).
Fig. 4. Receiver operating characteristic curves for Standardized Walking Obstacle Course (SWOC) for discriminating between people with stroke and healthy older adults in condition 3 (walking with dark-glasses): (a) completion times of start-to-end (SE) (area under the curve (AUC) = 0.986); (b) completion times of end-to-start (ES) (AUC = 0.987); (c) step counts of SE (AUC = 0.984); (d) step counts of ES (AUC = 0.986).
Table VII. Values of area under the receiver operating characteristic curve, sensitivity and specificity for the optimal cut-offs of Standardized Walking Obstacle Course (SWOC) completion times and steps
This was the first study to investigate the reliability of the SWOC on people with stroke. Consistent with previous studies on older adults with arthritis (6) and on children with developmental disabilities (7), very satisfactory to excellent intra-rater, inter-rater and test-retest reliabilities (ICC = 0.856–0.993) were demonstrated. The use of standardized testing protocols, clear instructions and consistent measurements by well-trained raters may have contributed to the excellent reliabilities. The 2-min rest time between trials helped to avoid muscle fatigue and may have contributed to the excellent intra-rater reliability. The excellent test-retest stability illustrates that 7–10 days is a suitable interval to minimize practice effects while preventing changes of participants’ condition.
Unexpectedly, no significant difference was found between SWOC performances with and without dark-glasses (t = –1.868–0.168, p = 0.072–0.892, Z = –0.357 to –0.144, p =0.721–0.885). Previously, people with stroke were found to be reliant on vision in sensory organization test of dynamic posturography (18). Our insignificant results may have been due to the low shade rating of the glasses, and sufficient time participants had to adapt to the dimmer environment. A previous study on older adults showed that only a sudden light reduction caused a 15% decrease in gait speed and a 9% increase in cadence, with normal walking resumed after 90 s (19).
As expected, a significant difference was identified between SWOC results in normal walking and in walking with tray conditions (t = –10.269–7.281, p < 0.01). Walking with a tray is a motor dual task requiring a high level of divided attention, which is compromised in 44% of stroke survivors (20). Our results are consistent with study of Yang and colleagues (21), which found that community ambulating stroke survivors completed a tray carrying task with a 16.62% reduction in gait speed and a 3.87% increase in cadence.
People with stroke performed better when walking with dark-glasses than with a tray (t = 6.696–8.964, p < 0.01, Z = –4.624– –4.586, p < 0.01). As visual input is used for anticipatory postural adjustment during walking (22), reducing visual input should also hinder walking ability. However, participants saw the obstacles and turning angles during the practice trial, thus it seems reasonable that a lower level of anticipatory postural adjustment was required once they were familiarized with the SWOC test and the environment.
Significant differences (t = 2.320–2.314, p = 0.028–0.047) were found between SE and ES in SWOC completion times and step counts in the normal walking condition and in SWOC completion times in walking with dark-glasses condition, but not in other conditions. The SWOC involves turning 30° to the right, then 90° to the left, followed by 70° to the right in SE, and the reverse in ES. A previous study demonstrated that people with stroke turned significantly more quickly to the paretic side in TUG (23). As 72% of our participants had right-sided paresis, differences in SWOC completion times between SE and ES are expected. Insignificant differences between SE and ES in the walking with tray condition (t = 1.000–1.367, p = 0.183–0.326) and walking with dark-glasses condition (Z = –1.926, p = 0.054) may be attributed by the fact that the additional challenge of dual tasking and reduced visual input may have outweighed the effect of the turning direction.
Compared with the SWOC results of previous studies, people with stroke in this study were found to walk faster and with higher cadence (mean = 21.26–21.68 s and 30.28–30.73 steps) than children with mental retardation (MR) and Down syndrome (DS) (mean = 24.46–26.90 s and 27.26–29.06 steps) (24). This difference was expected as children with MR and DS have difficulties in learning complicated motor tasks. Compared with children with MR and DS, people with stroke experience not only a decline in balance and coordination but also spasticity and poor motor control. Thus, they generally walk with a shorter step length. In fact, a significant 16.9% increase in stride length was found in hemiplegic patients after receiving Botulinum toxin-A injection to reduce lower limb spasticity (25).
Two other studies explored the SWOC performance of children with developmental disability (DD) (6) and cerebral palsy (CP) (26). Both groups of children outperformed the participants with stroke in our study (children with DD: 14.02 s and 27.94 steps; children with CP: 12.7–19.7 s and 20.9–27.0 steps). Whereas more than half of our participants required walking aids, the children with DD had better physical mobility and walked without aids, which could account for the difference. The children with CP were likely to have had high levels of physical functioning, as they were all participants from a camping programme organized by a specialized hospital (26).
As expected, the healthy older adults outperformed those with stroke on the SWOC (p < 0.001). A previous study showed that people with stroke had impaired ambulatory function with reduced walking speed, decreased stride length, longer turning time and deficits in obstacle avoidance (3, 27). Gait alteration is caused by a disruption of the descending pathways following an upper motor neurone lesion, which creates various stroke-specific impairments, such as disturbed balance, impaired motor control and spasticity (28). Reductions in motor unit firing rates were also found in the paretic muscles of stroke survivors, resulting in muscle weakness (29).
The differences in SWOC completion times (approximately 10 s) and step counts (approximately 11) between people with stroke and healthy older adults markedly exceeded the calculated MDC (completion times: 2.37–3.89 s; step counts: 2.89–4.01), indicating that the between-group difference was probably due to a genuine difference, rather than measurement error.
The mean SWOC completion time of our healthy older adults was only a sixth of that of older adults in a previous study (mean 70.5 s) (30). Our healthy controls were all active older adults in the community and some of them were in the labour force. In contrast, the participants in Gunther’s study were frail, institutionalized and of older age (mean = 87.5 years) (30).
Contrary to our expectation, both SWOC completion times and step counts were not correlated with FMA-LE scores. The FMA-LE has been found to correlate with various locomotor performances or functional assessments in people with chronic stroke, including the Figure of Eight Walk Test (r = –0.717), gait speed (r = 0.607–0.613) and Functional Independence Measure mobility scores (r = 0.74) (31–33). The small sample size in this study may account for the insignificant results. In fact, the correlations were significant or near significant before applying the Bonferroni correction (correlation = –0.313–0.474, p = 0.09–0.099).
Insignificant correlations were found between the SWOC results and BBS scores and FTSTS times, which was surprising as the BBS and FTSTS both evaluate balance and are moderately correlated (r= –0.630, p < 0.001) (13). Our result is inconsistent with a previous study, which found a significant correlation between SWOC times and BBS scores in frail elderly participants (r = –0.819, p < 0.001) (30). Differences in mobility between our participants (mean SWOC time 21.26–23.80 s) and those in the previous study (mean SWOC time 70.5 s) may account for this inconsistency. In addition, the substantial differences in variability of SWOC performance in the previous study (coefficient of variation = 47.9/70.5 = 0.68) (30), compared with that of our study (coefficient of variation = ~5/21.5 = 0.23), may also account for the inconsistency. Considering that only a minimal change in the base of support is involved in the FTSTS and BBS tasks, insignificant correlations with the SWOC would be reasonable. With more than half of those with stroke scoring 50/56 or above, there was probably a significant ceiling effect.
Moderate to excellent positive correlations were shown between TUG times and both SWOC completion times and step counts, which is consistent with a previous study on children with developmental delay (7). Both the SWOC and the TUG consist of standing up from a chair and walking in a forward direction, which challenges participants’ balance and locomotor performance (14). The strong correlation was expected as the main difference between these 2 measures is that the SWOC further challenges the ability of participants to negotiate obstacles. Furthermore, TUG times were found to be correlated with gait speed (correlation = 0.84–0.92) (34), which could greatly affect SWOC completion times.
The insignificant correlation between the SWOC results and CIM scores was due to the discrepancy in the measurement domains. The CIM is a subjective measure of community integration, while the SWOC is an objective measure of obstacle negotiation. Furthermore, physical functioning alone is not sufficient to determine a change in stroke survivors’ level of social integration, as demonstrated in a previous study that showed that depression and stroke recovery were also required to predict such a change (R2 = 0.624, p < 0.001) (35). The SWOC, which is conducted in an indoor setting, may not reflect the ability of people with stroke to return to the community.
Completion times and step counts differentiated well between participant groups with an AUC of 0.975–0.992 for all conditions, meaning a 97.5–99.2% probability of correctly identifying the differences between people with stroke and healthy older adults. The SWOC is a sensitive tool to reflect stroke-specific impairment in a functional context.
Insignificant correlations between the SWOC and other outcome measures may have been due to the small sample size, as the sample size calculation was based on the reliability results of a previous study (7). Insufficient sample size may also result in indistinct, but statistically significant, SE and ES values. The SWOC is likely to predict falls in people with stroke, which was not investigated in our study.
The significant age and sex differences between people with stroke and healthy older adults may have affected the results as these factors are known to influence functional task performance (36). Apart from the above, there may have been selection bias, as people with stroke were recruited from the community and thus may have had better functional ability.
Real walking under 3 conditions was mimicked in our study. However, the effects of the sequence of obstacles and darkness of the dark-glasses have not been established. Learning effect may affect the result of study, as the order of 3 conditions in SWOC test remained unchanged. Participants might also become familiar with the walking course as a practice trial was given, yet obstacles are not always anticipated in real life.
Future studies with larger sample sizes that include people with stroke in different settings are needed to investigate both concurrent and predictive validity, and to provide better generalization of the results to all stroke survivors.
The SWOC is a safe and sensitive clinical test for evaluating obstacle negotiation in people with stroke. Good reliabilities had been demonstrated in all 3 conditions of the SWOC test. A strong correlation was found between TUG completion times and all conditions of the SWOC test. The SWOC test can differentiate obstacle negotiation ability between people with stroke and healthy older adults. The MDC of SWOC completion times and step counts could reflect changes in SWOC performance occurring over time, The SWOC test is thus highly recommended for evaluating obstacle negotiation in people with stroke.
The authors declare no conflicts of interest.


 Click to show fullsize
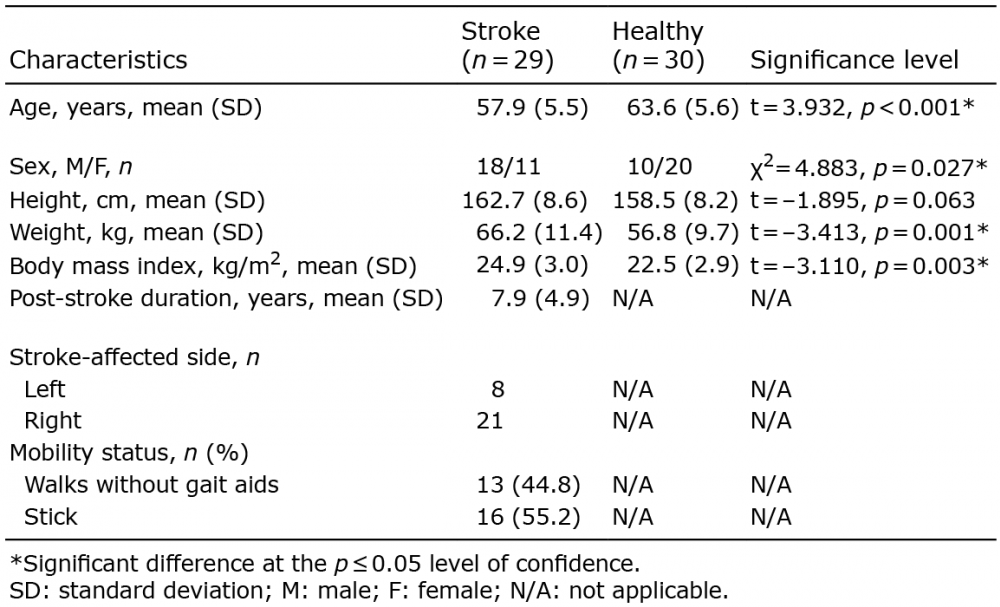 Click to show fullsize
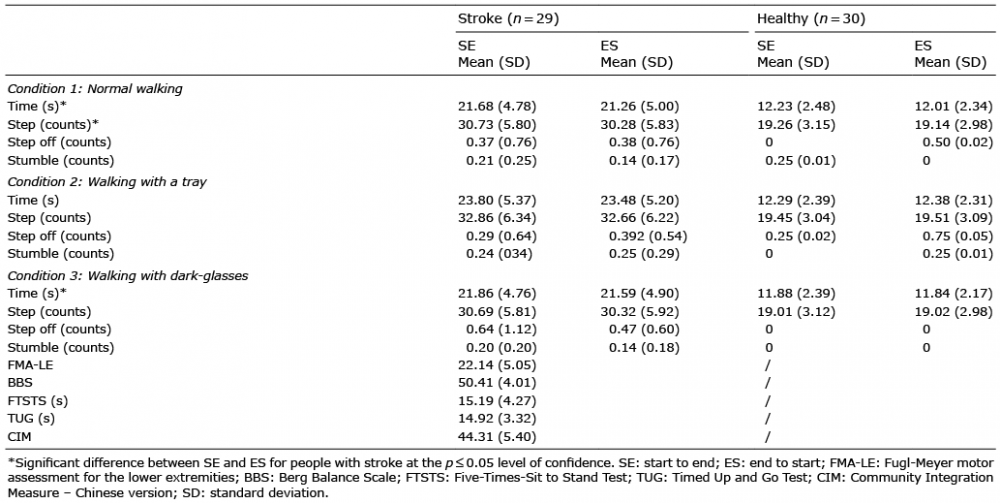 Click to show fullsize
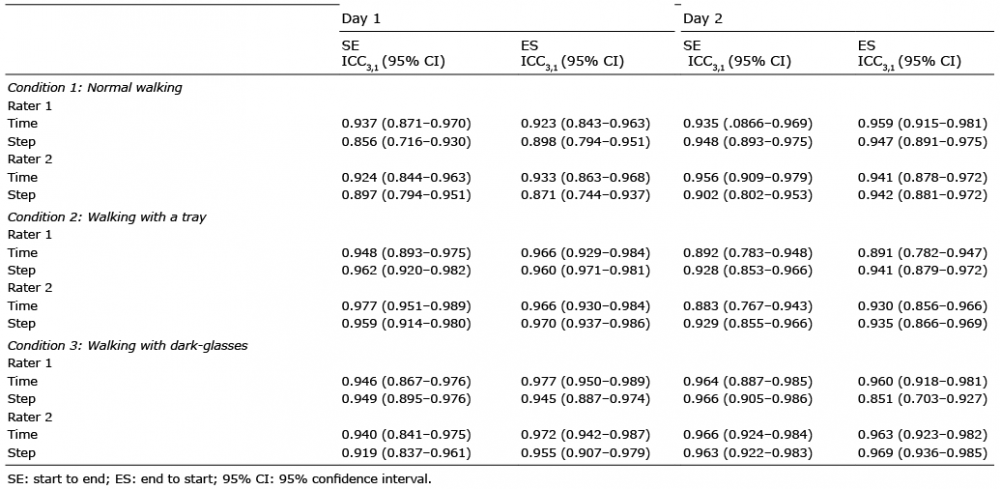 Click to show fullsize
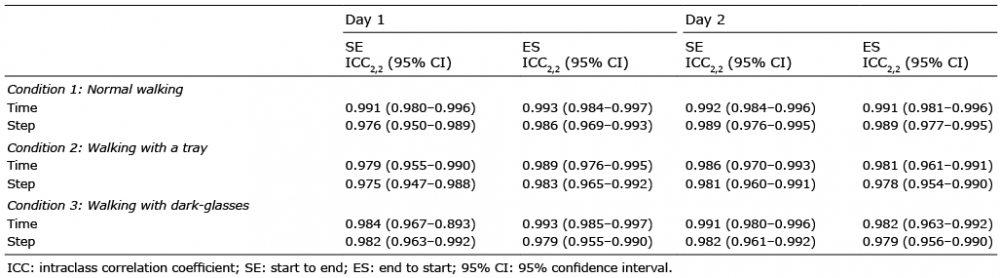 Click to show fullsize
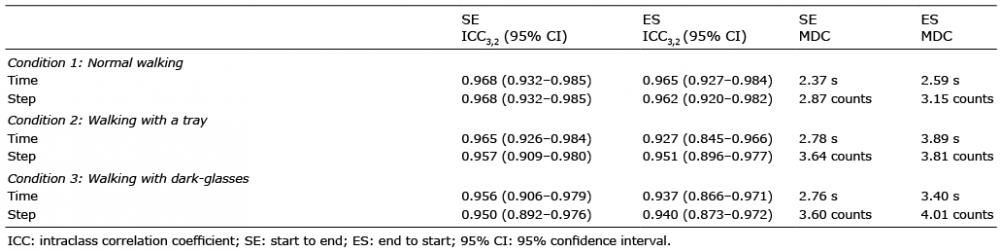 Click to show fullsize
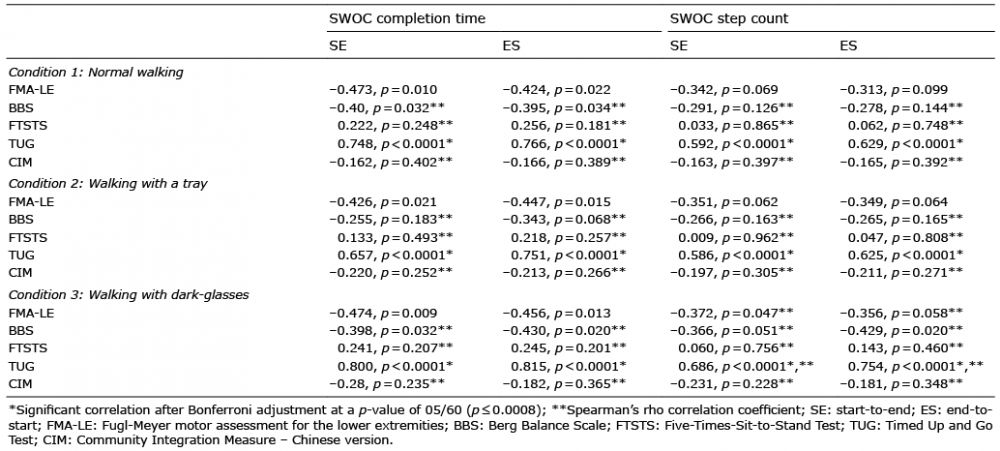 Click to show fullsize
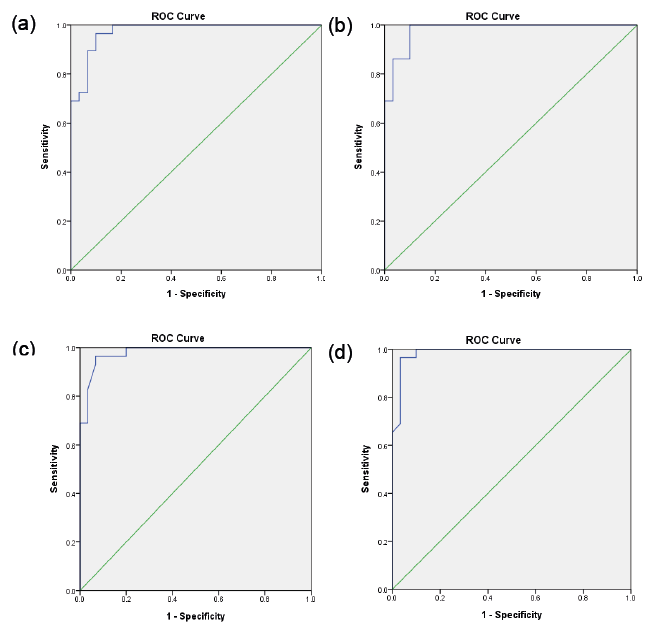 Click to show fullsize
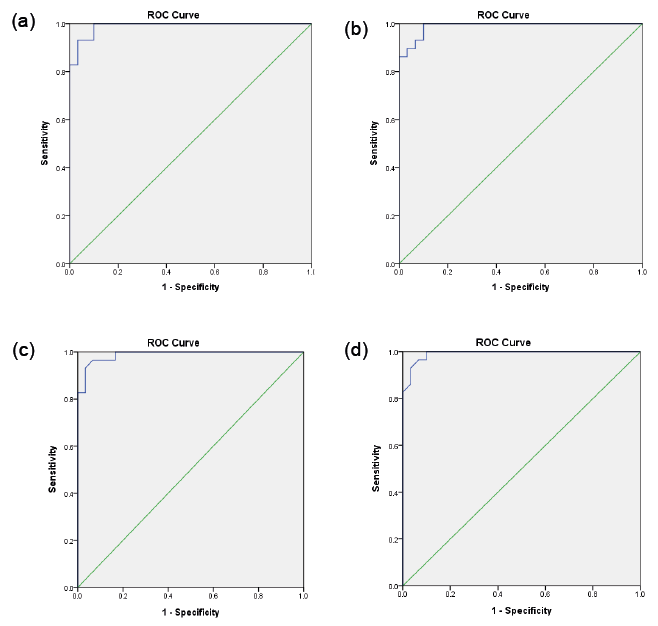 Click to show fullsize
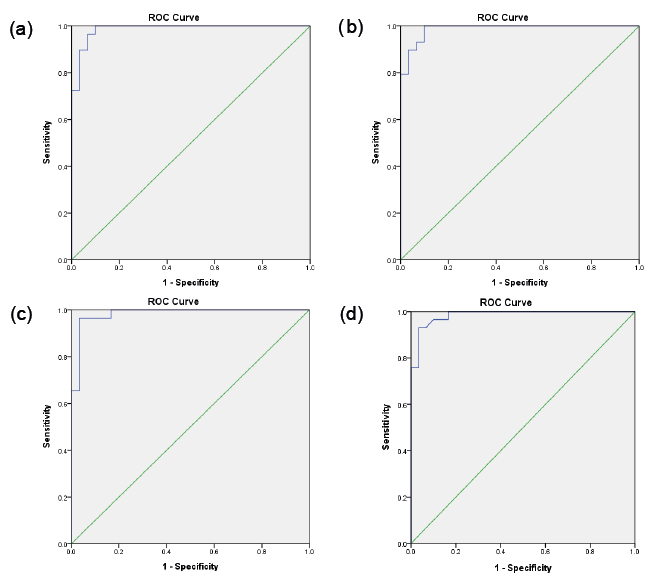 Click to show fullsize
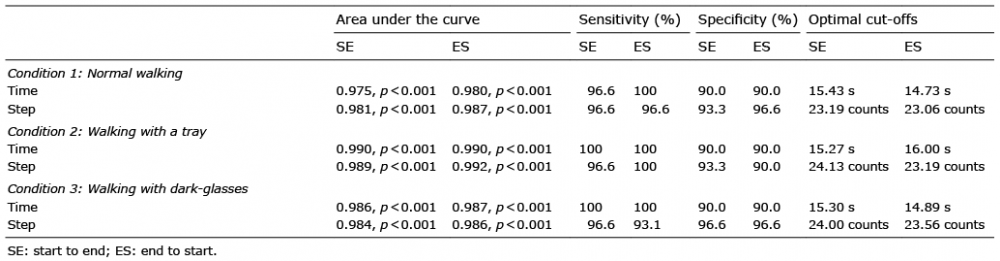 Click to show fullsize