
From the 1Department of Rehabilitation Sciences, 2School of Nursing, Faculty of Health and Social Sciences and 3Department of Biomedical Engineering, Faculty of Engineering, The Hong Kong Polytechnic University, Hung Hom, Hong Kong (SAR), China
Objectives: (i) To estimate the intra-rater, inter-rater and test-retest reliabilities of the Five-Step Test (FST), as well as the minimum detectable change in FST completion times in people with stroke. (ii) To estimate the convergent validity of the FST with other measures of stroke-specific impairments. (iii) To identify the best cut-off times for distinguishing FST performance in people with stroke from that of healthy older adults.
Design: A cross-sectional study.
Setting: University-based rehabilitation centre.
Participants: Forty-eight people with stroke and 39 healthy controls.
Interventions: None.
Main outcome measures: The FST, along with (for the stroke survivors only) scores on the Fugl-Meyer Lower Extremity Assessment (FMA-LE), the Berg Balance Scale (BBS), Limits of Stability (LOS) tests, and Activities-specific Balance Confidence (ABC) scale were tested.
Results: The FST showed excellent intra-rater (intra-class correlation coefficient; ICC = 0.866–0.905), inter-rater (ICC = 0.998), and test-retest (ICC = 0.838–0.842) reliabilities. A minimum detectable change of 9.16 s was found for the FST in people with stroke. The FST correlated significantly with the FMA-LE, BBS, and LOS results in the forward and sideways directions (r = –0.411 to –0.716, p < 0.004). The FST completion time of 13.35 s was shown to discriminate reliably between people with stroke and healthy older adults.
Conclusion: The FST is a reliable, easy-to-administer clinical test for assessing stroke survivors’ ability to negotiate steps and stairs.
Key words: stroke; step; stairs; rehabilitation; measurement; assessment; reliability.
Accepted Oct 5, 2017; Epub ahead of print, Nov 17, 2017
J Rehabil Med 2018; 50: 00–00
Correspondence address: Shamay S. M. Ng, Department of Rehabilitation Sciences, The Hong Kong Polytechnic University, Hung Hom, Kowloon, Hong Kong (SAR), China. E-mail: Shamay.Ng@polyu.edu.hk
N
egotiating steps and stairs is challenging and demanding for stroke survivors, but essential for community ambulation and functional independence (1). Inability to negotiate steps and stairs is common after stroke (1–3). Deficits in muscle strength, coordination and balance all contribute to reduced capacity for walking on level ground, as well as for negotiating steps or stairs (1–3). Compared with level-ground walking, biomechanical analyses have shown that greater joint ranges of motion and muscle moments in the lower extremities are generally required to ascend and descend stairs, with the knee extensors having a dominant role (4, 5). Such high physical demands explain why community-dwelling stroke survivors rate stair-walking among their most difficult tasks (6).
Approximately 10% of falls in older adults occur on stairs, with descending generally more hazardous than ascending (7). Among stroke survivors, decreased ankle dorsiflexion in the affected leg during the swing phase is common, probably due to ankle dorsi-flexor weakness and ankle plantar-flexor spasticity (8). Such reduced ankle dorsiflexion in stroke survivors could result in a trip if the toes fail to clear a step when ascending (9).
Stair negotiation is the single best predictor of free-living physical activity for community-dwelling people after a stroke (1). The ability to negotiate stairs alone can predict 48% of the variance in the time they spend on their feet daily, and 58% of the variance in their frequency of activity (activity count) (1). Thus, measuring the ability to get up and down stairs should be a crucial element in stroke rehabilitation.
Although it is important to assess the functional task of getting up and down stairs, stairs are not always available in a clinical testing environment. The ability to climb at least one step is required to manoeuvre over a kerb or threshold and to access public transportation or other public environments (10). The Five-Step Test (FST) has been developed to assess the ability to get up and down stairs (11).
The FST measures the length of time (in s) taken to step forward and up onto a 10-cm high step and then backward and down 5 times as quickly as possible (11). This test has demonstrated excellent test–retest reliability (r = 0.97, p ≤ 0.001) in testing with 30 older adults (11). However, there has been no study investigating the intra-rater, inter-rater, and test-retest reliabilities of the FST in people with stroke. In addition, no systemic study of the relationships among the FST and stroke-specific impairments has been published, nor has any published study compared the performance of FST between people with stroke and healthy older adults.
This study aimed: (i) to estimate intra-rater, inter-rater and test-re-test reliabilities, as well as the minimum detectable change (MDC) of FST completion times in people with stroke; (ii) to estimate the convergent validity of the FST by exploring any correlations between FST and other measures of impairments and activity limitations, including Fugl- Meyer Lower Extremity (FMA-LE), Berg Balance Scale (BBS), Limits of Stability (LOS) results and Activities-specific Balance Confidence (ABC) Scale; and (iii) to identify the best cut-off times for distinguishing FST performance in people with stroke from that of healthy older adults.
This was a cross-sectional study. A previous study has demonstrated excellent test–retest reliability (r = 0.97, p<0.001) of the FST for 30 older adults (11). Assuming that the intra-class correlation coefficients of the FST for people with stroke is 0.95, power analysis (using version 3.1.7 of G-power software package) showed that a sample of at least 34 people with stroke was required to achieve 80% power to detect an intra-class correlation coefficient (ICC) of 0.95 at a confidence level of 0.05 for reliability of the FST.
Participants with stroke were recruited via poster advertisements from a local self-help group for stroke survivors. Participants with stroke were included if they: (i) were aged over 55 years, as incidence of stroke approximately doubles each decade after this age (12); (ii) had experienced a single stroke at least 12 months previously; (iii) were in stable medical condition without other chronic disease based on their self-reporting during the screening assessment, such as heart disease or diabetes mellitus; (iv) could complete the FST independently; and (v) scored 7 or more on the Chinese version of the Abbreviated Mental Test (13), as a score of 7 or 8 out of 10 has been suggested as the cut-off between cognitive impairment and no impairment (14).
People with stroke were excluded if they had another neurological condition or comorbid disabilities, such as Parkinson’s disease or arthritis, which could obstruct proper assessment. A participant’s data was excluded from the analysis if the participant could only finish 1 trial instead of the 3 required, or if they fell or could not complete a trial independently without an assistive device.
Healthy controls aged over 55 years were recruited from a local community centre through poster advertising. Healthy controls were included if they were able to perform the FST independently and could understand verbal instructions. They were excluded if they had any condition that affected the assessment protocol, such as uncontrolled diabetes mellitus, or a neurological or musculoskeletal problem.
On the basis of the Declaration of Helsinki for human clinical testing, this study gained approval from the ethics committee of the The Hong Kong Polytechnic University. The testing was conducted in a university-based rehabilitation centre. Each participant was informed of the purpose and procedures of the study in advance and gave written, informed consent.
Each participant with stroke was assessed by 2 assessors (assessors A and B) in sessions on 2 days, 7–10 days apart, in order to minimize any learning effect. These 2 assessors were research assistants who were trained in stroke rehabilitation for 3 months. The assessors worked independently and were blinded to each other’s results.
For the stroke subjects, along with the FST, the Fugl-Meyer Assessment for Lower Extremity (FMA-LE), Berg Balance Scale (BBS), and Limits of Stability (LOS) assessments were conducted at each session, and the Activities-specific Balance Confidence (ABC) scale was completed. The healthy controls were only required to complete the FST in one session. At least one min rest was allowed between tests to minimize muscle fatigue. The sequence of assessment was randomized by drawing lots.
Five-Step Test. Based on the standardized protocol of the FST (11), the participant was required to stand in front of a 10-cm high wooden step, then step up and forward, and backward and down, 5 times as quickly as possible without losing balance. They could lead with either leg. Timing was begun as soon as the first step was initiated and stopped after both feet were on the floor again after the fifth step. To ensure safety, the assessors stood slightly behind, but not beside the subjects, so as to avoid influencing their performance. The assessment stopped if the participant needed help to maintain balance, generating an unsuccessful trial, which was not counted, but the participant was encouraged to try again. No walking aid was allowed in the period of assessment. Shorter FST completion times indicate better performance of FST. Each participant was required to perform 3 trials in each session with at least 1 min rest between trials to avoid possible fatigue. FST completion times of each assessor’s second and third trials were used for data analysis.
Fugl-Meyer Assessment for Lower Extremity. The FMA-LE was used to assess motor impairments of the lower extremities affecting reflexes, movement synergies and coordination (15). The FMA-LE consists of 17 items, each scored on a scale of 0–2, yielding a maximum score of 34. Higher scores indicate lesser motor impairment. The FMA-LE has excellent reliability (ICC = 0.83–0.95) in people with stroke (16).
Berg Balance Scale. The BBS was used with stroke survivors to assess balance performance during functional activities (17). The BBS consists of 14 items, with each item scored on a 0–4 scale, yielding a maximum score of 56. Higher scores indicate better balance performance. The BBS has excellent reliability (ICC = 0.98–0.99) in older adults (17).
Limits of Stability Test. The dynamic posturography (Balance Master, Neurocom International, Clackarnas, OR, USA) was used to assess postural stability by quantifying voluntary displacement of the centre of pressure (COP) in a designated direction without losing balance (18). The device has a pair of force platforms to locate the position of COP, and an eye-level screen to display a visual cursor corresponding to the participant’s COP when standing on the force platforms (18).
The participant, wearing a safety vest and overhead body harness, stood barefoot on the force platform facing the computer screen, displacing the position of their COP. At first, the participant was required to maintain the cursor in the centre of the computer screen, before each trial started. Upon hearing a sound signal, the participant shifted their body weight as far as possible in a direction indicated on the screen without changing their base of support (18). Four movement directions were assessed, including forward and backward, and to the affected and unaffected side. The maximum excursion (MXE) of the LOS was measured. MXE (% of the target distance) was defined as the maximum displacement of the COP for reaching each target position (18). Higher MXE values indicate higher limits of stability and better balance performance. The LOS test has good reliability (ICC = 0.84–0.88) for people with stroke (19).
Activities-specific Balance Confidence questionnaire. The Chinese version of the ABC questionnaire was used to evaluate each subject’s perception of their balance confidence in activities of daily living (20). The ABC questionnaire contains 16 items related to indoor and outdoor activities, with self-ratings from 0% (no confidence) to 100% (complete confidence) on each item. Higher scores indicate greater subjective balance confidence. It has shown moderate intra-rater reliability (ICC = 0.85) for Chinese older adults (20).
Statistical analysis was conducted with IBM SPSS Statistics 23 software packagea. Descriptive statistics were compiled summarizing the subjects’ demographic characteristics. Shapiro–Wilk tests were used to check the normality of all data collected. Homogeneity of variance was assessed with Levene’s test for the quality of variance. Non-parametric statistics were used with data that were not normally distributed.
Model 3 ICCs were computed to quantify the intra-rater (ICC3,1) and inter-rater (ICC3,2) reliabilities, with both the raters and the subjects treated as random effects. The degree of intra-rater reliability (ICC3,1) of the FST completion times for each assessor (A and B) was analysed between FST times of each assessor’s second and third trials, on Days 1 and 2, respectively. The inter-rater reliability (ICC3,2) was analysed between the mean FST completion times of the second and third trials between both assessors, on Days 1 and 2, respectively. The ICC model 2 quantified the test-retest reliability (ICC2,1), as both raters and subjects were considered as a random effect with a single rating (21). The test-retest reliability was analysed between the mean FST completion times of the second and third trials separately of each assessor, on Days 1 and 2, respectively.
The minimal detectable change (MDC) in FST completion times was calculated using the formula: MDC 95% = 1.96 × SEM × , where SEM is the standard error of measurement. The SEM was estimated as SEM = S × , where Sx is the standard deviation (SD) of the FST completion times and rxx is the test-retest reliability coefficient (21).
For convergent validity, correlations between FST and other outcome measures were quantified in terms of Spearman’s rho correlation coefficients (r). There were 6 primary outcome measures: the FMA-LE scores, BBS scores and MXE in the forward, backward and sideways directions, and the p-value for significant correlation was therefore 0.0083 (0.05/6) after the Bonferroni adjustment (22). ABC was considered as a secondary outcome. An r < 0.25 was categorized as little or no correlation. r = 0.25–0.50 was termed fair; moderate-to-good was r = 0.50–0.75; and good-to-excellent was r > 0.75 (21).
Two receiver operating characteristic (ROC) curves were generated, based on the results of the within-group and between-group comparisons (23). The Youden index was used to specify a cut-off value for the FST that best discriminates between healthy controls and people with stroke (22). The area under the ROC curve (AUC) provided a quantitative measure of the accuracy of using the FST to distinguish the performance of healthy controls from that of people with stroke on the basis of the null hypothesis of the AUC being 0.5 (23).
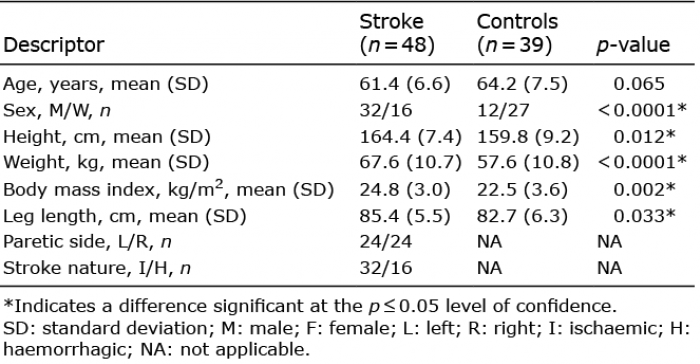
A total of 48 people with stroke (32 men, 16 women), mean age 61.4 years (standard deviation (SD) 6.6)), and 39 healthy controls (12 men, 27 women), mean age 64.2 (SD 7.5) years participated in this study. Demographic statistics for all subjects and the mean values of all of the outcome measures are presented in Tables I and II, respectively.
Table I. Demographics of people with stroke and healthy controls
Table II. Mean values of outcome measures for people with stroke and healthy controls
Excellent inter-rater reliability (ICC = 0.998), intra-rater reliability (ICC = 0.866–0.905) and test-retest reliability (ICC = 0.838–0.842) were found for the FST completion times of people with stroke (Table III). The MDC value of FST was 9.16 s. The optimum cut-off time of 13.35 s for the FST was found to best discriminate healthy controls from people with stroke. The AUC was 0.935, with sensitivity 93% and specificity 82% (Fig. 1).
Table III. Reliability of Five-Step Test (FST) in people with stroke
Fig. 1. Receiver operating characteristic (ROC) curve for the Five-Step Test (FST) area under the ROC curve (AUC) = 0.935; sensitivity, 93%; specificity, 82% (p < 0.001).
The correlation between the FST and other outcome measurements are shown in Table IV. Significant negative correlation was found between FST completion times and FMA-LE scores (r = –0.541, p < 0.0001), BBS scores (r = –0.716, p < 0.0001), and LOS-MXE in the forward, paretic and non-paretic sides directions (r = –0.411 to –0.513, p < 0.004). No significant correlation was found between FST completion times and LOS-MXE in the backward direction and ABC scores.
Table IV. Correlations of Five-Step Test (FST) with other outcome measures
This is the first study to estimate the intra-rater, inter-rater and test-retest reliabilities of the FST for people with chronic stroke. A MDC of 9.16 s was found for the FST in people with stroke. The FST correlated significantly with FMA-LE, BBS and LOS results in the forward and sideways direction. The FST completion time of 13.35 s was shown to discriminate reliably between people with stroke and healthy older adults.
Consistent with the results of a previous study of 30 older adults (r = 0.97, p ≤ 0.0001) (11), the FST completion times of the stroke survivors showed excellent reliability. The homogenous sample, the standardized assessment protocol, sufficient rest between trials to avoid fatigue, clear guidelines and well-trained assessors may all have contributed to the excellent reliability observed. The 7–10 day rest interval was apparently sufficient to minimize learning effects, giving good test-retest reliability.
The MDC of the FST calculated in the current study was 9.16 s, which represents the minimum change needed to reflect the real changes in completing the FST. Clinically, the MDC value could be used to determine any real change in ability to negotiate steps and stairs caused by intervention protocol. Taken together, our results demonstrated that FST is reliable using different assessors, and it could be recommended for assessing people with stroke in clinical practice.
No previous studies have evaluated the FST completion times of people with stroke. In this study, the FST completion times of people with stroke (21.3 s (SD 7.8)) were nearly twice those of healthy controls (10.8 s (SD 3.4)) (Table II). The FST involves stepping forward and up, then backward and down from a 10-cm step. People with stroke have difficulty walking up and down stairs (3), and take longer to ascend and descend stairs than their healthy peers (3). Stroke-specific impairments of the lower limbs commonly include spasticity, muscle weakness and impaired balance (24) caused by insufficient motor unit recruitment and reduced firing rate of muscle motor units (25), as well as poor voluntary activation (26). This could also explain the longer FST times of stroke survivors. Moreover, people with stroke tend to be more cautious when stepping up or down, to compensate for their poor balance performance. This would lengthen both the stance and swing times of one or both legs during stepping (27).
It is interesting to note that the mean FST time of the healthy older adults in this study (10.8 s (SD 3.4)) was much faster than that of older adults in a previous study (11) with a history of falls (29.2 s (SD 10.8)) and those without a history of falls (16.2 s (SD 6.1)). The mean age of our healthy controls was 64.2 years (SD 7.5) and most were still working. Participants studied by Murphy et al. (11) were much older (79.6 years (SD 6.5)) for the fallers; and 71.2 years (SD 7.3) for the non-fallers), and some of those participants were reported to have diabetes, hypertension, arthritis or cancer, which could have affected their motor performance. Functional mobility declines with age (28). These factors might explain the discrepancies in the FST times between these 2 studies.
An optimum cut-off time of 13.35 s was found to best discriminate healthy controls from those with stroke. The AUC was 0.94, with a sensitivity of 93% and specificity of 82% (Fig. 1). The high AUC of 93.5% reflects the fact that FST times could clearly distinguish the performance of healthy older adults from that of people with stroke. Based on the fall histories of 50 community-dwelling elderly persons, Murphy et al. (11) demonstrated that an FST completion time of 21 s could discriminate fallers from non-fallers with both sensitivity and specificity at 82%. Whether this cut-off time could be applied to people with chronic stroke warrants further study.
As expected, the FST completion times were negatively correlated with FMA-LE scores (r = –0.541 and p < 0.0001), as the FMA-LE is well accepted as a comprehensive quantitative measure of motor impairment for people with stroke (15, 16). During paretic leg stepping, coordination of joint movement and muscle contraction in the paretic lower limb is required to perform a smooth sequence of hip and knee extension. During non-paretic leg stepping the paretic leg is maintained in single-leg stance to maintain stability. No published study has previously investigated the relationship between FST times and FMA-LE scores, but some studies have yielded similar findings using other types of step tests, including step test (29) and alternate step test (2).
Consistent with the results of previous studies (2, 29), the FST completion times were negatively correlated with BBS scores (r = –0.716, p < 0.0001). The FST requires rapid shifting of the centre of gravity while stepping up and down 5 times. In addition, 3 items among the 14 test items of the BBS are components of the FST; unsupported single- and double-leg stance, and alternate stepping up (14). The inclusion of similar items tends to explain the significant correlation between FST completion times and BBS scores. Indeed, Murphy et al. (11) have demonstrated that FST significantly correlate with tandem stand, functional reach and penny picking-up tasks, all of which are similar to components of the BBS.
Significant negative correlations were found between FST completion times and LOS-MXE results in forward, paretic and non-paretic directions (r = –0.411 to –0.513, p < 0.004). In a complete FST stepping manoeuvre, each foot steps forward and upward, then backward and down. That process involves shifting the body’s centre of gravity in the anterior-posterior and medial-lateral directions as in the LOS test.
However, FST completion times were not significantly correlated with the MXE results in the backward direction. This was probably because the participant shifted his centre of gravity back to its original position only when stepping down, while the LOS testing emphasizes backward weight shifting. This could explain why a significant correlation was found with the forward and medial-lateral limits, but not in the backward measurements. It should be noted that adequate visual perception and sufficient attention is required for a participant to effectively track the cursor when shifting the COP in the LOS test. Whether visual perception and attention span affected the MXE results in this study needs further investigation.
It is somewhat surprising that the FST completion times did not correlate with the ABC scores, though they did with BBS results. Previous study has demonstrated that ABC scores significantly correlate with BBS scores (30). This discrepancy could be explained by the fact that the ABC measures subjective perception of balance efficacy, which is different from the objective physical domain measured by the FST conducted in a standardized environment. Indeed, lack of correlation between ABC scores and performance of functional tests including 12-step ascend and descend test (3), a timed alternate step test times (2) and a floor transfer test times (31) were reported with stroke survivors.
In this study, the quality of movement during FST was not taken into account. Moreover, performing the FST effectively involves coordination and systems, which were not assessed, including visual perception and attention span. In addition, the 10-cm high wooden step is not a standard step height, it may lack ecological validity.
As the primary objective of the current study was to estimate the reliability of the FST in people with stroke, the required sample size was estimated based on the desired reliability. The resulting sample size might not have been sufficient to identify significant correlations between FST and other outcome measures. Further investigations with larger samples would be helpful for establishing the utility of FST for stroke survivors with different mobility levels. As it stands, these results should be generalized only to stroke survivors fulfilling this study’s inclusion and exclusion criteria. In addition, participants with stroke in our study had shown satisfactory balance performance, which was reflected by their high mean BBS scores (52.8 (SD 2.6). Our results may not apply to participants with poorer balance who have difficulty performing FST.
The majority of the stroke subjects were men (66.7%), while the majority of the healthy controls were women (69.2%). Sex difference has been demonstrated in muscle strength (32), postural stability (33) and performance of functional tasks functional tasks (21), which may have influenced the results. In addition, significant differences in height, body weight and body mass index existed between 2 comparison groups. Further investigations with larger sample sizes and even distribution of demographic data would be essential for stabling the validity of FST completion time for assessing people with stroke of different mobility levels. Lastly, the study design was cross-sectional, therefore no causal relations among the variables can be inferred.
The FST is a reliable and easy-to-administer clinical tool for assessing ability to negotiate steps and stairs, with a MDC of 9.16 s for people with chronic stroke. A FST time of 13.35 s is able to differentiate between people with stroke and healthy older adults. FST correlates significantly with FMA-LE scores, BBS scores, MXE in the forward direction and towards paretic and non-paretic sides. Future studies with larger sample sizes will be essential for establishing the validity of FST to assess stroke survivors with different mobility levels.
This study was supported by the Departmental Research Grant of The Hong Kong Polytechnic University (1-ZVF9) to Dr. S.S.M. Ng.


 Click to show fullsize
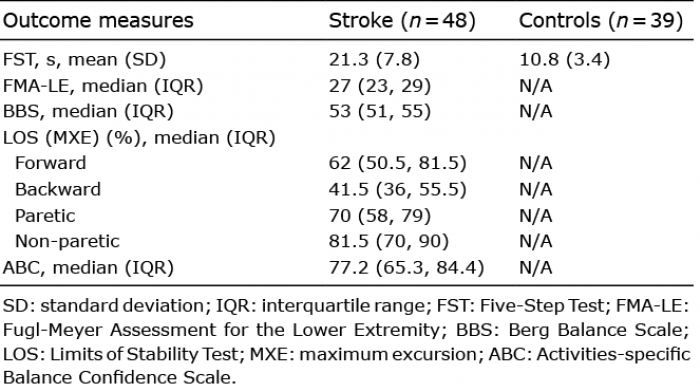 Click to show fullsize
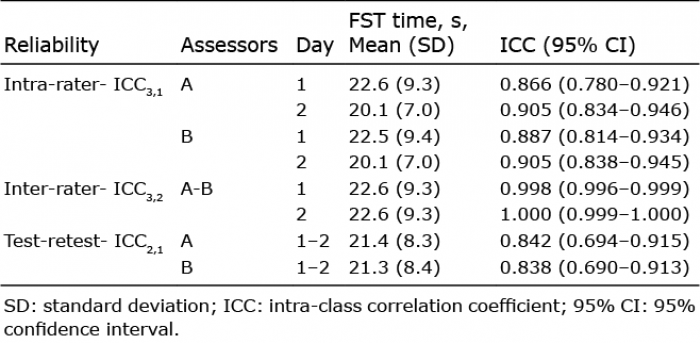 Click to show fullsize
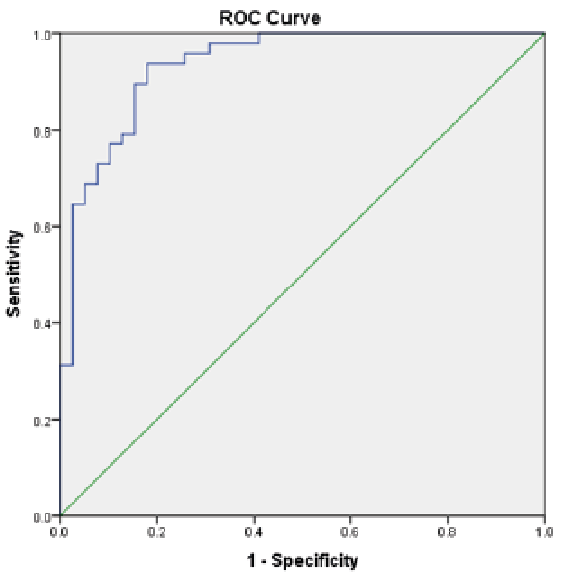 Click to show fullsize
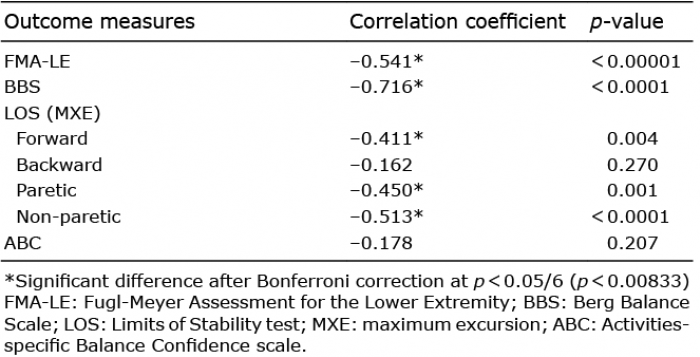 Click to show fullsize