
From the 1Amsterdam Rehabilitation Research Center | Reade, Amsterdam, 2Center for Human Movement Sciences, University of Groningen, University Medical Center Groningen, Groningen, The Netherlands, 3Peter Harrison Centre for Disability Sport, Loughborough University, Loughborough, UK, 4Orbis Sport Sports Medical Center, Sittard-Geleen, 5Adelante Rehabilitation Center, Hoensbroek, and 6Research and Development, Heliomare Rehabilitation Center, Wijk aan Zee, The Netherlands
Objective: To establish the relationship between internal and external handcycling training load for monitoring training in people with paraplegia.
Design: Observational study.
Subjects: Ten people with paraplegia.
Methods: All participants performed a graded peak exercise test. Power output and heart rate (HR) were measured and the session rating of perceived exertion (sRPE) was determined during a 12-week training period. Training Stress Score (TSS) was calculated from power output data, and TRaining IMPuls (TRIMP) was determined, based on HR, HRzones and sRPE. Partial correlations (for all training sessions of all participants) and Pearson’s correlations (for all training sessions of an individual participant) were performed to determine the relationship between external (TSS) and internal (TRIMPHR, TRIMPHRzones and TRIMPsRPE) training loads.
Results: Partial correlations between measures of internal and external loads (r = 0.81–0.85) and correlations between TRIMPsRPE and TRIMP scores based on HR (r = 0.77–0.78) were very large. At the individual level, Pearson’s correlations varied from moderate (r=0.48) to nearly perfect (r = 0.99).
Conclusion: TRIMPsRPE and TRIMPHR showed very large correlations with external training load, and thus appear appropriate for use in monitoring handcycling training load in people with paraplegia. How-ever, it is recommended that both measures are used in combination, when possible, since some individuals showed weaker relationships.
Key words: power output; ratings of perceived exertion; heart rate; exercise test; SCI; paraplegia.
Accepted Dec 1, 2017; Epub ahead of print Jan 31, 2018
J Rehabil Med 2018; 50: 00–00
Correspondence address: Sonja de Groot, Amsterdam Rehabilitation Research Center | Reade, PO Box 58271, NL-1040 HG Amsterdam, The Netherlands. E-mail: s.d.groot@reade.nl
Handcycling is physiologically more efficient than wheelchair propulsion (1) and leads to lower shoulder loads (2). Handcycling may be introduced during inpatient rehabilitation patients with a lower-extremity disability (3) for promoting mobility and physical activity. Recognizing the encouraging effect of events that are challenging, an annual handcycling race (HandbikeBattle) is held on a mountain in Austria. The event was created to promote handcycling among former patients of rehabilitation centres (4). The effectiveness of the event has been shown by substantial improvements in fitness and health outcomes (5). However, it is not known what kind of training regime led to these improvements. Participants in the HandbikeBattle trained for 4 months under free-living conditions (5). Monitoring of training is important in order to optimize performance and prevent overuse injuries or overtraining, especially in inexperienced handcyclists during and after rehabilitation. In addition, for research purposes more information is needed on the dose-response relationship to explain changes in fitness and health outcomes (6, 7). Firstly, it should be investigated which methods can be used to assess the training load in handcycling.
Two frequently used methods to determine internal training load are based on heart rate (HR) and ratings of perceived exertion (RPE) (8). Banister et al. (9) introduced the concept of training impulse (TRIMP), in which the duration of training and HR were used to calculate the training load. However, HR can be influenced by personal or environmental factors (10) and in people with a high spinal cord injury (SCI) by the impaired autonomic nervous system (11). Another method to monitor training load is TRIMPsRPE, in which the RPE of the training session (sRPE) is multiplied by the duration of the session (12). TRIMPsRPE is an easy to use and inexpensive method and might, therefore, be feasible to use during and after rehabilitation. However, TRIMPsRPE is a subjective measure and relies on an individual’s memory. Moreover, peripheral fatigue can play a more important role than central fatigue during arm exercise, making it more difficult to give an accurate RPE score that reflects the training load (13).
Although TRIMPHR and TRIMPsRPE have been validated and are promising in exercise modalities, such as kayaking and cycling in able-bodied individuals (14, 15), the validity of these measures in people with a disability has been investigated only in wheelchair rugby (16) and wheelchair basketball (17). The sRPE and HR-based methods showed large (r = 0.59, using partial correlations) and very large (r > 0.80) relationships with total distance covered during wheelchair rugby training sessions (16). A large correlation (mean r = 0.63–0.67) was found between the sRPE and HR-based methods during wheelchair basketball matches (17). Better relationships might be expected in handcycling, since, in contrast to court sports, handcycling is usually employed as an endurance activity, and the power output can be measured continuously during handcycling to obtain a very good (objective) indicator of the external training load.
The aim of this study was to determine the relationships between internal training load methods (TRIMP based on sRPE and HR) and external training load (based on power output) during handcycling training sessions in people with SCI, in order to elucidate which training load measure can be used to monitor handcycling training.
Every potential participant in the HandbikeBattle (n = 132 in 2015 and 2016) underwent medical screening (including an electrocardiogram and graded peak exercise test (GXT)) and a handcycling classification in the rehabilitation centre they competed for. Participants in the present study (a convenience sample of 10 men with SCI; Table I) were pre-selected by the team coordinators of the rehabilitation centres and participated in the HandbikeBattle 2015 or 2016. Pre-selection was based on: passing the medical screening, whether they were considered talented based on the outcomes (peak power output (POpeak) or oxygen uptake (VO2peak)) of the GXT, i.e. in relationship with their classification, their handcycling experience/training hours, or were very motivated to train, had a good understanding of the Dutch language and had their own handcycle. All participants voluntarily signed an informed consent before testing. The study was approved by the ethics committee of the Center of Human Movement Sciences of the University Medical Center Groningen.
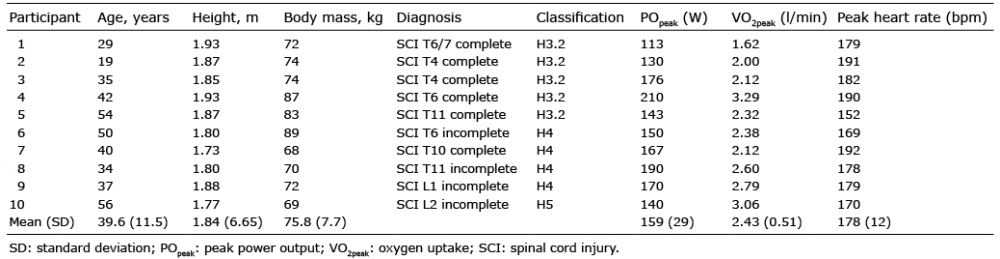
Table I. Characteristics of the participants included in the analysis
After being selected, all 10 participants performed a second standardized continuous GXT in rehabilitation centre Reade in Amsterdam, which made it possible to test them under the same conditions regarding equipment and protocol. After this second GXT, they started training with a bicycle computer and a heart rate monitor (Garmin Edge 500, Garmin, Olathe, KS, USA) in combination with a wheel-based power meter (Powertap, Saris Cycling Group, Madison, WI, USA, typical error (TE): 1.5%). An online log was used to record sRPE after each training session. During the GXT, all participants were familiarized with the Borg CR10 scale and the associated verbal anchors (8, 12). If participants were not completing the online log for days, they received an email to remind them to do this after each training. The participants trained, in mean, for a period of 12 weeks indoors and outdoors between March and June. The main part of the training was done individually or together with HandbikeBattle participants from the same rehabilitation centre. The majority of the participants had a trainer provided by the rehabilitation centre for training advice and training schedules. These training schedules were based on the outcomes of the first GXT. The trainers did not monitor the training, thus they did not influence the given RPE or other training parameters.
The continuous GXT was performed in the participant’s handcycle. The handcycle was attached to a Cyclus2 ergometer (Cyclus2, RBM elektronikautomation GmbH, Leipzig, Germany, TE: 2%) (Fig. 1). Breath-by-breath gas analysis was performed during the GXT (COSMED K4B2, Rome, Italy). The COSMED was calibrated before each test.
Fig. 1. Handcyclist performing a graded exercise test on his own handcycle attached to the Cyclus2, while oxygen uptake is measured continuously breath-by-breath by the Cosmed.
Participants started with a warm-up at a self-chosen power output and cadence. The protocol of the GXT consisted of 2-min rest followed by 3-min steps (18, 19) with increasing power output in 20 W steps until exhaustion. The starting power output was determined as the achieved POpeak during the previously performed GXT during the medical screening minus 120 W. If it was expected that the participant was not able to reach 120 W, based on their previous GXT, the power output was increased by 10 W every 3 min.
Blood lactate concentration was measured for the last 20 s of every step and at maximal effort via a drop of blood from the earlobe (Lactate Pro 1, Lactate Pro, Carlton, NSW, Australia). The RPE was recorded at the same time as the blood lactate concentration measurement using the 10-point Borg scale (8, 12). The 10-point Borg scale was chosen since it was also used during the training to calculate TRIMPsRPE. The RPE scale was explained to the participants before the GXT.
After the test, the second ventilatory threshold (VT) was determined. The second VT corresponded to the last point before a second non-linear increase in bothV̇E and VE/V̇O2, accompanied by a non-linear increase in V̇E/V̇CO2. To confirm this VT, it was determined whether the blood lactate concentration measurements reached > 4.0 mmol/l at this second VT, and whether the breathing frequency showed a steeper rise and the end tidal carbon dioxide pressure (∆PetCO2) a drop in trend line, at this time (20).
Besides the HR (Polar Heart rate sensor, Polar Electro Oy, Kempele, Finland) and power output at the VT, POpeak, HRpeak and V̇O2peak were determined after the GXT. The POpeak was determined as the highest power output maintained over 3 min plus 3 W (1.5 W for 10 W protocol) for every additional 30 s in the next step (21). V̇O2peak, peak respiratory exchange ratio (RERpeak), and HRpeak were defined as the highest mean value for 30 s or 5 s (HRpeak) during the GXT.
The training load was calculated in 4 different ways: a training stress score (TSS) from the power output data and TRIMP, based on mean heart rate (22), heart rate zones (23) and sRPE (12).
The TSS was calculated using Golden Cheetah software (version 3.3; www.goldencheetah.org). The training load is equal to 100 points, if you exercise at the “functional threshold power” (FTP) for 60 min. The power output at the second VT was used as power output at the FTP, since the study of Gavin et al. (24) showed that these power outputs are equivalent. The following equation was used:
TSS = (t ∙ NP ∙ IF)/(FTP/3600) ∙ 100 (1)
in which t is time in s, NP is the normalized power, IF is the intensity factor relative to the NP (i.e. IF=NP/FTP) of the training and FTP is the power output at the second VT.
The external training load was also expressed as total distance covered (in km) to be able to compare the results with previous literature.
The method of Banister (22) uses mean heart rate reserve (HRR) and duration of the training (t, in min) to determine TRIMP, following:
TRIMPHR = t ∙ HRR ∙ 0.64 ∙ e 1.92 HRR (2)
In which the HRR was calculated according to:
%HRR = HRtraining – HRrest)/(HRpeak – HRrest) × 100%
Where HRtraining is the mean HR during the training session, HRrest was the resting HR assessed once by the participant when lying in bed after waking up and the HRpeak is the peak HR determined during the GXT.
The third method of calculating training load (TRIMPHRzones) was based on different HR zones, as described by Edwards (23). Here, the HR is divided into 5 different zones, i.e. 50 to < 60, 60 to < 70, 70 to < 80, 80 to < 90 and 90–100% of the difference between HRrest and HRpeak. Each category received a weighting factor, respectively 1–5. TRIMPHRzones was determined as follows:
TRIMPHRzones = tzone1 ∙ 1 + tzone2 ∙ 2 + tzone3 ∙ 3 + tzone4 ∙ 4 + tzone5 ∙ 5 (3)
where t stands for the time (in min) spent in the corresponding zone.
Lastly, TRIMP determined using Foster’s method based on sRPE (12) was calculated via:
TRIMPsRPE = sRPE ∙ t (4)
in which t is the duration of the training session (in min), sRPE is the session overall rating of perceived exertion for the whole training session on a scale from 0 (rest) to 10 (maximal) (12).
The external (TSS) and internal training load (TRIMPHR, TRIMPHRzones, TRIMPsRPE) outcomes are all quantified in arbitrary units (AU).
Descriptives (mean and standard deviation (SD)) were calculated for all personal characteristics and for the outcomes of the GXT and training sessions. The assumption of normality was checked for the training load measures by visual inspection of the q-q plot. A Shapiro–Wilk test was performed on the data.
Partial correlation coefficients were calculated to determine the relationship among the internal and external training load methods for the whole group, as described previously by Bland & Altman (25). This method gives a correlation coefficient of paired data where there is more than 1 observation per participant. Confidence intervals (95% CI) for the partial correlations were calculated. Individual relationships among internal and external training load methods were examined with Pearson’s correlation coefficients and the 95% CI. The effect size of the correlations was determined according to Hopkins et al. (26): values were considered trivial (r = 0.0–0.1), small (r = 0.1–0.3), moderate (r = 0.3–0.5), large (r = 0.5–0.7), very large (r = 0.7–0.9) and nearly perfect (r = 0.9–1.0). A p<0.05 was considered statistically significant in all analyses.
The participants achieved mean V̇O2peak 2.4 l/min (SD 0.5) , POpeak 159 W (SD 29), HRpeak 178 bpm (SD 12), RERpeak 1.18 (SD 0.13), peak blood lactate concentration 10.6 mMol (SD 2.2) and a median Borg score of 9.5 (interquartile range of 8.75–10.0) (see Table I for the individual data).
The number of training sessions in which power output, HR and sRPE were collected varied among individuals, in the range 5–47. In total, there were 276 training sessions, with a mean cycling distance per session of 37.6 km (SD 18.7), a mean velocity of 22.1 km/h (SD 5.2), a mean power output of 85.1 W (SD 20.5), and a mean HR of 132 bpm (SD 20). Mean internal training load was 145 AU (SD 89) (TRIMPHR), 161 AU (10) (TRIMPHRzones) and 540 AU (SD 32) (TRIMPsRPE), while the external training load was 106 AU (SD 57) (TSS).
The partial and Pearson’s correlation coefficients between the internal and external training load measures are shown in Table II. The partial correlation coefficients for the whole group were very large, ranging from r = 0.81 (TSS vs TRIMPsRPE) to r = 0.85 (TSS vs TRIMPHR). The correlation between the internal training load measures and distance covered varied between large to very large (with TRIMPHRzones: r = 0.69; TRIMPsRPE: r = 0.71; TRIMPHR: r = 0.76).
Table II. Correlations among external (training stress score (TSS)) and internal (Training IMPuls (TRIMP) based on heart rate (HR) and session rating of perceived exertion (sRPE)) training load measures
For the individual (Pearson’s) correlation coefficients, the association between TSS and TRIMPsRPE was nearly perfect in 5 of the 10 participants, very large in 4 participants, and large in 1 participant. Similar results were seen for the correlation between TSS and TRIMPHR (nearly perfect: n = 7, very large: n = 1, large: n = 2). TRIMPHRzones showed the best associations with TSS (nearly perfect: n = 6, very large: n = 4). Fig. 2 shows some typical examples of large to perfect relationships between TSS and TRIMPsRPE or TRIMPHR.
Fig. 2. Individual relation-ships between external training load (training stress score) and internal training load for 2 participants (Training IMPuls (TRIMP) based on heart rate (HR) and session rating of perceived exertion (sRPE)). (A and C) TRIMPsRPE. (B and D) TRIMPHR. (A) and (B) show nearly perfect correlations, while (D) shows a very large correlation and (C) a large correlation.
The individual and group associations among internal training load measures are shown in Table III. A very large partial correlation coefficient was found between TRIMPsRPE and TRIMPHR (r = 0.77), while a nearly perfect correlation was found between the 2 TRIMP methods based on HR (r = 0.93).
Table III. Correlations among internal (Training IMPuls (TRIMP) based on heart rate (HR) and session rating of perceived exertion (sRPE)) training load measures
For the individual (Pearson’s) correlations, only 4 of the 10 handcyclists showed a nearly perfect relationship between TRIMPsRPE and TRIMPHR, while 4 others showed a very large association, and the other 2 a moderate to large relationship. The association between TRIMPsRPE and TRIMPHRzones was slightly better (nearly perfect: n = 4, very large: n = 5, large: n = 1). The 2 TRIMP outcomes based on HR showed a nearly perfect relationship in almost all handcyclists (r = 0.90–0.99), except for 1 person who showed a very large association (r = 0.87). Fig. 3 shows some typical examples of large to perfect relationships between TRIMPsRPE and TRIMPHR or TRIMPHRzones.
Fig. 3. Individual relation-ships between internal training load methods for 2 participants (Training IMPuls (TRIMP) based on heart rate (HR) and session rating of perceived exertion (sRPE)). (A and C) Association between TRIMPsRPE and TRIMPHR. (B and D) Association between TRIMPsRPE and TRIMPHRzones. While a nearly perfect correlation is shown in (B), (A) and (D) show large correlations, while (C) shows a moderate correlation.
In summary, the results showed very large associations between measures of external and internal training load, as well as among internal training load measures. These results indicate that, in general, TRIMP based on HR and sRPE could be used for monitoring handcycling training in people with paraplegia. However, since the strength of the individual correlations varied and the different measures do not always exactly measure the same factors (e.g. a decrease in TRIMPHR with an increase in TRIMPsRPE can indicate overreaching) (27), it is recommended that different training load measures are combined when possible.
Although our participants were all recreational handcyclists, most of them were selected by their rehabilitation centre for this project because they were considered talented or were eager to train. This might explain the higher mean V̇O2peak (2.4 l/min (SD 0.5)) and POpeak (159 ± 29 W) values in the present study compared with participants in the HandbikeBattle of 2013 and 2014 (mean 2.0 l/min (SD 0.5) and 122 W (SD 40); n = 51–59) (5) or participants of a 10 km handcycle race on a flat terrain (mean 2.1 l/min (SD 0.4) and 129 W (SD 26); n = 6 without upper-limb impairments) (28). However, V̇O2peak was similar, while POpeak was slightly lower compared with the results for 7 athletes with SCI who participated in a 22-km handcycling time trial (mean 2.4 l/min (SD 0.5); 178 W (SD 34)) (29). This indicates that the handcyclists in our study were relatively fit and that the current results cannot be generalized to all people with an SCI.
The relationship between internal and external training load measures found in the present handcycling study were very large (r = 0.82–0.83). These results were similar compared with a wheelchair rugby study, which found that the HR-based methods showed a very large correlation (r = 0.81–0.84) with the total distance covered during the training sessions within 14 wheelchair rugby athletes (n = 9 with SCI) (16). However, in our study, the relationship between external load measure and TRIMPsRPE (r = 0.80) was much stronger compared with the wheelchair rugby study (r = 0.59) (16). As suggested by Iturricastillo et al. (17), due to the intermittent character of court sports, involving many high-intensity sprints followed by lower intensity activities, it might be more difficult to give a good overall estimate of the sRPE compared with endurance activities, such as handcycling. A difference between our handcycling study and the wheelchair rugby study (16) are the different external training measures used (distance covered vs TSS). When our TRIMPsRPE is correlated with the distance covered during the training of our handcyclist, the correlation coefficient is also lower (r = 0.69). Power output, which is the product of force and velocity, is the best objective indicator of external training load, since it takes the velocity and resistance (i.e. force, due to for example wind, slopes, body mass) into account. Other studies also examined the relationship between internal and external training load using total distance or velocity as measures of external training load (6, 14, 30). Unfortunately, these studies did not determine the partial correlations, but showed similar individual correlations in kayaking (mean r = 0.62 (SD 0.18) for TRIMPsRPE and mean r = 0.82 (SD 0.10) for TRIMPHR) (14), but lower correlations in football referees (r = 0.38 for TRIMPsRPE and r = 0.22 for TRIMPHRzones) with total distance covered (30).
The partial correlations between the internal training load measures, i.e. TRIMPsRPE and TRIMPHR (r = 0.78) or TRIMPHRzones (r = 0.79), in our handcyclists were higher than the correlations found in wheelchair rugby players (r = 0.62 and r = 0.64, respectively) (16) or wheelchair basketball (r = 0.63–0.65) (17). However, similar Pearson’s correlations were found in cycling (r = 0.75 between TRIMPHR and TRIMPsRPE) (15), which, like handcycling, is also an endurance activity.
Although the partial correlations among training load measures were very large, the individual correlation coefficients varied from a nearly perfect (r = 0.99) to a moderate relationship (r = 0.48). These large variations between individuals were also found in wheelchair rugby (16) and kayaking (14). The lower correlations were found in our participants with a H3 classification, i.e. with more severe disability, but also within this group there was a large variation in the strength of correlations (see Table II). Participants 1 and 4 showed moderate correlations between TRIMPHR and TSS, i.e. they sometimes showed high TRIMPHR values without a corresponding increased TSS. This cannot be explained by a disturbed autonomic regulation of the heart, since HRpeak was high in all our participants. When the individual relationship between TRIMPsRPE and TRIMPHR is low, such as in participant 3 (r = 0.48), this can be an indication of overreaching (27), as stated previously. For example, cyclists in a 7-day stage race showed a decrease in TRIMPHR at the end of the race, while they reported increasing sRPE values.
HR and power output are objective measures in contrast to the sRPE. For example, participant 3 showed quite extreme sRPEs, either very low or very high, and showed a low correlation between sRPE and TSS. It is possible that he found it difficult to score his training load. Although scoring the sRPE was explained before the GXT, a more extensive learning protocol might be useful for some persons, such as participant 3 (31). In general, factors that can influence the validity of the sRPE method are experience and training status (32). Our participants, although they were not elite athletes, were more fit than the general population with SCI, which might have had a positive effect on the sRPE score. Furthermore, the intensity during the last part of the exercise can influence the validity of the sRPE method (33). To diminish the dominance of, for example, an end sprint, it is advised to score the sRPE at least 20–30 min after exercise (12). In the present study, we did not specifically tell participants when to score the sRPE, which might have led to an overestimation of this value.
Furthermore, the sRPE for peripheral fatigue might improve the validity of the sRPE for persons who have difficulty quantifying their training load, as was shown in wheelchair propulsion (13). However, another study found a high correlation (r = 0.91) between overall or respiratory sRPE and arm muscle sRPE in wheelchair basketball players, indicating that both measures can be used in elite athletes (17). It might be interesting to investigate, in a future study, the difference between using an overall sRPE or an sRPE based on peripheral fatigue in non-elite handcyclists.
A limitation of this study is the missing HR and sRPE data for several training sessions. That led to measurement of only 5 training sessions for 1 of the participants. Bates et al. (34) showed that the sample size, although it has an effect on the level of significance and the range of the 5th and 95th percentiles, does not affect the mean Pearson’s correlation coefficient, indicating that the effect of missing data on the strength of the correlation in our study is probably small. An easy to use app for completing the sRPE and training duration, with the option to set up (automatic) reminders and feedback might be useful in improving compliance.
The current study tested and monitored a convenience sample of 10 participants, which is a common sample size in this type of study in Paralympic sports (16, 17). Another limitation is that the current study only included people with paraplegia and, therefore, the results cannot be generalized to handcyclists with tetraplegia or other disabilities.
The partial correlations between internal and external training load measures were very large. However, it is important to keep in mind that the relationship is not nearly perfect, e.g. only 64% of the TRIMPsRPE explained the TSS, which means that the different measures do not study exactly the same concept, and a large variation in the strength of the individual correlations was found. Therefore, when monitoring individuals, it is recommended to use external (preferably TSS) and different internal training load measures (TRIMPsRPE and TRIMPHR) in combination, when possible. How-ever, the most important point is to monitor the handcycling training with at least one of the measures. If it is not possible to monitor the training via power output or HR due to a lack of equipment, the TRIMPsRPE may work well in most trained persons with SCI and might be improved with a learning protocol or a focus on peripheral fatigue, as described above. Therefore, this method is valuable during rehabilitation, especially as the relationship between stress and strain might be even more important in this setting than in (elite) sport (29). Using TRIMPsRPE with patients during SCI rehabilitation might be useful not only for therapists to monitor training and study the dose-response relationship for optimal (handcycling) training (7), but also to make patients aware of the thin line between stress and strain regarding upper-body exercise.
Future studies will examine the dose-response relationship in the participants of the HandbikeBattle to better explain changes in fitness and health outcomes (6, 7). The daily training load over a certain period can be summed to obtain, for example, a weekly or monthly training load (35). The relationship between the sum of the training load and the change in fitness and health parameters between our 2 GXT occasions can then be studied.
In general, TRIMPsRPE and TRIMPHR showed very large correlations with handcycling external training load and, therefore, appear to be appropriate for monitoring handcycling training load in trained people with paraplegia. However, it is recommended to use both internal and external measures when possible, since some individuals showed weaker correlations between measures of internal and external training load.
The authors would like to thank the professionals and teams at rehabilitation centres Adelante, Heliomare, de Hoogstraat, Reade, Rijndam, Roessingh, St Maartenskliniek, UMCG location Beatrixoord, Vogellanden, Blixembosch and Tolbrug for their help in the study. The assistance of Marco Korf, Chantal Grove and Linda van Vliet during part of the data collection and analysis is greatly appreciated. The authors also thank Fedor Hes of the Royal Dutch Cycling Union for use of their Garmins, Powertaps and online training log.
The authors have no conflicts of interest to declare.


 Click to show fullsize
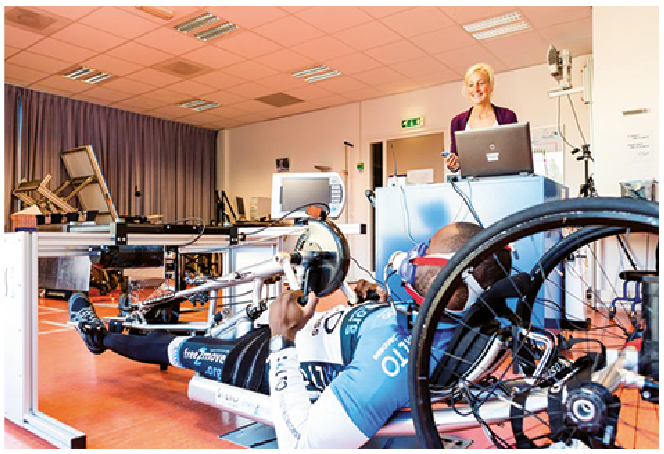 Click to show fullsize
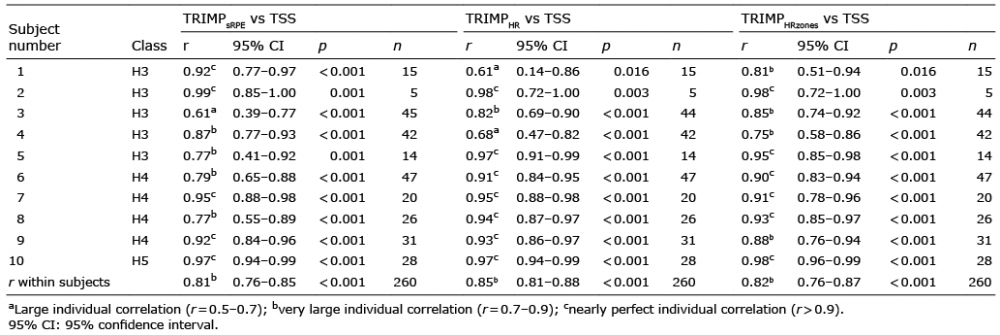 Click to show fullsize
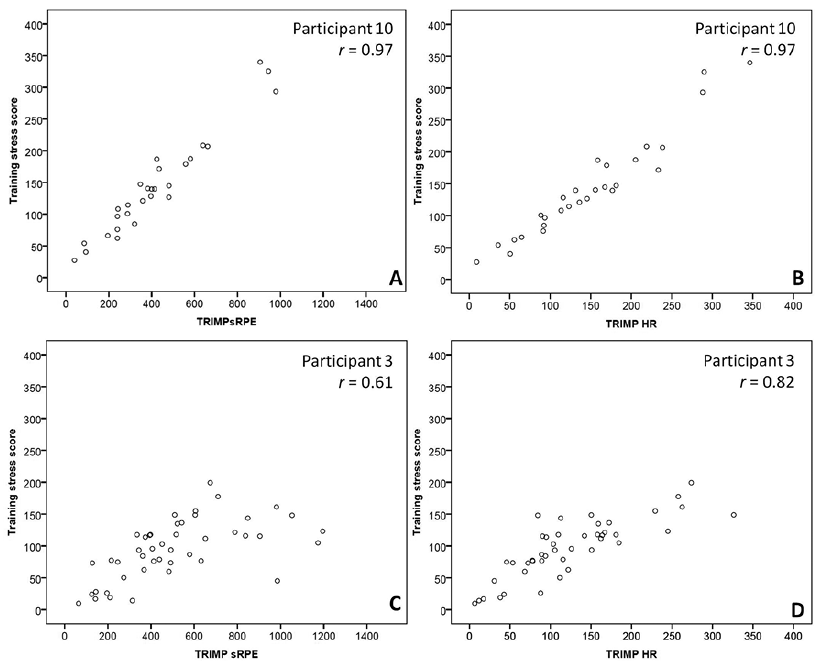 Click to show fullsize
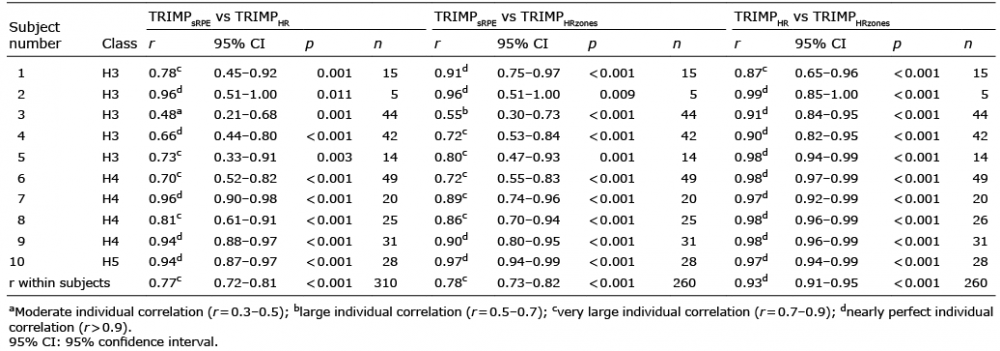 Click to show fullsize
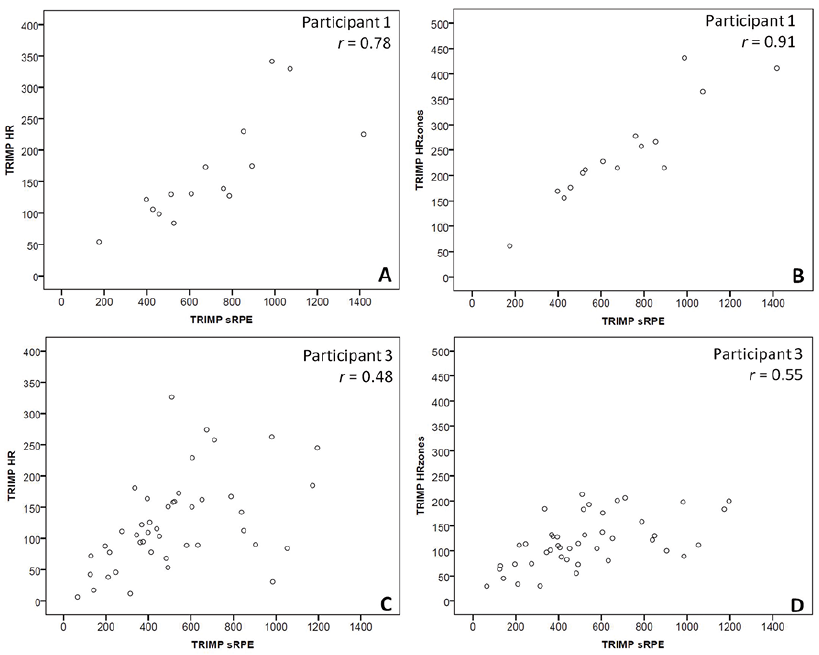 Click to show fullsize