
From the 1Auckland University of Technology, School of Public Health & Psychosocial Studies and School of Clinical Sciences, 2University of Auckland, School of Medicine, Centre for Medical and Health Sciences Education, New Zealand, 3Northwick Park Hospital, London North West Healthcare NHS Trust, and 4Department of Palliative Care Policy and Rehabilitation, School of Nursing Midwifery and Palliative Care, King’s College London, London, UK
Objective: To investigate the scaling properties of the Patient Categorisation Tool (PCAT) as an instrument to measure complexity of rehabilitation needs.
Design: Psychometric analysis in a multicentre cohort from the UK national clinical database.
Patients: A total of 8,222 patents admitted for specialist inpatient rehabilitation following acquired brain injury.
Methods: Dimensionality was explored using principal components analysis with Varimax rotation, followed by Rasch analysis on a random sample of n = 500.
Results: Principal components analysis identified 3 components explaining 50% of variance. The partial credit Rasch model was applied for the 17-item PCAT scale using a “super-items” methodology based on the principal components analysis results. Two out of 5 initially created super-items displayed signs of local dependency, which significantly affected the estimates. They were combined into a single super-item resulting in satisfactory model fit and unidimensionality. Differential item functioning (DIF) of 2 super-items was addressed by splitting between age groups (< 65 and ≥ 65 years) to produce the best model fit (χ2/df = 54.72, p = 0.235) and reliability (Person Separation Index (PSI) = 0.79). Ordinal-to-interval conversion tables were produced.
Conclusion: The PCAT has satisfied expectations of the unidimensional Rasch model in the current sample after minor modifications, and demonstrated acceptable reliability for individual assessment of rehabilitation complexity.
Key words: rehabilitation; brain injury; psychometrics; health services needs and demands; Rasch analysis.
Accepted Jan 24, 2018; Epub ahead of print Mar 27, 2018
J Rehabil Med 2018; 50: 00–00
Correspondence address: Richard Siegert, AUT University, North Shore Campus, 90 Akoranga Drive, Northcote, Auckland, New Zealand. E-mail: Richard.siegert@aut.ac.nz
Acquired brain injury (ABI) typically results in a diverse range of physical, cognitive, and psychosocial impairments, and patients may have widely differing needs for rehabilitation. In the UK, NHS England identifies 3 levels of inpatient rehabilitation service (1–3) and 4 categories of patient need (A–D) (1). The majority of patients have category C or D needs, which can be met by their local general (Level 3) rehabilitation services. Patients with more complex (category B) needs may require treatment in a local specialist (Level 2) rehabilitation unit; and a small number will have highly complex (category A) needs requiring the specialist skills and facilities of a tertiary (Level 1) rehabilitation service. The UK Rehabilitation Outcomes Collaborative (UKROC) Database provides the national clinical dataset for commissioning of specialist inpatient rehabilitation services and reporting of the dataset is now mandatory for all Level 1 and 2 rehabilitation services in England.
“Case complexity” in rehabilitation may have several meanings. At one level it may reflect the need for resources (in terms of staff inputs or cost) or it may reflect the wider aspects of the biopsychosocial model (2). Within the UKROC database the Rehabilitation Complexity Scale (3) is designed to record rehabilitation resource requirements and to identify the costs of rehabilitation. However, it does not give any indication of what the staff may be spending their time on. The Patient Categorisation Tool (PCAT) is a more wide-ranging tool for identifying patients with complex (category A and B) needs requiring rehabilitation in a Level 1 or 2 service. It may be used to generate a “complexity profile” for a given patient, describing their different types of requirements, and this information may, in turn, help direct them to the most appropriate service to meet their needs. It now forms part of the UKROC dataset (4). Originally produced as a checklist it was subsequently developed as an ordinal scale. In addition to identifying those individuals who are likely to require specialist rehabilitation, it is also used at a population level as a numerical measure to rate and compare the complexity of the clinical caseload across different services. This forms part of the national bench-marking process that signposts rehabilitation units for designation at different levels of specialization (5). It is therefore important to understand its scaling and measurement properties in the various different patient groups presenting for rehabilitation.
Initial evaluation using traditional psychometric techniques in a general, but mainly neurological, rehabilitation sample has shown the PCAT to have acceptable measurement properties with a single overall scale, subdivided into 2 main sub-scales, respectively, identifying “physical” and “cognitive/psychosocial” needs (6). A total PCAT score of ≥30 proved to be a reasonably sensitive and specific indicator of category A patients. However, there are residual concerns about summing ordinal data, especially across more than one domain.
Rasch analysis uses a probabilistic statistical model to evaluate the legitimacy of summing item scores to generate a single measurement. Proponents of the Rasch model argue that it provides a more rigorous assessment of scaling properties (7) than traditional methods, and it has been used to transform ordinal questionnaire scores to yield a genuine interval scale (8). The value of this approach has been demonstrated at the group level for such scales where scores are summed and compared across different subgroups (9–11). For example, in the context of rehabilitation, Rasch interval metrics have been used to transform total scores between different functional scales, such as the FIM™ Motor Scale and the Barthel Index, which may be valuable for meta-analysis and institutional benchmarking (12).
The Rasch model is based on the underpinning principle that performance on a scale is determined by just 2 parameters; the ability of the individual and the difficulty of the items. Rasch analysis examines the fit of the data to the predicted model. The logic of “item difficulty” and “individual ability” is immediately self-evident within the context of measurement of functional ability. However, it can also be translated to different constructs. The construct of measurement for the PCAT is “rehabilitation complexity”, so in this case the Rasch model would be represented by the rehabilitation needs of the individual (person) and the resource requirements to meet them (item).
The purpose of this study was to examine the scaling properties of the PCAT tool in a large multi-centre cohort of patients with complex rehabilitation needs following acquired brain injury. Rasch analysis was used to determine whether the PCAT can be used as a unidimensional measure of complexity of rehabilitation needs in this population and to produce a transformation table for converting ordinal to interval data.
The PCAT tool is designed to capture complex needs for rehabilitation in terms of the skills, time and facilities that may be found in a specialist rehabilitation setting. It comprises 18 items, each rated on a score of 1–3. When calculating the total score, the UKROC dataset takes only the higher of the scores for Medical and Neuropsychiatric inputs, and re-scores 1 item (Duration) on a scale of 0–2, to give a 17-item scale with a total score range of 16–50. The PCAT and some example scoring profiles are given in Appendix SI1.
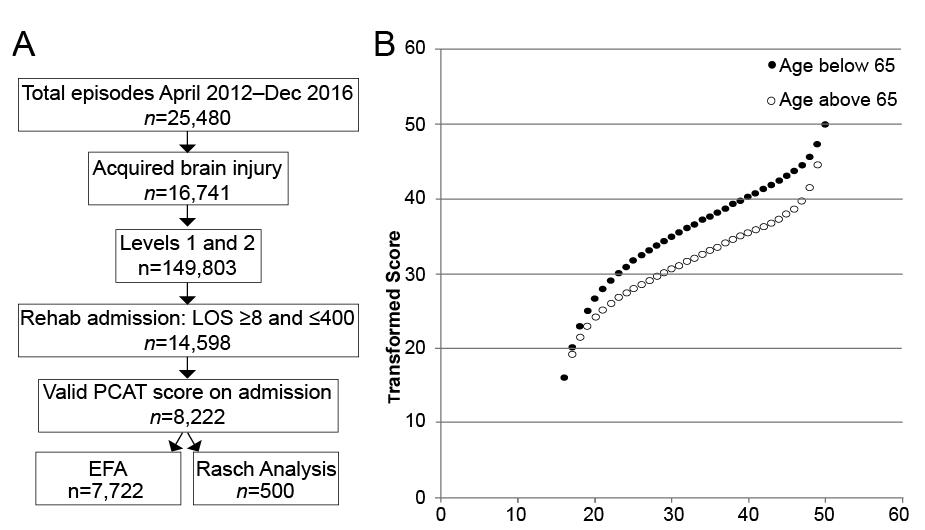
The PCAT was first introduced in 2012, but reporting was optional until 2015. Therefore complete data were not expected. The analysis was conducted on all episodes with a PCAT score recorded on admission in the UKROC database for patients admitted for rehabilitation in Level 1 and 2 services (n = 67) between April 2012 and December 2016. Episodes with length of stay 8–400 days were selected to exclude patients admitted for assessment only or for long-stay programmes of care. Fig. 1 summarizes the process of extraction and analysis.
Fig. 1. Data extraction process to derive the dataset used for analysis. (EFA: exploratory factor analysis). (A) Flow chart of extraction. (B) Scatterplot of ordinal vs transformed scores. LOS: length of stay: PCAT: Patient Categorisation Tool.
During this period, PCAT ratings were recorded for a total of 8,222 patients with acquired brain injury, comprising 56.3% of the total cohort. Within this dataset there were no missing item scores. A sub-sample of 500 episodes (sub-sample B) was randomly extracted for Rasch analysis, using the randomization facility in SPSS. Exploratory factor analysis was conducted on the remaining n = 7,722 episodes (sub-sample A).
The UKROC programme was registered as a multicentre service evaluation until July 2015 and is now commissioned directly by NHS England. Collection and reporting of the UKROC dataset is a commissioning requirement according to the NHSE service specification for Level 1 and 2 Rehabilitation Services. According to the UK Health Research Authority, the publication of research findings from de-identified data gathered in the course of routine clinical practice does not require research ethics permission.
Descriptive analysis was carried out using IBM SPSS v.23 software. Exploratory factor analysis was conducted to explore dimensionality. This was followed by Rasch analysis using RUMM2030 software (30) to test dimensionality. A significance value of 0.05 was used throughout.
For the exploratory factor analysis we applied principal components analysis (PCA) with Varimax rotation as these typically provide clear, interpretable solutions and have been used in our previous evaluations of the UKROC measurement tools (3, 13–15). The Kaiser Myer Olkin test and Bartlett’s Test of Sphericity were used to make sure that the correlation matrix was suitable for factor analysis. The decision on the number of factors to rotate was based upon consideration of: (i) the number of factors with eigenvalues >1, (ii) visual inspection of the scree plot, and (iii) parallel analysis (16). Eigenvalues are numbers representing how much variance an individual component explains. (17) In the Scree test these are plotted against their components in descending order to help determine the fewest number of components explaining most of the variance (18). Parallel analysis involves determining the number of factors to rotate by comparing the size of the eigenvalues obtained with those from a Monte Carlo simulation (19). Internal consistency was examined using Cronbach’s alpha.
An extensive literature provides guidance on methodology for Rasch analysis (8, 9, 20–22). Lundgren-Nilsson & Tennant 2011 (11) reviewed approaches to Rasch in the context of rehabilitation and made the following recommendations to improve the rigor of future analyses:
We followed all the above steps to deal with each of these issues, when they arose. The sample size of 500, representing approximately 30 cases per item, was chosen to ensure at least 100 cases in each of the diagnostic sub-groups (trauma, stroke and other). We used the likelihood ratio test, to determine whether the Rating Scale or partial credit model for Rasch analysis was most appropriate. The summary statistics of the Rasch model were assessed based on the mean item and person location, individual item fit residual, the overall item-trait interaction χ2 test/p-value and the Person Separation Index (PSI), interpreted as follows:
We tested for item bias across important person factors, such as age group (< 44, 45–64, 65 years plus), sex, and diagnostic category (i.e. trauma or stroke). Items displaying DIF were “split” to allow variation by the corresponding factor. This DIF split effectively completes a separate Rasch analysis for each person variable, where DIF is evident by splitting the sample accordingly (e.g. males and females separately). As it was desirable to keep the original structure of the PCAT scale, item removal would only be considered as a last resort to improve the fit. The items at risk of deletion were those exhibiting significant misfit, i.e. excessive residual values (> ± 2.5) and a p-value significant at the 0.05 level, with a Bonferroni adjustment for multiple tests (24). Unidimensionality was tested using Rasch PCA of the residuals and the equating t-test. The PCA of the residuals examines for evidence of multidimensionality after removal of the “Rasch factor”. The equating t-test creates 2 subtests from the first principal component and tests for any significant difference in person estimates between these subtests. Unidimensionality of the scale is confirmed if significant t-test comparisons do not exceed 5% or if the lower bound of a binominal confidence interval computed for the number of significant t-tests overlaps the 5% cut-off point (25). Finally, we followed the 10 quality indicators for evaluating the quality of reporting Rasch studies developed by the Rasch Special Interest Group of Outcome Measures in Rheumatology (OMERACT 11) (26).
The demographics of all 3 samples are shown in Table I. No significant differences were found between the 2 sub-samples.
Table I. Demographics of the total sample and randomized subsamples
Within this sample, 4,553 (55%) of patients were assessed as having category A needs, 3,367 (41%) as category B and just 295 (3.6%) as category C or D needs. The median total PCAT score for patients with category A needs was 35 (IQR 31–39); for category B needs 28 (25–30) and for category C/D 22 (19–25) (Fig. 2). Significant differences were seen between all groups (Mann–Whitney p < 0.001). When total PCAT scores were analysed within the clinically-assessed categories of need, a total PCAT score ≥ 30 identified patients with category A needs with 84% sensitivity and 74% specificity.
Fig. 2. Box plots of raw total scores between clinically-assessed category of need illustrate clear distinction between different clinical categories of rehabilitation need.
The results of exploratory factor analysis (sub-sample A) are summarized in Table II. Corrected item total correlations for the full scale were all significant at p < 0.001 and ranged from 0.17 to 0.62 and Cronbach’s alpha was 0.86 for the total scale. Principal components analysis showed that all but 2 items loaded strongly onto the first principal component with loadings ≥ 0.40, the exceptions being tracheostomy (0.35), and vocational rehabilitation (0.20). These initial analyses were indicative for unidimensionality of the PCAT.
Table II. Results of principal component analysis
Three components had eigenvalues >1, together explaining 50% of variance. Parallel analysis also indicated 3 factors (see Appendix SII1). Varimax rotation revealed 3 factors, but with considerable overlap, which is not unexpected given the evidence for unidimensionality described above (Table II). Given the number of cross-loadings, the extracted components are difficult to interpret meaningfully as separate subscales, but this preliminary investigation outlined item groups that share common variance, which is useful to consider in subsequent Rasch analysis (23) (see below).
The likelihood-ratio test indicated the suitability of the Partial Credit Model χ2 (16) = 875.73, p < 0.001). Table III presents the overall Rasch fit statistics for the sequential analysis of the PCAT and Table IV presents the initial analysis fit statistics for each individual item, along with the frequency distribution of responses for each of the 3 scoring categories within the 17 items. The initial analysis indicated the overall poor fit to the model marked by significant item-trait interaction and multidimensionality that violated the Rasch model assumptions, but separation reliability was satisfactory (PSI = 0.85). Two items (staff emotional and vocational rehabilitation) displayed significant misfit to the model with fit residuals outside of the acceptable range (± 2.5) (Table IV). There were no significantly disordered thresholds.
Table III. Patient Categorisation Tool (PCAT): Rasch model summary statistics (overall model fit of the scale)
Table IV. Rasch model fit statistics and frequency of responses for the 17-item Patient Categorisation Tool (PCAT) (Analysis 1)
Individual item fit may be affected by local response dependency between items (27). Therefore the item residuals correlation matrix was analysed to identify any influences on responding other than the primary latent trait of interest. The local response dependency identified was between item groups that generally reflected the components identified previously by PCA. Local dependency was addressed using the existing methodology (23, 28) by combining items to accommodate both residual correlations and the PCA findings. Five groups of locally dependent super-items were identified based on a residual correlation matrix that mapped closely to 4 components identified using PCA. Super-items were identified as follows:
Combining the items into 5 super-items improved the overall model fit, but the item-trait interaction χ2 was still significant and only marginal evidence of unidimensionality was obtained (Table III, Analysis 2). At the individual item level, super-item 5 displayed significant model misfit with a fit residual of 3.20 and local response dependency with super-item 1. Satisfactory model fit was achieved by merging super-items 1 and 5, resulting in the 4 subtests solution (Table III, Analysis 3).
DIF analysis ANOVA indicated significant uniform DIF by age for super-items 1 (F (2, 497)=6.35, p = 0.001) and 2 (F (2, 497)=6.62, p = 0.001), suggesting that these super-items function differently for adults aged 65 years and older compared with the younger patients with the same level of complexity. Therefore, these were split by age for DIF, resulting in the best overall model fit (Table III, Analysis 4). At this final stage there were no mis-fitting or locally dependent items and item-trait interaction was not significant. Fig. 3 shows the person-item threshold distribution for the final solution indicating very good targeting of the sample by the item thresholds.
Fig. 3. Person-item threshold distribution of the Patient Categorisation Tool final solution (n=500). The person-item threshold distribution for the final solution indicates very good targeting of the sample (persons mean=–0.22) by the item thresholds with no signs of significant flow or ceiling effects.
Satisfactory fit of the scale to the Rasch model and good coverage of the sample permitted generation of the ordinal-to-interval conversion tables that account for DIF by age. Both ordinal and interval conversion scores are presented in Appendix I using the original PCAT score range and do not require altering of the scale response format. Using these conversions require a complete set of responses to each of the 17 PCAT items for each patient.
Appendix I. Ordinal-to-interval Rasch conversion for the modified 18-item Patient Categorisation Tool (PCAT)
This study examined the scaling properties of the PCAT tool in patients with complex rehabilitation needs following acquired brain injury. We used a combination of classical test theory (CTT) and Rasch modelling in the psychometric analysis of a large UK multicentre dataset. Exploratory factor analysis using PCA suggested that the PCAT might reasonably be summed into a single total score reflected in the strong first principal component, but also comprised 3 main factors. In the Rasch analysis, once local response dependency issues were addressed by combining items into 4 testlets or super-items, the model provided good fit for a reliable unidimensional scale, permitted generation of ordinal-to-interval conversion tables that account for DIF by age and increase the accuracy of assessment based on a score range of 16–50.
Measurement models may include either a “reflective” model (where the indicators of a construct are considered to be caused by the construct) or a “formative” model, where the measured variables are considered to be the cause of the construct. The PCAT was derived from a checklist pre-determined by the Department of Health in England to identify patients requiring Level 1 (tertiary) rehabilitation services. Broadly, these are split into “Level 1a” services for profound physical disability, “Level 1c” services for (mainly ambulant) patients with complex cognitive and behavioural needs and Level 1b (mixed) services. The PCAT was designed to capture a diverse range of complex needs across this spectrum. It essentially follows a formative model in which not all items are expected to be correlated, but are individual factors that may contribute to the overall complexity of the patient. Some variables are likely to go together in relatively discrete groupings (for example the requirement for psychiatric input in patients with complex behavioural and psychological needs). Others may run across the component subscales (for example, family support was needed regardless of whether the patient’s need were predominantly physical, communicative or cognitive.) Other variables may stand alone; for example, although need for vocational rehabilitation is a valid requirement for intervention from specialist rehabilitation, it stands somewhat alone from items reflecting either profound physical or cognitive dependency. For this reason we did not expect an excellent fit to the Rasch model, although we expected that items may broadly separate into physical and cognitive/behavioural subscales, as indeed they did.
Although the groupings were made on a purely statistical basis, they resonated with clinical practice. For example, whilst one might not intuitively connect complex discharge planning with tracheostomy or swallowing/nutrition problems, the requirement for a tracheostomy or percutaneous endoscopic gastrostomy naturally go with complex disability and patients with all 3 of these issues will inevitably place more burden on discharge planning arrangements. Future clinical developments of the PCAT may therefore include use of the items or super-items in some sort of decision tree to sign-post referral to the most appropriate service for a given individual, weighting of items or the development of a costing algorithm. However, for this study we wished to explore its properties as an interval measure to support future comparison of caseload complexity between different populations and services.
Whilst the PCAT was developed in the UK for identifying patients with complex needs requiring a certain level or type of service, the findings presented here suggest that its measurement properties are consistent with an interval level scale that could perform across a much more graded spectrum of needs. This means that it has potential for application in other countries or health systems with different service structure and design.
One previous study has examined the psychometric properties of the PCAT using CTT techniques in a general neurorehabilitation population (6), but this is the first study to explore its scaling properties using Rasch analysis. The earlier study also provided support for summation of the PCAT items into a single unidimensional scale, although a 2-factor model comprising a “Physical” and “Cognitive/psychosocial” subscale provided the best fit and this is consistent with the clinical diversity described above.
This study has a number of strengths and weaknesses.
The data presented here suggest that the PCAT may reasonably be summed into a single total score, and a transformation table for interval scores has been prepared. However, inspection of the interquartile ranges of untransformed scores within the clinically assessed categories of needs suggested that raw PCAT scores ≥ 30 may provide a reasonable indication of Category A needs, 25–29 Category B and 19–24 category C. The added value of transformed scores as a discriminator of category of need (especially in brain-injured patients requiring cognitive behavioural rehabilitation) therefore requires further investigation in future studies.
The authors gratefully acknowledge the hard work of the clinical teams in the 67 centres, and of the patients and their families who participated in the follow-up survey. Special thanks are due to the UKROC programme steering group and co-applicants, and in particular to Heather Williams, Keith Sephton and Alan Bill who maintain the UKROC database and check the data on a daily basis.
Competing interests: There are no significant competing interests. Lynne Turner-Stokes is Director of UKROC and was the lead developer of the PCAT tool, but neither she nor her employing institution has any financial interest in the tools, which are disseminated free of charge (http://www.kcl.ac.uk/lsm/research/divisions/cicelysaunders/research/studies/uk-roc/tools.aspx). None of the authors has any personal financial interests in the work undertaken or the findings reported. All authors are employed by London North-West Healthcare NHS Trust, King’s College London, Auckland University of Technology, or the University of Auckland, any of which may cite this article as part of their research evaluation processes. Lynne Turner-Stokes has received financial support from the NIHR to attend conferences to disseminate the findings from the UK programme. We do not consider that any of these relationships or activities has influenced the submitted work.
Funding statement: This article presents independent research funded by the National Institute for Health Research (NIHR) under its Programme Grants for Applied Research programme (RP-PG-0407-10185). The views expressed in this article are those of the authors and not necessarily those of the NHS, the NIHR or the Department of Health. Financial support for the preparation of this manuscript was also provided by the Dunhill Medical Trust.


 Click to show fullsize
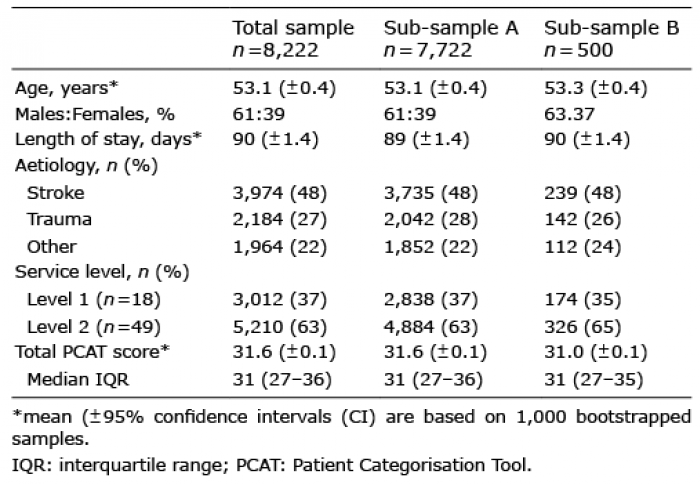 Click to show fullsize
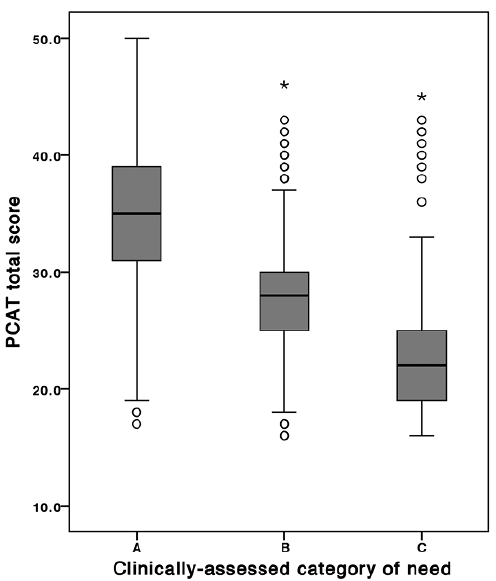 Click to show fullsize
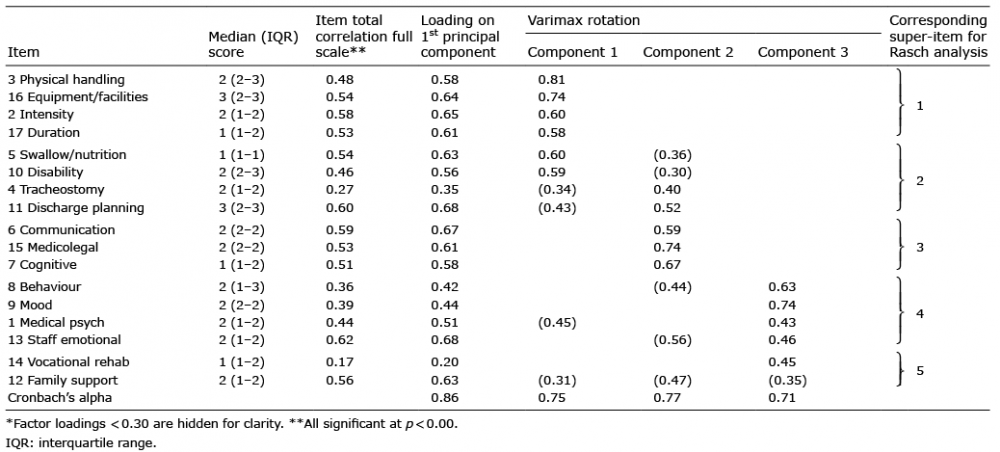 Click to show fullsize
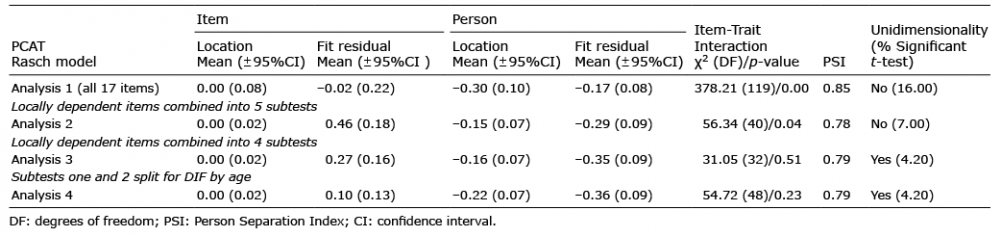 Click to show fullsize
 Click to show fullsize
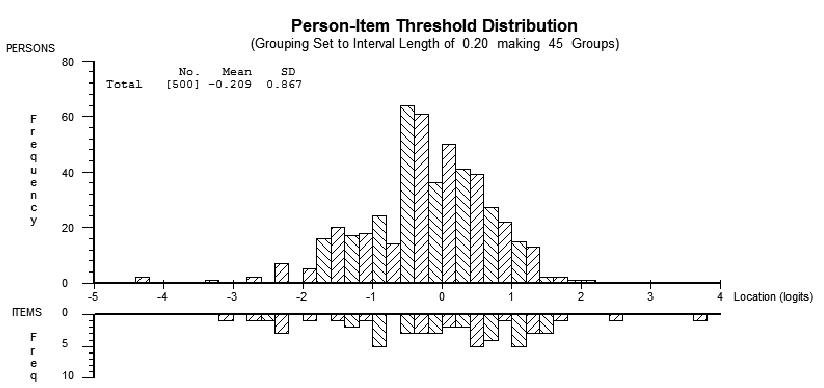 Click to show fullsize
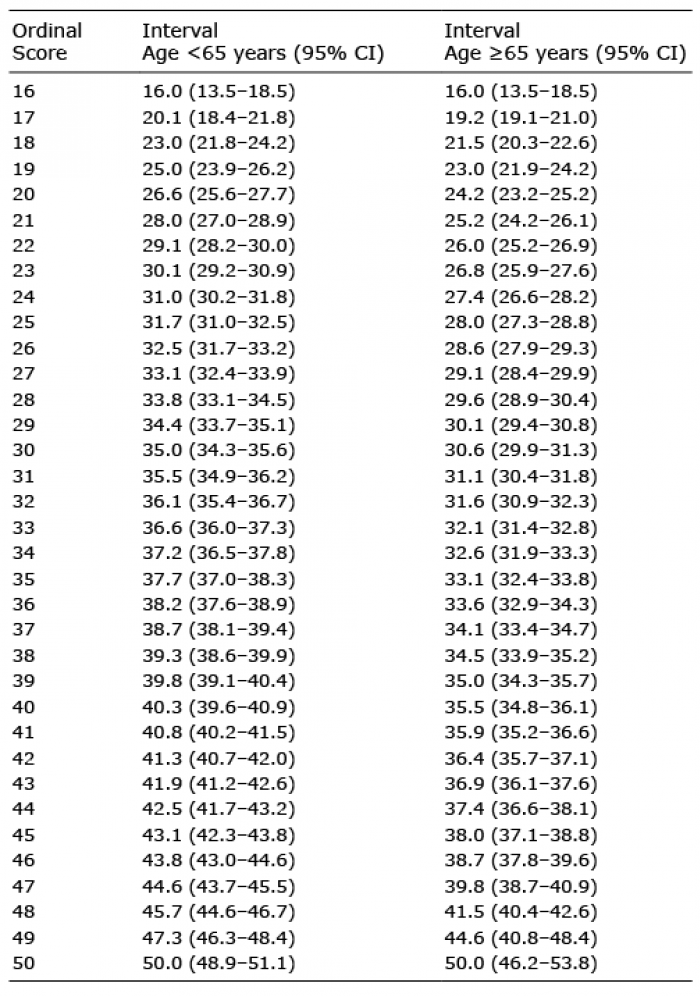 Click to show fullsize