
From the 1University of Groningen, University Medical Center Groningen, Department of Rehabilitation Medicine, Groningen, The Netherlands and 2School of Clinical Sciences, Queensland University of Technology, Brisbane, Australia
Objective: Adherence is a prerequisite for the effectiveness of orthopaedic footwear. The aim of this study is to assess the validity of a new temperature sensor for objective assessment of footwear use and non-use.
Design: Observational study.
Methods: The validity of a temperature sensor (Orthotimer, Balingen, Germany) to discriminate between time periods of use and non-use of footwear over a period of 48 h was assessed using 3 algorithms, in 10 healthy participants (mean age 32.8 years (standard deviation (SD) 14.1 years)). Footwear use measured with the sensor was compared with a reference standard, footwear use measured with a time-lapse sports camera secured to the shoe.
Main outcome measure: Hours of footwear use.
Results: Mean footwear use measured with the camera was 8.10 (SD 2.46) h per day. Mean footwear uses measured with the sensor and calculated with the 3 algorithms were 8.16 (SD 2.37), 8.86 (SD 2.48) and 4.91 (SD 3.17) h per day for the Groningen algorithm, algorithm-25, and algorithm-29, respectively. The correlation between footwear use assessed with the camera and with the sensor was: rGroningen = 0.995, ralg25 = 0.919 and ralg29 = 0.680).
Conclusion: The temperature sensor is a valid instrument to measure footwear use and non-use when using the Groningen algorithm.
Key words: orthopaedic footwear; adherence; use; temperature sensor; validity, feasibility.
Accepted Sep 11, 2018; Epub ahead of print Oct 9, 2018
J Rehabil Med 2018; 50: 00–00
Correspondence address: Thijs Lutjeboer, Department of Rehabilitation Medicine, University Medical Center Groningen, 9700 RB Groningen, The Netherlands. E-mail: t.lutjeboer@umcg.nl
Orthopaedic footwear is frequently prescribed to patients with a wide variety of pathologies, such as diabetes mellitus, rheumatoid arthritis, degenerative foot disorders and muscle disorders. For these patients, orthopaedic footwear is used for a range of serious foot and/or ankle problems; for example, to prevent the onset or recurrence of foot ulcers, to reduce pain, to support anatomical foot deformities, enhance stability and mobility, and redistribute plantar pressure. Orthopaedic footwear is only effective if they are used. To date, the use of orthopaedic footwear has mostly been assessed using questionnaires, interviews or diaries. However, these methods are not objective and lack accuracy. Temperature measurement can be used to determine the use of orthopaedic footwear. This study uses a new temperature sensor to objectively monitor use and non-use of orthopaedic footwear. Ten healthy participants were monitored over a period of 48 h using the sensor in their footwear. Footwear use based on the sensor data was compared with the reference standard, a camera attached to the footwear. The study found that the temperature sensor is a valid instrument to measure footwear use and non-use.
Orthopaedic footwear is frequently prescribed to patients with a wide variety of pathologies, such as diabetes mellitus, rheumatoid arthritis, degenerative foot disorders, and muscle disorders (1–3). For these patients, orthopaedic footwear is used for a range of serious foot and/or ankle problems: for example, to prevent the onset or recurrence of foot ulcers, reduce pain, support anatomical foot deformities, enhance stability and mobility, and redistribute plantar pressure (1–3). In the Netherlands alone, more than 100,000 pairs of (semi) orthopaedic footwear were prescribed in 2016, at a total cost of over 120 million euros (4, 5).
Adherence to use of orthopaedic footwear is a prerequisite to its effectiveness. Adherence is most frequently defined as “the extent to which a person’s behavior – taking medication, following a diet, and/or executing lifestyle changes – corresponds with agreed recommendations from a health care provider” (6). Studies of adherence to footwear use have reported a wide range of non-use, varying from 6% to 75% (3, 7–22). These major differences between studies may result from different definitions of use, differences in population, and methodological differences.
With respect to the methodology, adherence to use of orthopaedic footwear has mostly been assessed using questionnaires, interviews or diaries (3, 7–11, 15–22). These methods have poor accuracy because of recall and response bias or missing data-points (23, 24). It would be beneficial to use objective methods to assess adherence to orthopaedic footwear use.
A method that can be used to assess adherence to orthopaedic footwear use is temperature measurement. A temperature sensor placed in the inner lateral shoe border has been used in a study to assess the use and non-use of orthopaedic footwear (12, 13). However, this sensor had some disadvantages; it is relatively large (35 × 15 × 5 mm) and it is not commercially available. A new temperature sensor to monitor use and non-use in orthopaedic footwear has been developed. This sensor is small, can be embedded in the insole of the shoe, is capable of long-term data collection (> 100 days), and is commercially available. This new sensor has been used in a study to assess adherence to wearing footwear (25). However, the validity and feasibility of this temperature sensor have not been investigated. It is therefore unclear whether the use and non-use outcomes provided are valid.
The primary aim of this study is to assess the validity of a temperature sensor to measure footwear use and non-use in healthy individuals. In addition, the time to build the sensor into the insole, the data collection, and data analysis will be assessed as feasibility criteria.
Ten healthy participants (5 males, 5 females) with a mean age of 32.8 (standard deviation (SD) 14.1) years participated in this study. The inclusion criteria were: being able-bodied (self-reported), having a shoe size between 37 and 45 (European sizes), using shoes with shoe-laces and removable insoles. The study received clearance from the Medical Ethical Committee (UMCG METc: 2016.323, Groningen, the Netherlands), and all subjects gave their informed consent before participating.
The temperature sensor (Orthotimer, Balingen, Germany; http://www.orthotimer.com) is small (9 × 13 × 4.5 mm), dust-tight and watertight. Time, date, and temperature measurements are stored every 15 min and the sensor is equipped with a ring buffer with 100 days of storage capacity. The sensor has a temperature precision of ± 0.1°C, Quartz-controlled time measurement (32,768 kHz), and wireless data transfer via Radio Frequency Identification (RFID) technology (ISO 15693). The sensor is powered with a lithium dry cell battery (3.0 V/5.5 mAh) with a lifespan of at least 18 months. All these components are moulded into a plastic casing that provides stability against high pressure.
Participants’ footwear use was measured for 48 h. After this, the sensor data were collected with a wireless reading device that transferred the data to the accompanying Orthotimer software on the computer. The reading device and computer were connected via a USB plug. The sensor, reader, and software are CE Class 1 (MDD 2007/47 /CE) and approved by the Food and Drug Administration.
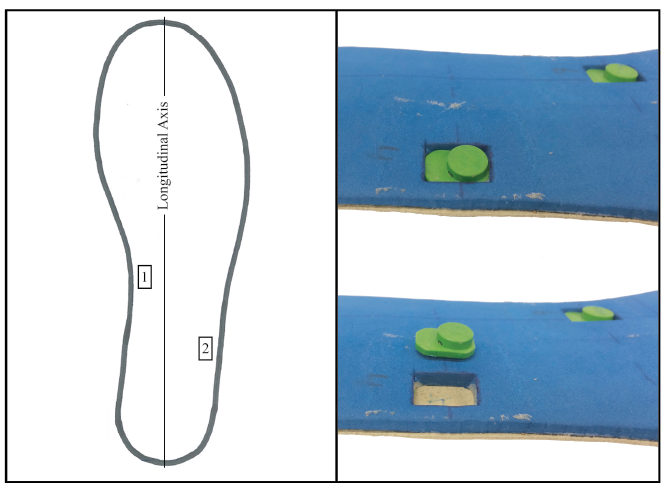
Four pairs of insoles were made from foam and leather in European shoe sizes 38, 40, 42 and 44. The insole pair that was closest to the participants’ shoe size was selected and provided with 2 temperature sensors in the left insole. Fig. 1 shows the sensor locations inserted in the underside of the left insole. The medial arch was selected as the sensor location because of the relatively low pressure from the foot in this area and sufficient space in the insole. A second sensor was placed at the lateral plantar side of the calcaneus to determine whether the location of the sensor in the insole was of importance to assess use and non-use of the footwear. This insole with 2 sensors was placed in the left shoe of the participant’s preferred footwear and a similar insole without temperature sensors was placed in the right shoe.
Fig. 1. Insoles used in the study; Left: View of the sensor locations in the underside of the left insole; Right: Plantar/lateral view of the left insole with one sensor in (top) and out (bottom) of the cavity.
A time-lapse sports camera (GoPro Hero Sessions, San Mateo, CA, USA) set at a sample rate of 1 frame per min was secured to the shoelace of the left shoe and focused on the lower leg, using a GoPro mount to enable solid attachment of the camera to the shoe (Fig. 2). All subjects kept a log of their donning and doffing for the period of 48 h, to be used when missing data occurred.
The validity of the temperature sensor to discriminate between time periods of use and non-use of footwear over a period of 48 h was assessed. The data from the sensors were compared with the reference standard data from the camera. Subjective evaluation of the time an experienced shoe technician needed to build the sensor into the insole, and the data collection and analysis, was used to assess feasibility.
Fig. 2. Left: Study setup with camera secured to the shoelace of the shoe and focused on the lower leg. A powerbank, attached to the ankle with Velcro, provided the camera with sufficient power. Right: A sample from the camera data during use (top) and non-use (bottom) of the footwear.
All photographs taken during the 48 h period were scored as either “footwear use” or “footwear non-use”. This was assessed manually by observing whether there a leg was visible on the photograph, and therefore the shoe was being worn at that time-point. The primary outcome measure was “hours of footwear use per day” based on 1-min interval measurements during the full observation period.
Temperature data were collected from the sensors using the reading device and the accompanying software. Three different algorithms were used to calculate use based on the 15-min intervals of sensor measurements. For each algorithm, scores were given of “footwear use” or “footwear non-use” for the entire 15-min period between measurements.
The first algorithm made use of the software provided by the manufacturer. This algorithm uses a fixed cut-off score of 29°C to determine use and non-use. When the temperature reaches a value above the cut-off score, the footwear is classified as being used (algorithm-29). Secondly, a previous study has used a 25°C cut-off score to determine use and non-use (algorithm-25) (14). Finally, we developed the Groningen algorithm using custom-written Matlab scripts. Our algorithm did not use a cut-off temperature score. In our opinion, a fixed cut-off score is too sensitive to surrounding temperature changes, for example during warm days, in countries with a warmer climate or when footwear is placed next to a heater. Instead, we based our algorithm on slopes in the temperature data.
Three steps were needed to calculate the Groningen algorithm. Step 1 was to calculate the slope of the temperature curve over time. Step 2 was to identify the peaks (local maximum and minimum) in this temperature slope curve to find large temperature shifts. We hypothesized that these peaks aligned with the donning (a local maximum) and doffing (a local minimum) of the footwear. Step 3 was to differentiate between “true peaks” that indicate donning and doffing of the footwear and “false peaks” that are sudden temperature changes that are not contributed to either donning or doffing of the footwear. We expected that these false peaks would occur during use (variability in foot temperature) or when sudden temperature fluctuations occurred in the environmental temperature (indoor to outdoor, sunlight or a heater) during non-use. To eliminate false peaks we determined a local cut-off by calculating the local mean temperature plus 1 SD (local cut-off). As illustrated in Fig. 3, this identification was assessed by calculating the mean temperature and SD, measured with the sensor, over a period of 24-h (12 h before the specific peak until 12 h after this peak). If less than 12 h of data was available before or after a peak, the interval was shortened. As can be seen in Fig. 3, a peak (Peak A) in the temperature slope curve was determined by the difference between 2 consecutive data-points (points A and B). After a positive peak, the value of the next data-point in the temperature curve needed to be above the local cut-off to be classified as a true peak. After a negative peak, the value of the next data-point in the temperature curve needed to be below the local cut-off to be classified as a true peak. The interval between a positive and a negative true peak indicated the time of use of footwear.
Fig. 3. Illustration of the Groningen algorithm to determine footwear use, based on temperature peaks. Peak A is determined using consecutive data-points A and B. The local 24-h mean temperature plus 1 standard deviation (SD) is calculated with the 12-h temperature data before and after the specific peak.
The Friedman pairwise comparison test was performed to assess if the 3 techniques were statistically different from the camera (gold standard). Significance values were adjusted using the Bonferroni correction for multiple tests. Alpha was 5%. The Pearson correlation coefficient between footwear use based on the camera (reference standard) and the sensor located at the medial arch was calculated for the 3 different algorithms. For all 3 algorithms an absolute agreement for every data-point was assessed compared with the reference standard. Every data-point from the sensor was compared with the corresponding 15 data-points from the camera. Agreement is found when a data-point from the sensor indicated use and 8 or more of the 15 data-points also indicated use, and vice versa. The absolute agreement was calculated in percentages with 192 data-points for algorithm-25 and algorithm-29 and 191 data-points for the Groningen algorithm. Footwear use based on the sensor located at the lateral calcaneus was compared with footwear use based on the medial arch sensor to determine the difference between both sensor locations using the Groningen algorithm. All statistical analyses were performed using IBM SPSS Statistics version 23. No assumptions were violated.
From the 10 participants, 4 had no missing data; 6 had one sensor with missing data-points (twice the medial arch sensors; 4 times the lateral plantar calcaneus sensor), but their other sensor had no missing data-points. Consultation with the manufacturer took place to discuss the missing data-points in the 6 sensors. All sensors with missing data-points came from one batch, in which the components of the sensors were moulded into a more flexible plastic casing that provided less protection compared with the casing from other batches. The flexibility of these casings could not be quantified further.
Mean footwear use measured with the camera (reference standard) was 8.10 (SD 2.46) h per day. Mean footwear uses measured with the sensor and calculated with the 3 algorithms were 8.16 (SD 2.37), 8.86 (SD 2.48) and 4.91 (SD 3.17) h per day, respectively, for the Groningen algorithm, algorithm-25 and algorithm-29 (Table I). Pairwise comparison showed that use measured with the Groningen algorithm (p = 1.000) and the algorithm-25 (p = 0.226) was not significantly different from the use measured by camera. Algorithm-29 (p = 0.034) however, was significantly different from the use measured by camera (Table II).
Table I. Footwear use according to the camera, and all 3 algorithms, the absolute difference between all 3 algorithms compared with the reference standard (camera) and the absolute agreement for the use and non-use for all data-points of all 3 algorithms compared with the camera
Table II. Friedman pairwise comparison (p-values) and Pearson correlation coefficients (r and p-values) between the camera and all 3 algorithms
The correlation between footwear use assessed by camera and by sensor was: rGroningen = 0.995, p < 0.001, ralg25 = 0.919, p < 0.001, and ralg29 = 0.680, p = 0.031). Fig. 4 shows all participants’ use and non-use of footwear over a period of 48 h. Fig. 5 shows the absolute differences between all 3 algorithms and the reference standard (camera). The 2 black horizontal lines are set at plus and minus 60 min (1 h). The Groningen algorithm was 9 out of 10 times within 1 h of the reference standard. Algorithm-25 was 5 out of 10 times within 1 h of the reference standard and algorithm-29 1 out of 10 times. The Groningen algorithm provided the mean footwear use that was closest to the reference standard and the highest correlation (Table II).
Fig. 4. Camera and sensor data for all participants (1–10) over a period of 48 h of footwear use and non-use based on the Groningen algorithm. Squares and diamonds indicate maximum temperature slopes used to determine footwear use.
Fig. 5. The absolute difference between footwear use measured with the camera and all 3 algorithms (in minutes) for all participants (1–10) over a period of 48 h. Black horizontal lines are set on +60 min and –60 min.
The absolute agreement on use and non-use of footwear compared with the reference standard was 99% for the Groningen algorithm, 97% for algorithm-25, and 86% for algorithm-29. Using the Groningen algorithm, similar footwear use (p < 0.001) was found between different sensor locations in the 4 participants who had 2 sensors with complete recordings (medial arch sensor: 8.28 (SD 2.74) h per day; lateral calcaneus sensor: 8.28 (SD 2.73) h per day).
After consultation with an orthopaedic shoe technician, the time to build the sensor into an insole of orthopaedic footwear was estimated at 5 min. On being asked, all subjects did not notice the presence of the sensors in the insole during the study. Data were collected easily from the sensor using the reading device. The export of raw data and analysis in Matlab version R2015b was performed without difficulties.
This study investigated a new temperature sensor to assess footwear use and non-use, using 3 different algorithms. The temperature sensor was found to be a valid instrument to measure footwear use and non-use in healthy individuals, when use and non-use was determined using the Groningen algorithm. Algorithms using a fixed cut-off score (as provided by the sensor manufacturer or used in another study) resulted in lower correlations and a larger absolute difference compared with the reference standard.
The Groningen algorithm to calculate footwear use based on the sensor data proved superior to both algorithm-25 and algorithm-29, because these algorithms use fixed cut-off temperatures. An algorithm with a fixed cut-off temperature to identify use and non-use of footwear is strongly discouraged, as the environmental temperature changes frequently. This may cause false-positives (the sensor measuring footwear use when the footwear is not used) and false-negatives (the sensor measuring footwear non-use when the footwear is used), and results in overestimation (when a low cut-off score is used) or underestimation (when a high cut-off score is used) of footwear use. With a correlation of 0.995 between the Groningen algorithm and the reference standard, the warming-up and cooling-down time of the sensor after donning and doffing does not have to be taken into account.
The installation of the sensor in the insole of the participants’ preferred footwear, the data collection, the export of the raw temperature data from the software, and the import of the temperature data in Matlab were all performed easily. Therefore, the sensor met the feasibility criteria, and can be used for assessment of adherence with footwear on a larger scale. Given the sensor’s validity, feasibility and capability of 100 days of data storage, it would be appropriate for monitoring long-term adherence to (orthopaedic) footwear.
It is worth noting the variability in temperature measured when the footwear is used compared with limited variability in temperature during non-use. This variability could be an interesting parameter to improve the algorithm in the future.
While the sensor measures temperature, it should be noted that it cannot be used for assessment of the temperature of foot skin in prevention of diabetic foot ulcers. The sensor is placed under the medial arch to avoid high pressures; for ulcer prevention, measuring temperature is especially important under the forefoot, and a minimum of 6 sensors would be needed per foot (26).
Adherence to orthopaedic footwear is a prerequisite for its effectiveness. This temperature sensor can be helpful to objectively monitor patients’ use and non-use of orthopaedic footwear. Due to the long-term capacity of the sensor, valuable data can be collected to objectively measure long-term adherence to orthopaedic footwear. It may also be hypothesized that monitoring and visualizing footwear adherence might work as an educational and gamification intervention, to improve adherence to footwear. Future research with this sensor may answer these questions, and may provide objective and reliable information for patients, healthcare professionals and researchers.
The study was performed on healthy individuals. However, we expect similar temperature patterns during use and non-use in patients with orthopaedic footwear. Six of the 20 sensors used came from a batch with a plastic casing that was more flexible than other batches. This casing was not strong enough to protect the hardware of the sensor from external (body) weight and other forces. After consultation between researchers and manufacturer, the sensors were moulded into a more rigid casing to enhance stability and protection of the hardware. For 6 subjects, we could therefore not distinguish between the 2 sensor locations. A potential limitation is that measurements were performed in the summer. The temperature differences, and therefore the amplitude of the peaks, can be hypothesized to be larger in the winter season. This in turn, may influence the value of the standard deviation calculated to determine the local cut-offs in the Groningen algorithm. While we expect the Groningen algorithm to generate similar outcomes, it would be interesting to investigate the sensor in different environments.
The sensor measures temperature every 15 min, whereas the camera measures footwear use every minute. Despite the strong agreement between camera and Groningen algorithm, the 15-min interval lacks accuracy. Very short periods of use could therefore be missed.
We do not expect different outcomes in a larger population; however, potential differences resulting from sensor placement may need to be validated in a larger population.
All the sensors were placed in the left insole. For reporting whether the participants felt the presence of any sensors, it would have been better to have placed some sensors in the left and some in the right insole.
This temperature sensor is a valid instrument to measure footwear use and non-use in healthy individuals, when use and non-use is determined using the Groningen algorithm. The installation of the sensor in the insole of the participants’ footwear and the data collection were performed with no difficulties. Given the sensor’s capability of 100 days of data storage, it would be appropriate for use in long-term monitoring of adherence to (orthopaedic) footwear.


 Click to show fullsize
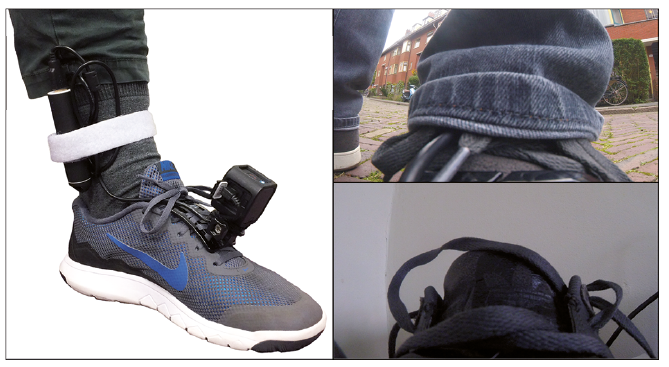 Click to show fullsize
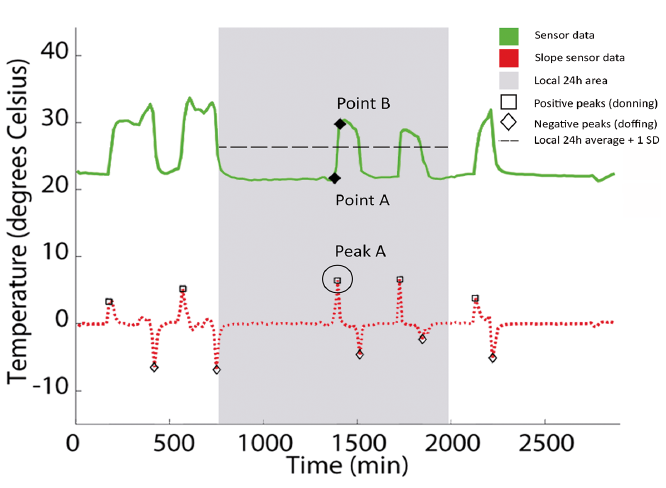 Click to show fullsize
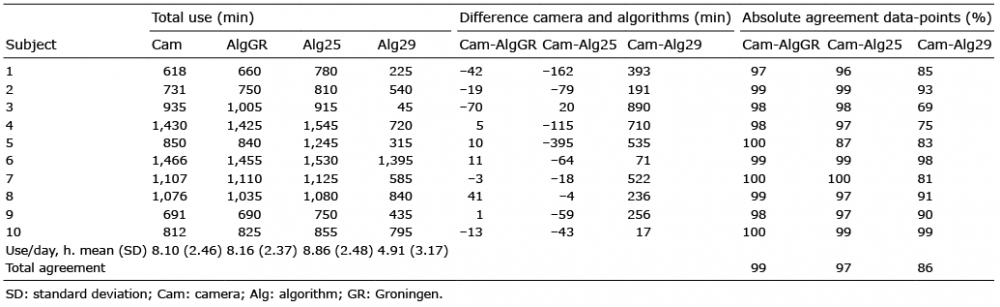 Click to show fullsize
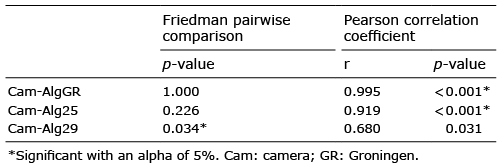 Click to show fullsize
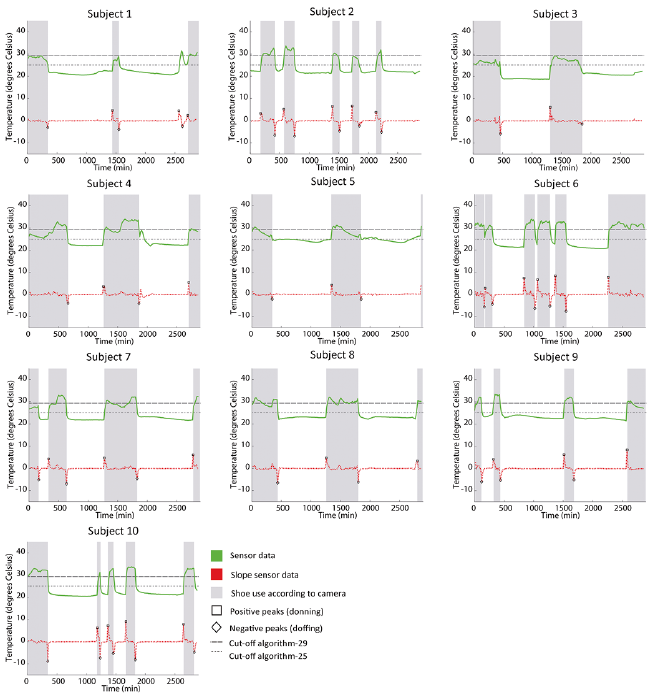 Click to show fullsize
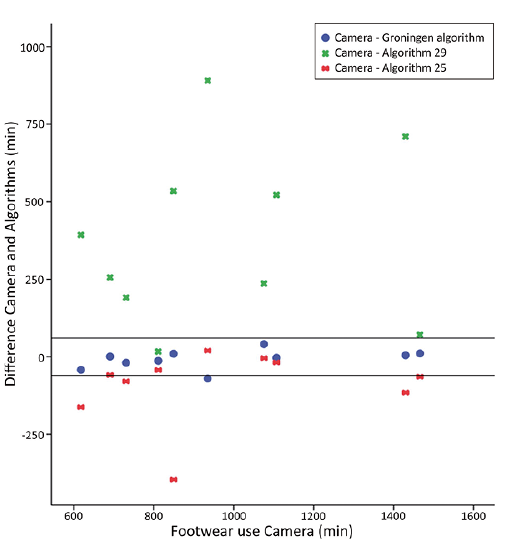 Click to show fullsize