
From the 1Swiss Paraplegic Research, Nottwil, Switzerland, 2Department of Health Sciences and Health Policy, University of Lucerne, Lucerne, Switzerland, 3Faculty of Applied Health and Social Sciences, Technical University of Applied Sciences Rosenheim, Rosenheim, Germany and 4NRP74 StARS clinics (aarReha Schinznach – Stefan Bützberger, Berner Klinik Montana – Dieter Ernst, Berner Reha Zentrum Heiligenschwendi – Jürg Wägli, Clinica di Riabilitazione EOC Novaggio & Faido – Giovanni Rabito, Clinica Hildebrand – Sandro Foiada, Clinique La Lignière – Nicolas Walther, Felix Platter Spital – Stefan Engelter, Hôpital du Valais Spital Wallis Centre Martigny, Sierre, Brig & Saint Amé – Els De Waele, Kantonsspital Baselland Bruderholz & Laufen – Beat Ritter, Klinik Schloss Mammern – Ruth Fleisch-Silvestri, Kliniken Valens Rehazentrum Valens, Rehazentrum Walenstadtberg & Rheinburg-Klinik – Stefan Bachmann, Rehaklinik Dussnang – Javier Blanco, Rehab Basel – Margret Hund – Georgiadis, Zürcher RehaZentrum Wald – Matthias Hermann, Rehaklinik Zihlschlacht – Michèle Bongetta, Spitäler Schaffhausen – Jan Kuchynka, Universitätsklinik Balgrist – Serge Altmann)
Objective: Since the 1990s the Functional Independence Measure (FIM™) was believed to measure 2 different constructs, represented by its motor and cognitive subscales. The practice of reporting FIM™ total scores, together with recent developments in the understanding of the influence of locally dependent items on fit to the Rasch model, raises the question of whether the FIM™ 18-item version can be reported as a unidimensional interval-scaled metric.
Design: Rasch analysis of the FIM™ using testlet approaches to accommodate local response dependency.
Patients: A calibration sample containing 946 cases of data from 11,103 patients undergoing neurological or musculoskeletal rehabilitation in Switzerland in 2016.
Results: Baseline analysis and the traditional testlet approach showed no fit with the Rasch model. When items were grouped into 2 testlets, fit to the Rasch model was achieved, indicating unidimensionality across all 18 items. A transformation table to convert FIM™ raw ordinal scores to the corresponding Rasch interval scaled values was created.
Conclusion: This study provides evidence that FIM™ total scores represent a unidimensional set of items, supporting their use in clinical practice and outcome reporting when applying the respective transformation table. This provides a basis for standardized reporting of functioning.
Key words: outcome assessment (healthcare); psychometrics; rehabilitation; activities of daily living; Rasch measurement model; Functional Independence Measure.
Accepted Jan 24, 2019; Epub ahead of print Mar 5, 2019
J Rehabil Med 2019; 51: 193–200
Correspondence address: Roxanne Maritz, Rehabilitation Services & Care Unit, Swiss Paraplegic Research, 6207 Nottwil, Switzerland. E-mail: roxanne.maritz@paraplegie.ch
The aim of this study was to look in detail at the FIM™, an assessment tool often used for patients undergoing rehabilitation. Some users report the FIM™ as 2 scores: one related to motor tasks, the other to cognitive tasks; others recommend reporting it as a single score including both motor and cognitive tasks. This study explored whether it is statistically meaningful to sum all the points into a single FIM™ total score. The results support the current practice of summing the points into a single total score for patients undergoing musculo-skeletal and neurological rehabilitation. The results also allowed an interval scale to be derived from the FIM™, enabling a broad range of calculations to be made using the FIM™ score, such as calculating the change in FIM™ outcomes from the time a patient is admitted to a rehabilitation clinic until their discharge.
The primary outcome of rehabilitation is functioning (1). In order to document and monitor functioning, existing data collection tools can be used (2). The Functional Independence Measure (FIM™) is an assessment tool that is widely used in rehabilitation worldwide (3–6). The FIM™ is applied at the patient level to measure change throughout rehabilitation, at the institutional level to measure outcome quality, and at the national level for performance reporting or quality monitoring. Examples of use of the FIM™ are the reports of the Swiss National Association for Quality Development in Inpatient Care (ANQ) (7), the US model system for spinal cord injury (8) and traumatic brain injury (9), the Canadian Institute for Health Information (CIHI) (10), and the Australasian Rehabilitation Outcome Centre (AROC) (11). Furthermore, FIM™ measures can serve as a basis for inpatient rehabilitation payment (12). As with any assessment tool, in order to report valid total scores, certain psychometric standards must be met, including the assumption of unidimensionality. Furthermore, if an assessment tool is used to calculate change scores, it must be interval-scaled, rather than ordinal-scaled (6, 13). The Rasch measurement model can be used to examine assumptions such as unidimensionality or local item dependencies. Where satisfactory fit of data to the model is achieved, an interval-scaled metric can be derived from ordinal scales (14, 15).
Earlier analysis of the FIM™ using Rasch analysis in the 1990s indicated that the FIM™ 18-item version incorporates 2 different constructs, represented by a motor scale and a cognitive scale, each of which should be scored separately (16). However, in clinical practice both the reporting of 2 separate motor and cognitive total scores and the reporting of a single total score of the FIM™, is evident (7, 9, 11). Since this first Rasch analysis of the FIM™, many others have been publish-ed, mostly on its motor subscale (17), but also on adaptations of the FIM™ (18, 19). More recently, the issue of so-called local item dependency has received attention (20). Local item dependency occurs when instrument items remain correlated when conditioned on the trait, what is functional independence in the case of the FIM™. Local dependency is indicated by significant correlation of the standardized analysis residuals. Fit of the FIM™ motor scale to the Rasch model has been shown to be seriously affected by local item dependency, which, once accommodated, resulted in adequate model fit (17).
Thus, given the recent methodological developments with regards to addressing the issue of local dependency in health scales, and inconsistency in reporting the FIM™ in practice, a review of the FIM™ 18-item version seemed appropriate, in order to address the following question: Is it possible to add all FIM™ items together to obtain a valid unidimensional total score, taking into account the local dependency in its item set? The objective of this study was therefore to revisit the question of whether the FIM™ can be reported as a unidimensional interval-scaled metric when local dependency is taken into account. Two specific aims in relation to the study’s objective were: (i) to explore the metric properties of the FIM™; and (ii) to determine whether an interval-scale scoring system of the FIM™ 18-item version can be made available and, if so, to create an interval-scale transformation of the FIM™ raw scores when administered in the context of national quality monitoring in neurological and musculoskeletal rehabilitation.
Data collected routinely for the Swiss national quality reporting, coordinated by the ANQ, was used for secondary analysis. All 64 Swiss rehabilitation clinics that provided data to the ANQ in 2016 for musculoskeletal or neurological rehabilitation were contacted, of which 30 voluntarily agreed to provide their ANQ datasets. Since the clinics can choose between different assessment tools in ANQ data collection, not all datasets contained FIM™ data. Thus, this study used datasets from 23 rehabilitation clinics, with 11,103 complete cases in total, representative of 3 different Swiss language regions (German, French, Italian). The FIM™ was administered at admission and discharge. Ethics approval for the study was requested from the Swiss Ethics Commissions, which stated in a declaration of no objection that the project fulfils the general ethical and scientific standards for research with humans and poses no health hazards.
The FIM™ is an assessment tool comprising 18 items. Thirteen items belong to the motor subscale and 5 items belong to the cognitive subscale. All items are scored from 1 (total assistance) to 7 (complete independence). The FIM™ item scores are summed up to a total score, ranging between 18 and 126, or total motor score ranging between 13 and 91 and between 5 and 35 for the cognitive total score (4). The ANQ used German, French and Italian translations of the FIM™ based on its official English version, on which a translation agreement was made with the Uniform Data System for Medical Rehabilitation (UDSMR). As this is common practice, the translations have not been authenticated by the UDSMR. In order to qualify to administer the FIM™ , the health professionals received training provided by the ANQ according to the respective UDSMR policy.
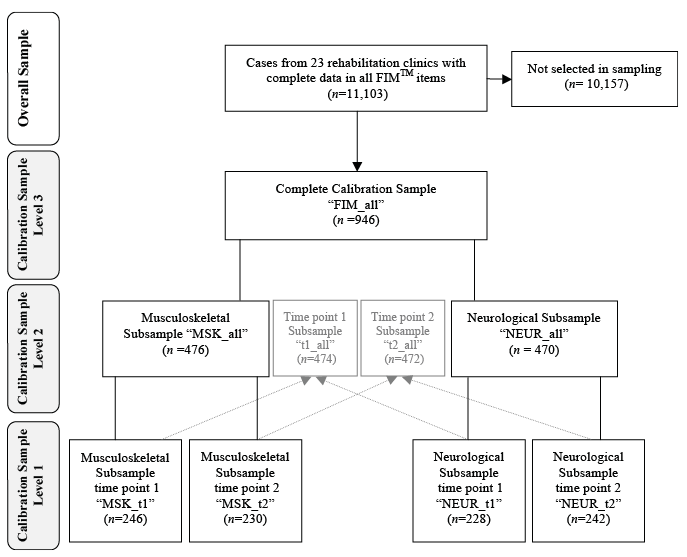
A random stratified calibration sample was created using R (21), since type I errors, i.e. rejecting a hypothesis even if it was true, are likely to appear with a large sample size in Rasch analysis (22). The aim was to create a sample of approximately 1,000 cases, representing 4 equally sized subsamples, each with sufficient sample size for a stable item calibration and statistical interpretation (23, 24). Each subsample focused on one of the 2 different time-points of measurement, and one of the 2 different health condition groups of musculoskeletal and neurological rehabilitation: musculoskeletal cases at admission (MSKt1), musculoskeletal cases at discharge (MSKt2), neurological cases at admission (NEURt1) and neurological cases at discharge (NEURt2). To obtain precision across the whole range of scores (total score range 108; 18–126) and representation of language regions, a random sample was taken from each available total score per subsample and language region group. Cases that were selected from the admission subsamples were excluded and not selected for the discharge subsamples (25). Prior to the random selection all cases with missing values in a person’s contextual factors of interest (described in more detail below) and all cases that scored an extreme score (18 or 126), were deleted, since they are excluded from the calculation of item difficulties by the Rasch measurement model. The sampling strategy is shown in Fig. 1.
Fig. 1. Flow chart calibration sample with 3 different aggregation levels. FIM: Functional Independence Measure.
To summarize basic sample characteristics and response distributions of the FIM™, descriptive statistics were conducted with Stata Version 14.2 (26). In order to achieve the study’s first specific aim Rasch analysis was conducted using RUMM2030 (27). The analytical focus gave reference to local response dependency represented by residual correlations. High residual correlations indicate that items are measuring the same thing too closely (13). Furthermore, threshold disordering was examined, which indicates that the different response categories of an item are not in a successive order, i.e. do not represent an increasing level of functional independence. In addition, differential item functioning (DIF) was evaluated, which indicates that, while accounting for the trait, an item works differently for certain groups defined by a contextual factor, such as gender or age. The partial credit model was applied, which has been shown previously to be the appropriate parametrization for the FIM™ (17, 28).
The baseline analysis tested how well the observed data from all 18 items fit the Rasch model (15). To do so, the individual and overall item-fit, the person-fit, the reliability indices α and person separation index (PSI), and the χ2 p-value of the item-trait interaction standing for the fit of the data to the Rasch model were ascertained. The respective acceptable levels are represented in the bottom line of the corresponding results table. In addition, local response dependency among items was scrutinized, along with threshold disordering of item categories, and DIF for the following 7 factors: gender, age (4 age groups according to the interquartile ranges), nationality (Swiss or other), insurance (general, semi-private, private), rehabilitation group (neurological or musculoskeletal rehabilitation), clinic language (German, French or Italian) and time-point of measurement (admission t1, discharge t2). Both individual item-fit and DIF analyses p-values are Bonferroni adjusted in the RUMM2030 software.
Where the local independence assumption of the Rasch model was not met, testlet approaches were applied. A testlet is a simple sum score from a set of associated items, making the set into a single new “super”-item in order to absorb their dependencies (20, 29–31). The creation of testlets revealed positive results in earlier Rasch analyses of the FIM™ motor scale (17). Two different testlet approaches were used: one approach, referred to as traditional testlet approach, creating testlets oriented at conceptually associated items and based on their residual correlations (32). By grouping similar items into super-items, such as, for example, all the transfer items of the FIM™ , this traditional testlet approach highlights the potential differences, e.g. dimensionality between testlets unifies similar items, such as “self-care”’ or “transfer”. The other approach, referred to as alternative 2-testlet approach, divides conceptually similar items into 2 distinct testlets of equal size, taking alternative items in each testlet. This approach focuses on the total score of the FIM™ rather than the single items or groups of items by emphasizing the similarity of the items, as together they should measure the concept of functional independence. In delivering a bi-factor equivalent approach, the alternative 2-testlet approach has the advantage of creating testlets of equal size, as recommended by Andrich (29). Another advantage of the 2-testlet approach is that it allows for a conditional test of fit. Furthermore, all testlet-based approaches allow the calculation of the “explained common variance”’ attributable to the general “first factor”, indicating the proportion of variance retained to create a unidimensional latent estimate (29). Acceptable values of these additional statistics are indicated at the bottom of the respective testlet result table. The analysis of threshold disordering is not meaningful at the level of testlets, as a particular score can be derived in a number of ways, and is therefore not reported.
To ensure robustness of the results, the baseline analysis and the best-fitting testlet approach was conducted at 3 levels of aggregation of the calibration sample (see Fig. 1). In Level 1 all 4 subsamples were analysed separately (MSKt1, MSKt2, NEURt1 and NEURt2). In Level 2 the rehabilitation group and time-point subsamples were aggregated respectively (MSKt1&t2, NEURt1&t2, t1MSK&NEUR, t2MSK&NEUR). Level 3 represents the aggregation of all 4 subsamples, i.e. the entire calibration sample (FIM_all). Together, these 3 aggregation levels resulted in 9 analysis steps.
For both testlet approaches, the emphasis is on making existing assessment tools work without the need to delete items or change the scoring structure.
DIF was analysed in situations in which local dependencies could be accommodated satisfactorily with testlets. Where a lack of group invariance was observed, the testlets for the contextual factor were split on the basis of the strongest DIF, and continued until no further DIF was present (33). The split and unsplit solutions were then compared with each other on the basis of the Rasch person estimates, anchored to each other with an unsplit item free of DIF. An effect size calculation, based on the mean of the person estimates, their standard deviations, and the correlation of the split and unsplit version (34) was applied to determine whether DIF split was necessary for the final transformation table. If the effect size was below 0.2, DIF was considered small (35) and no action was taken to adjust for DIF.
The second specific aim of this study was to develop a transformation table in case fit to the Rasch model could be achieved. The solution with the best fit to the Rasch model was taken as a basis for this transformation, i.e. the solution with the most satisfactory core values for the entire calibration sample. The transformation table from FIM™ raw ordinal total scores to the corresponding interval-scaled values was based on the respective estimates according to the Rasch model.
The calibration sample included 946 cases. Of these, 476 were musculoskeletal cases and 470 neurological cases. A total of 474 cases were from time-point 1 admission, and 472 from time-point 2 discharge (see Fig. 1). FIM™ total scores had a mean of 81.7 (standard deviation (SD) = 27.5, median = 84). The mean age of subjects in the calibration sample was 71.6 years (SD = 14.5, 20–102 years). The calibration sample was 43% (n = 403) male and 57% (n = 543) female; 41% (n = 392) were from the German-speaking region of Switzerland, 25% (n = 238) from the French-speaking region and 34% (n = 316) from the Italian-speaking region; 84% (n = 798) of the sample were Swiss and 16% (n = 148) had another nationality. Insurance status was: 67% (n = 633) general, 18% (n = 172) semi-private, and 15% (n = 141) private.
In the 9 baseline analysis steps across the 3 aggregation levels of the calibration sample, no fit to the Rasch model was achieved (Table I). In all analyses the p-values of the item-trait χ2 were significant. Furthermore, in all analysis steps there were items that showed local dependencies among each other, DIF and threshold disordering. Information on threshold disordering and local dependency of the baseline analyses are shown in Appendix S11.
Table I. Functional Independence Measure (FIM™) baseline analyses
Within the traditional testlet approach 3 different versions of testlet combinations were applied, based on the underlying subscale structure of the FIM™. Two versions included 4 testlets for the motor scale, structured according to the FIM™ subtopics (self-care, sphincter control, transfers, locomotion) together with 2 combinations of the cognitive items. In one version all the cognitive FIM™ items were unified in one testlet, since they all showed local dependency among each other at the baseline analysis, resulting in a total of 5 testlets. In the other version, the cognitive items were split thematically according to the FIM™ subtopics into 2 testlets, communication and social cognition, resulting in a total of 6 testlets. The third version attempted to form similar sized testlets and was oriented at the residual correlations between the items and formerly reported clusters of the FIM™ (29, 36). In this version, 3 testlets were created: a self-care testlet incorporating items A–H, a mobility testlet incorporating items I–L, and a cognitive testlet incorporating items M–R. None of the 3 traditional testlet approaches, the 3-testlet, the 5-testlet and the 6-testlet version, resulted in fit to the Rasch model (see Table II).
Table II. Testlet solutions on the level of the whole calibration sample (FIM_all)
In contrast, the alternative 2-testlet approach (with Testlet1 containing items A, C, E, G, I, K, M, O and Q, and Testlet2 containing items B, D, F, H, J, L, N, P and R) showed fit to the Rasch model across all 9 analyses steps. The p-values from the item-trait χ2 were all non-significant at the 0.01 level, the reliability indexes all above 0.9, and the item- and person-fit estimates within the set acceptable values. The expected common variance values retained in the latent estimate were all just above 1, indicating some marginal remaining residual local dependency among the testlets. The fit of all testlet solutions is summarized in Table II, and the application of the 2-testlet approach to all aggregation levels of the calibration sample is shown in Appendix S21.
Despite overall fit, some DIF remained in the 2-testlet solution for the whole calibration sample. For eliminating all DIF, the successful 2-testlet solution of the whole calibration sample had to be split twice. Testlet2 first had to be split by rehabilitation group. Secondly, the group of musculoskeletal rehabilitation from Testlet2 had to be split into the 2 time-points, i.e. admission and discharge. This resulted in the following super-items: Testlet1, Testlet2_NEUR, Testlet2_MSKt1, and Testlet2_MSKt2. Testlet1 was the anchor for the comparison of the person estimates of the split and the unsplit version. The effect size calculation resulted in 0.11 (see Appendix S31), indicating that there was no need to split the final interval-scale transformation into different subgroups.
Based on the 2-testlet solution, an interval-based transformation table was created for all available FIM™ total scores, which can be used to transfer the ordinal-scaled FIM™ raw scores into interval-scaled FIM™ scores (see Table III).
Table III. Functional Independence Measure (FIM™) total score transformation table: original scores to interval scores
This is the first study to provide evidence of the unidimensionality of the FIM™ 18-item version when administered to neurological and musculoskeletal patients in an inpatient rehabilitation setting. Although the baseline analyses and the traditional testlet approaches did not result in Rasch model fit, an alternative 2-testlet approach, emphasizing the sameness of the FIM™ items with 2 equally sized super-items, achieved model fit. The robustness of these results was confirmed in repeating the same strategy for all subsets of the calibration sample. These results provide evidence for the internal construct validity of the FIM™ total scores based on 18 items, and thus support its reporting as a total score in clinical practice. Based on the current results, an interval-scale transformation table of the FIM™ total scores for use in national quality monitoring for neurological and musculoskeletal patients could be provided.
The traditional testlet approach applied in this study builds on the successful Rasch analysis strategy for FIM™ motor items (17). Nevertheless, when adding the cognitive item set to the motor items, the 4 testlet solution in the original paper could not be confirmed in this study. Highlighting the sameness of all the items through the 2-testlet approach attained model fit. The assumption of multidimensionality is often pursued in FIM™-related Rasch analyses (36). The extent of local dependency among the 18 items, clustered into the underlying structures raises questions as to whether the FIM™ should a priori be divided into multidimensional concepts, as proposed by Linacre and colleagues (16). The successful summation of the 18 FIM™ items in the current study places emphasis on the higher order construct of functional independence, incorporating both motor and cognitive aspects. Likewise, the Rasch analysis performed supports the theory that, when activities of daily living are observed, motor activities reflect some cognitive aspects and vice versa (18, 37). From a clinical perspective, the FIM™ offers different levels of granularity for reporting. Scores can be reported at the level of the single items, the item headings, e.g. sphincter control, on the level of the motor and cognitive subscales, or the level of the overall 18-item summary of functional independence. Thus, different granular levels of reporting are available, depending upon the use required.
The study can be also be seen as initial evidence that the German, French and Italian translations of the FIM™ do not substantially differ from each other, given the absence of substantial DIF by language. Furthermore, this study provides first evidence for the internal construct validity of the FIM™ 18-item version for musculoskeletal patients, given that no substantial DIF was present between the musculoskeletal and the neurological rehabilitation group. Nevertheless, the use of cognitive items for a musculoskeletal patient population within a national outcome report, as in the ANQ, remains debatable, and care should be taken to consider whether only motor items should be assessed. In the US model system for burn injury, for example, only the FIM™ motor subscale is assessed (38). However, with regards to the ageing population and related comorbidity (39), both subscales may be of interest in musculoskeletal patients.
This study has the limitations of secondary data analysis. For example, there is a lack of information on the accuracy and consistency of the data-entry process, the selection of DIF factors was limited to the variables of the dataset and the use of non-validated translations. However, this design enabled a well-tailored calibration sample to be obtained from a large sample size. Another limitation is in the 2-testlet approach, which provides the basis for the transformation table. On the one hand, this approach was successful in attaining model fit. On the other hand, the approach does not allow a statement to be made about the hierarchy and difficulty of single items or a conceptually related group of items, since it focuses on the whole construct being measured through the assessment tool. However, while, for the purpose of quality or outcome reports, the FIM™ is based on the total score or change scores, data collection is still conducted on an item level, which allows clinicians to gain insight into the development of a single patient in a certain item or group of items, or to conduct a quality check of scores at the item level if the FIM™ was, for example, applied within a payment system.
The analysis of threshold disordering is also not possible with the testlet approach. Indeed, there is some evidence that disordered thresholds can themselves be caused by local dependency (20, 40). For example, if items are analysed within their subscales, threshold ordering may appear correct, but become disordered when subscales are summated together. Thus, it becomes impossible to determine if disordered thresholds are a consequence of local dependency, as the solution for local dependency renders interpretation of traditional thresholds invalid (20). Since the 2-testlet approach is a relatively new one for health assessment tools, further investigations are needed to confirm the influence of local dependency on such matters. However, this approach has the advantage that the total scores of a well-established and widely used assessment tool, such as the FIM™, can be converted on an interval-scale level, without deleting or re-scoring items.
We recommend the use of the interval transformation table provided in this study for neurological and musculoskeletal patients for national rehabilitation quality monitoring, in order to be able to calculate interval-scaled patient change scores for the FIM™, compared with its original ordinal scoring system (6). If the total scores are available in a digital format, as in the ANQ datasets, transformation can be implemented easily in an electronic information system, by simply re-coding the total scores according to the table provided in the results. This interval scoring system has the advantage that it provides an important basis for the application of a standardized reporting system for functioning information (2, 41) in which the FIM™ could be integrated as a widely used instrument in rehabilitation. This is beneficial, as the standardized reporting of functioning information enables clinicians to continue using currently implemented assessment tools while also being able to compare and aggregate the information within and across tools, institutions or even countries. One caveat to this is that the interval-scale transformation is actually measured with error, as can be seen in its logit form in Appendix S41.
In conclusion, the results of this study support the internal construct validity of the FIM™ 18-item version and, consequently, the reporting of its total score, by applying the interval-scaled transformation table provided in this study. The fact that all the variance could be accommodated in the final estimate suggests that previous reports of multidimensionality may have been driven by a breach of the local independence assumption. This supports the intention of its developers and the way the FIM™ scores are used in clinical practice and in institutional and national monitoring. It is recommended to use the interval-scale transformation of the FIM™ total score for national quality monitoring for neurological and musculoskeletal patients, in order to adequately report change scores in patients’ functioning. Furthermore, interval transformation provides a basis for integrating the FIM™ into a standardized reporting system for functioning information.
The authors thank Dr L. Menzi, Head of Rehabilitation ANQ, and K. Schmitt, Corporate Development Director of the Swiss Paraplegic Centre, for their good advice, provision of valuable information and fruitful discussions about the project.
This project is part of the cumulative Dissertation of Roxanne Maritz, which is funded by the Swiss National Science Foundation´s National Research Programme “Smarter Health Care” (NRP 74) within the NRP74 StARS Project ”Enhancing continuous quality improvement and supported clinical decision making by standardized reporting of functioning.
The authors have no conflicts of interests to declare.


 Click to show fullsize
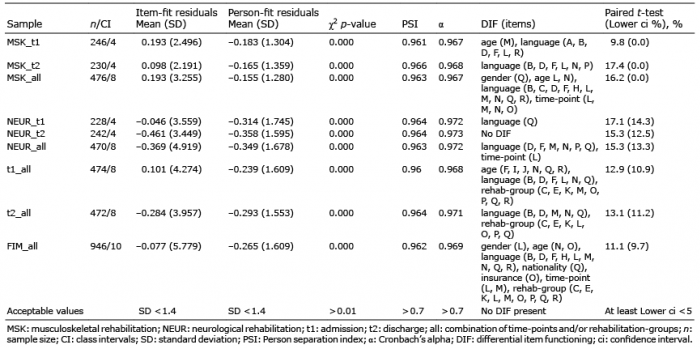 Click to show fullsize
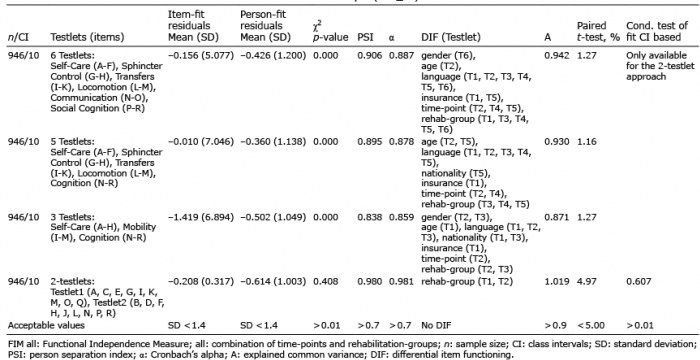 Click to show fullsize
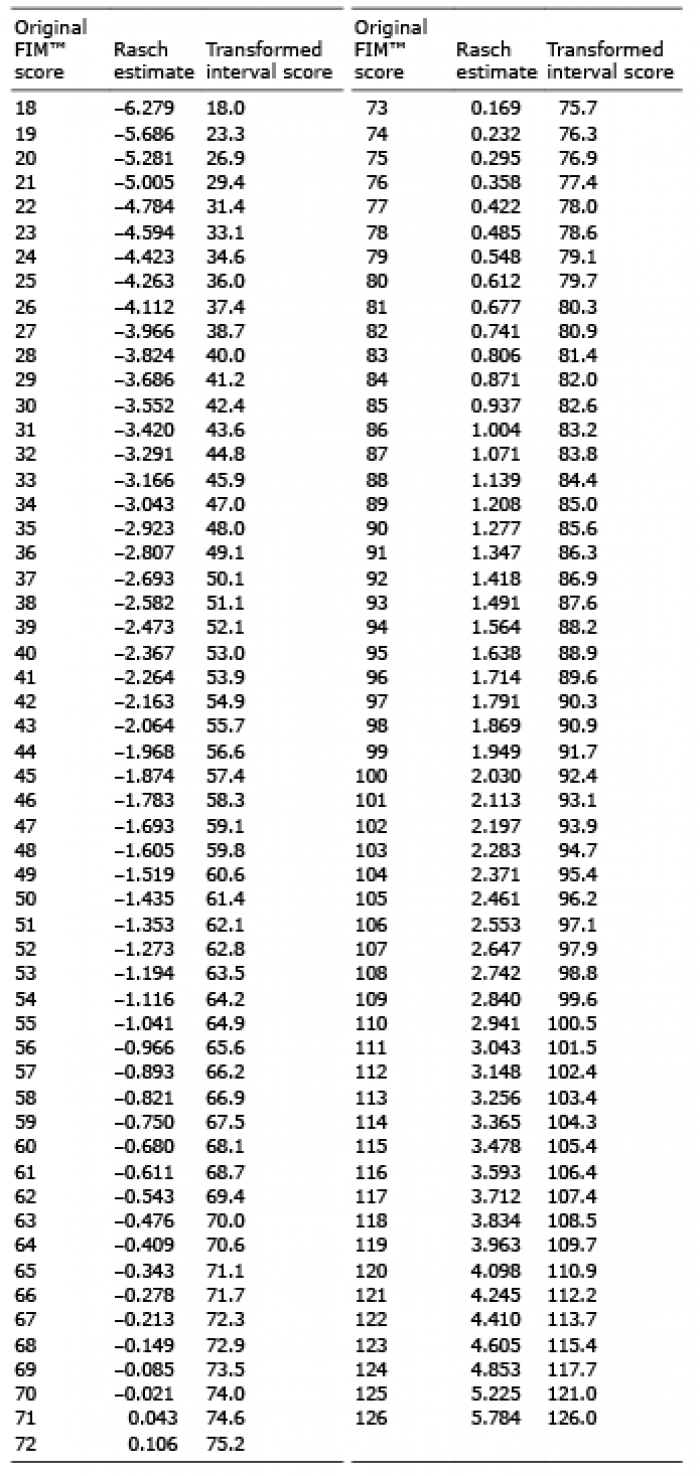 Click to show fullsize