
From the 1Department of Physical Medicine and Rehabilitation, Trondheim University Hospital, 2Department of Neuromedicine and Movement Science, Faculty of Medicine and Health Science, NTNU - Norwegian University of Science and Technology, 3Department of Health and Care Sciences, UiT The Arctic University of Norway, 4Department of Rehabilitation, University Hospital of North Norway, 5Department of Clinical Medicine, UiT The Arctic University of Norway, and 6Department of Public Health and Nursing, Faculty of Medicine and Health Science, NTNU - Norwegian University of Science and Technology, Trondheim, Norway
Objective: To assess recovery of grip strength during the first year post-stroke.
Design: Exploratory study on a subsample of patients participating in the Norwegian Constraint-Induced Movement Therapy trial.
Subjects: Eleven patients (mean age 59.1 years; 3 women) with mild to moderate stroke were recruited 7–29 days post-stroke.
Methods: An electronic dynamometer (Biometrics Ltd, Gwent, UK, 2006) was used to assess maximum grip force in 5 hand positions, rate of force development and sustainability of grip force. Similar assessments were performed to assess pinch strength. The participants were assessed 5 times during a 1-year period.
Results: Grip force in the affected hand increased in all handle positions during the 1-year follow-up, mostly during the first 6 months. At 2 and 4 weeks, rate of force development was less than half, and relative sustainability of grip force showed 20–30% greater deficit than for the non-affected hand. The affected hand approached the values of the non-affected hand after 6 months with little further progress until 1-year follow-up.
Conclusion: Grip strength in the affected hand improved considerably in the first year post-stroke. Patterns of improvement were similar across tests, i.e. rapid during the first weeks, slower until 6 months, and minimal 6–12 months post-stroke.
Key words: stroke; rehabilitation; hand strength; pinch strength; muscle fatigue.
Accepted Jan 28, 2019; Epub ahead of print Mar 8, 2019
J Rehabil Med 2019; 51: 00–00
Correspondence address: Roland Stock, Department of Physical Medicine and Rehabilitation, Trondheim University Hospital, Vådanveien 39, NO-7024 Trondheim, Norway. E-mail: roland.stock@stolav.no
Grip strength is often reduced after a stroke. This affects the ability to maintain grip strength over time and to increase force rapidly. Consequently, this also reduces the ability to cope with everyday activities. This study found that these aspects of grip strength were considerably reduced in the affected hand during the first weeks after stroke in patients with mild to moderate stroke. How-ever, the participants showed good progress during the first year after stroke. All aspects of grip strength improved considerably, especially during the first 6 months. To optimize the improvement in hand function, stroke rehabilitation should have a specific focus on all aspects of grip strength. For instance, practicing the ability to maintain a powerful grip while carrying a shopping bag or increasing force rapidly while squeezing an object.
Stroke often leads to muscle weakness and less effective and coordinated movements in the affected upper limb during activities of daily living (ADL) (1). Most improvements in overall motor function occur during the first year after the stroke, with less progress after 6 months and a fairly stable motor function from 12 months post-stroke (2).
Grip strength of both the whole palm and the fingers are important for upper limb function (3) and several studies have shown that grip strength is positively correlated with motor function and ADL performance (4, 5). However, few studies have measured grip strength with follow-up beyond 3 months (6, 7) and a detailed description of the long-term recovery of hand muscle function is currently lacking. Furthermore, it has been shown that the elbow flexor and extensor muscles in the affected arm in persons with stroke are relatively weaker in their shortened range (8); however, it is unclear if such selective weakness also applies to hand muscles.
In addition to a reduction in muscle strength, the force-time characteristics (i.e. rate of force development and sustainability of grip force) are altered in persons with stroke. Canning et al. (9) found that persons with stroke have reduced rate of force development capacity in the elbow flexor and extensor muscles compared with healthy controls. Similar results have been found for ankle plantar flexor muscles (10). However, little is known about rate of force development in the hand muscles in persons with stroke and how rate of force development evolves during the first year post-stroke. Furthermore, some studies indicate reduced sustainability of grip force in persons with stroke. Kamimura & Ikuta (11) assessed the decline in maximum sustained grip force as the percentage of maximum voluntary contraction (MVC) force, and found that the affected hand reached values less than 80% faster than the non-affected hand. However, there is limited knowledge about the recovery of sustainability of grip force during the first year after stroke.
The main aim of this observational study was to assess recovery of muscle function in hand and fingers during the first year post-stroke. The study assessed: (i) maximum grip force in different hand positions (wide to narrow grip) and different modalities of pinch force, (ii) rate of force development in hand grip and key pinch grip, and (iii) sustainability of hand and key pinch grip force. To assess recovery, the performance of the affected and non-affected sides was compared at inclusion into the study and at 4 different time-points during the 1-year follow-up period.
The participants in this longitudinal cohort study were a subsample of the Norwegian Constraint-Induced Therapy Multisite Trial (NORCIMT) (12, 13). NORCIMT is a multicentre, randomized controlled trial, investigating the effect of early vs late implementation of constraint-induced movement therapy (CIMT).
The inclusion criteria for the NORCIMT study were: more than 5 days and less than 26 days after stroke, persistent unilateral paresis (arm function 2–5 or hand motor function 2–4 on the Scandinavian Stroke Scale), ability to extend the wrist or 2 fingers, modified Rankin Scale (MRS) score 0–2 prior to stroke, a Mini-Mental State Examination (MMSE) score of more than 20, and the ability to follow a 2-step command and to sign informed consent. Exclusion criteria were: MRS post-stroke >4, hemispatial neglect (line bisection test more than 2 cm deviation), life expectancy less than 1 year, injury or other conditions affecting motor function. The North Norway Regional Committee of Medical Ethics and the Commission of Privacy Rights at the University Hospital of North Norway reviewed and approved the study (reference no. 39/2008).
The participants in the current study were recruited from the participants included at 1 of the centres (Trondheim University Hospital). Only maximum grip force in the affected hand was tested in the main study, in the current study additional detailed measurements of grip strength, rate of force development and sustainability of grip force of the affected and non-affected hand were performed. The current study was commenced slightly after the main study. The main study was an intervention study with no explicit focus on strength training; no differences between the groups were found in grip strength on the affected side (13). Level of impairment at 2 weeks was assessed by Fugl-Meyer Assessment and National Institutes of Health Stroke Scale, functional independence by modified Rankin Scale. The participants were assessed 5 times: at inclusion (2) and after 4, 28, 30 and 54 weeks after stroke; hereafter referred to as W2, W4, W28, W30 and W54.
All participants were examined by the same non-blinded examiner at all 5 time-points. The outcome measures were detailed isometric measurements of grip strength including MVC in 5 different hand and finger positions and force-time curves. Maximum force during grip strength measurements and force ratios (affected/non-affected hand) can be used to reliably examine strength impairments in patients with chronic stroke (14). Excellent test-retest reliability for maximum grip force measurements has also been shown < 12 weeks post-stroke (15).
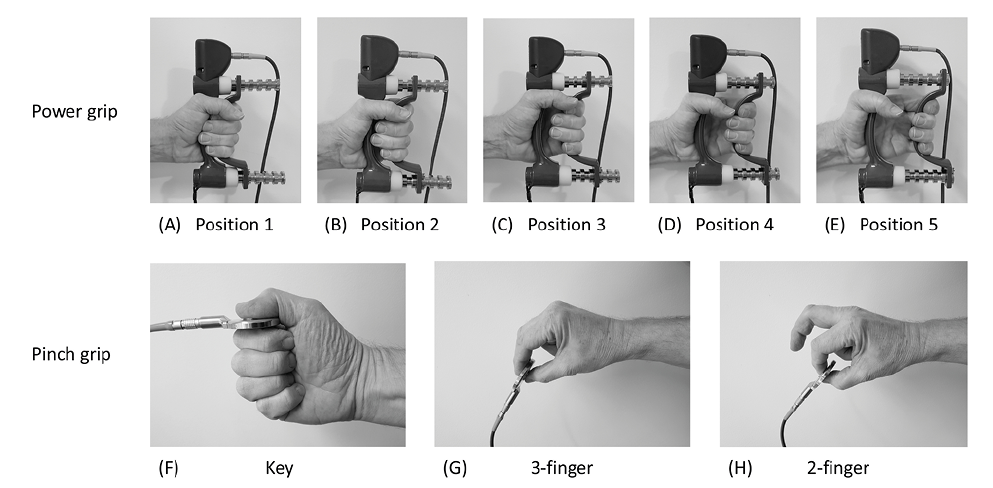
A Biometrics E-LINK EP9 evaluation system (Biometrics Ltd, Gwent, UK, 2006), with an electronic hand dynamometer (G100) and pinchmeter (P100) were used to assess grip strength. The dynamometer has 5 adjustable handle positions, ranging from narrow grip (position 1 – muscles are in a shortened range) to wide grip (position 5 – muscles are in a lengthened position) using power grip, as shown in Fig. 1 (A–E). Force-time curves were generated with a sampling frequency of 20 Hz. Allen & Barnett (16) demonstrated that the Biometrics electronic dynamometer is valid (intra-class correlation (ICC) 0.98–0.99) compared with the Jamar hydraulic dynamometer and has excellent test-retest reliability (ICC 0.98–0.99). The advantages of electronic dynamometers are the sensitivity to record low grip force and the possibility to assess force-time characteristics. Pinchmeters can be used to obtain a reliable assessment of pinch strength in stroke patients (17, 18).
All grip strength measurements were performed according to the recommendations of the American Society of Hand Therapists (ASHT) (19). The patients were seated with their shoulder in a neutral position, the elbow flexed to 90°, the wrist in a neutral position; the same chair was used for all measurements. The examiner explained and demonstrated the testing procedure. First, 2 trials with submaximal isometric contractions were performed to familiarize the participant with the equipment. Each MVC was performed 3 times in the 5 handle positions. The hands were tested alternately, with 30 s rest between the trials, i.e. 60 s rest before the same hand was tested again, as recommended by Watanabe et al. (20).
Pinchmeter recordings were performed in the same manner in 3 different grip positions (see Fig. 1, F–H): key grip (holding the pinchmeter between the lateral side of the 2nd phalanx of the index finger and the tip of the thumb), 3-finger grip (holding the pinchmeter between the fingertips of the index finger, middle finger and thumb) and 2-finger grip (between the fingertips of the index finger and thumb). If the patient was not able to hold the instrument in a stable position, it was placed and gently held by the examiner in the correct position. During actual testing, the participants were instructed to grip as hard as possible, and were encouraged verbally, as follows: “Harder...Harder...Relax” (21).
Fig 1. Overview of the 8 grips used: power grip was measured with a hand dynamometer in 5 positions from (A) narrow grip (position 1) to (E) wide grip (position 5). Pinch grip was measured with a pinchmeter with 3 grips: Key, 3-finger and 2-finger pinch.
A 0–0.5-s time interval was chosen to evaluate rate of force development (22). Sustainability of grip force can be measured in absolute values (23) or as the percentage or ratio of the momentary force value relative to maximum force (24, 25), which makes it possible to express how much the individual force curves drop during a given period. Both absolute and relative values are reported in the current study. The measurements of rate of force development and sustainability of grip force were performed once in both the affected and the non-affected hand with a hand dynamometer (position 2) and pinchmeter (key grip). The participants were instructed to increase grip force as fast as possible, followed by the instruction “hold as hard as you can” for 15 s.
Stata (StataCorp. 2017. Stata Statistical Software: Release 15. College Station, TX: StataCorp LLC) was used for the statistical analyses. Background variables were reported as mean (standard deviation (SD)) or median (range) when non-normally distributed. Differences between the affected and non-affected hand were analysed by independent t-test, or by the Mann˗Whitney U test when the data were non-normally distributed. The onset of the force-time curve was visually determined by 2 independent raters as the point where the curve starts to rise after stable baseline measurements. In case of disagreement on the onset point, the raters reached consensus through discussion. ICC (3,1) was used to determine the degree of agreement between the 2 raters. Last observation carried forward was applied where observations were missing in the non-affected hand. Normal distribution was assessed by visual inspection of quantile-quantile (Q-Q) plots. Due to multiple comparisons between the 2 hands during 5 time-points and 5 grip positions, the possibility for Type II error was high. p-values < 0.05 were therefore regarded as indicating a possible difference between the hands.
Of the 47 patients included in the NORCIMT study, 14 were recruited from Trondheim University Hospital. Of these, 11 participants had available data on maximum grip force, rate of force development and sustainability of grip force of the affected and non-affected hands. Table I presents the baseline characteristics of the 11 patients included in the study. The participants were middle-aged to elderly and mostly men. The Fugl-Meyer score for the upper extremity indicates that the patients had mild to moderate reduction in motor function. Disability (Modified Rankin Scale) ranged from slight disability to moderate disability.
Table I. Baseline characteristics of participants (n = 11)
One patient missed the follow-up assessments at W28, W30, and W54 for the non-affected side because of pain due to overload of the non-affected hand during walking with walking aids. More than 3 s was needed to reach maximum force during some recordings. As a result, 7% (15/214) of the sustained curve recordings were shorter than 12 s (mean 9.3 s (SD 2.1)). One patient had an additional minor stroke after 28 weeks, which did not result in a pronounced difference in grip strength parameters, except that the force curve dropped markedly faster during sustained grip on the non-affected side at W30, but not at W54. The assessment of the onset of the force-time curves by 2 independent raters showed excellent agreement: ICC (3,1) = 0.98.
Patients reached the highest maximum force values in hand grip position 2 for both the affected and non-affected hand (Fig. 2). Maximum force values were lower on the affected side in all positions at W2 and W4 (p ≤ 0.003 for all comparisons). However, maximum force values on the affected side increased steadily during the follow-up period and approached the values of the non-affected side at W28 and W30 and were no longer different at W54 (p = 0.09–0.25). At W2, the median grip force ratio (maximum force affected/maximum force non-affected hand) was least for position 1 (0.37, corresponding to 63% difference, Fig. 2A) and largest for position 5 (0.43, corresponding to 57% difference, Fig. 2E). At W54, the ratio between hands ranged from 0.74 to 0.80 for the various handgrip positions. There was no difference in grip force ratio between position 1 (narrow) and position 5 (wide) at any time-point (p ≥ 0.22 for all comparisons).
Fig 2. Recovery of maximum force of power grip during the first year after stroke. Maximum force was measured with a hand dynamometer in 5 positions from (A) narrow grip (position 1) to (E) wide grip (position 5) at 2, 4, 28, 30 and 54 weeks after stroke. Values are mean and error bars 95% confidence interval (95% CI). Note that the assessment intervals are upscaled to improve readability. Closed circles represent the non-affected side and open circles the affected side.
Fig. 3 shows the strength recovery of the key grip, 3-finger grip, and 2-finger grip during the 1-year follow-up. At W2, key grip maximum force was 45% lower in the affected hand compared with the non-affected hand (p < 0.001, Fig. 3A). Key grip maximum force remained essentially unchanged for the non-affected hand during follow-up, but increased steadily in the affected hand. At W54, maximum force was 14% lower in the affected hand compared with the non-affected hand, but the difference between hands was no longer significant (p = 0.25).
At W2, the maximum force for the 3-finger grip was 55% lower for the affected hand than the non-affected hand (p < 0.001, Fig. 3B). This difference decreased to 24% at W54, but the maximum force for the affected side remained lower than the maximum force for the non-affected side (p = 0.02). A similar pattern was observed for the recovery of 2-finger force. At W2, maximum force was 57% lower for the affected side compared with the non-affected side (p < 0.001, Fig. 3C). This difference decreased to 24% at W54, but maximum force remained lower on the affected side compared with the non-affected side (p = 0.01).
Fig 3. Recovery of maximum force in key grip (A), 3-finger grip (B) and 2-finger grip (C) during the first year after stroke. Maximum force was measured with a pinchmeter at 2, 4, 28, 30 and 54 weeks after stroke. Values are mean and error bars 95% confidence interval (95% CI). Note that the assessment intervals are upscaled to improve readability. Closed circles represent the non-affected side and open circles the affected side.
Fig. 4A shows the recovery of rate of force development in power grip MVC (position 2) during the 1-year follow-up period. At W2, rate of force development during the first 500 ms was 62% lower for the affected hand than for the non-affected hand (p = 0.001, Fig. 4A). Rate of force development during the first 500 ms in the affected hand increased during the first 6 months and there was no difference between the hands at W28 and W30 (p ≥ 0.19 for all comparisons). At W54, rate of force development was 21% lower for the affected hand than for the non-affected (p = 0.30).
The pinchmeter recordings for the 0–500 ms interval (Fig. 4B) showed a similar pattern, but a lower rate of force development compared with the dynamometer recordings. Rate of force development on the affected side was 46% of the non-affected side at W2 (p = 0.001) and 88% at W54 (p = 0.43). Most increase in rate of force development on the affected side occurred between W2 and W28.
Fig 4. Recovery of rate of force development for (A) dynamometer (position 2) and (B) pinchmeter (key grip) recordings during 0–500 ms during the first year after stroke. Rate of force development was measured at 2, 4, 28, 30 and 54 weeks after stroke. Values are mean and error bars 95% confidence interval (95% CI). The assessment intervals are upscaled to improve readability. Closed circles represent the non-affected side and open circles the affected side.
At W2, there was a similar decrease in the ability to maintain hand grip MVC during the 12-s sustained period when measured in absolute values (p = 0.68). However, when the force curve was normalized to % maximum force (e.g. expressed as % of initial force), the affected side decreased to 44% of maximum force during the 12-s interval at W2, while the non-affected side decreased only to 74% of maximum force (p < 0.001, Fig. 5A). At W54, the ability to sustain relative hand grip MVC was still lower on the affected side (p = 0.004).
Pinchmeter recording showed a similar pattern, with no difference in deficit between the affected and non-affected side when measured in absolute values at W2 (p = 0.22). Fig. 5B shows the normalized key pinchmeter values. At W2, the affected side decreased to 47% of the maximum force and the non-affected side to 67% (p = 0.009). At W54, the ability to sustain relative key grip MVC no longer differed between the affected and non-affected hand (p = 0.24). Furthermore, as Fig. 5A and 5B show, there was a marked drop in sustainability of grip force at W2 during the first 2–2.5 s on the affected side compared with the non-affected side. This drop decreased during the 1-year follow-up period, but was still visible at W54.
Fig 5. Recovery of sustainability of grip force during 12 s after maximum force for dynamometer (A) and key grip pinchmeter (B) during the first year after stroke. Sustainability of grip force was measured at 2, 4, 28, 30 and 54 weeks after stroke. Values are mean and error bars 95% confidence interval (95% CI). Sustainability of force is expressed as percentage of initial force at maximum voluntary contraction (MVC). Closed circles represent the non-affected side and open circles the affected side.
Table II shows the mean difference between affected and non-affected side for all outcome measures from W2 to W28 and W2 to W54. The difference in maximum grip force (power position 2) between the unaffected and affected sides was –85 N (95% CI –34 to –136) at 2 weeks compared with 28 weeks after stroke. The corresponding difference for rate of force development was –194 N/s (95% CI –93 to –295) while sustainability of grip force improved by 23% (95% CI 7˗39).
Table II. Mean (SD) grip strength of the non–affected and affected sides and mean (95% CI) difference between sides (n = 11 if not otherwise indicated)
This study examined the recovery of hand grip and pinch strength during the first year after stroke in patients with mild to moderate stroke. Maximum force in the affected hand increased most during the first 2 weeks, followed by quite stable improvement up to 1 year after stroke. Grip force was highest in position 2 (second most narrow grip) on the hand dynamometer for both the affected and non-affected hand. No significant differences between the hands were found with respect to position-dependent weakness. The ability to generate grip force rapidly was lower on the affected side at W2; however, this difference was no longer present at 6 months. At W2, the ability to sustain maximum grip force declined more rapidly on the affected side compared with the non-affected side (to 45% vs 75% of maximum force, respectively) during the 12-s sustained grip test. Notably, relative grip force on the affected side decreased markedly during the first 2–3 s of the sustained grip test, especially at W2 and at the 4-week follow-up measurement, indicating increased fatigability. However, the relative capacity to sustain maximum grip force approached the values of the non-affected side at 6 months post-stroke.
The recovery of grip strength in this study is generally comparable to the recovery curve described by Langhorne et al. (2), with most improvement in motor function occurring during the first 6 months after stroke. However, our study shows that hand grip force continued to improve between 6 and 12 months, while we observed less improvement for the 3 types of pinch grip force during this period. Maximum force and grip force ratios (maximum force affected/maximum force non-affected hand) were similar to other studies with stroke patients with mild to moderate impairment (6). Key grip force at W2 showed a higher force ratio, i.e. force on the affected side was relatively higher, compared with 3-finger grip and 2-finger grip. In addition, the difference in key grip force between the affected and non-affected hand at 1-year follow-up was less pronounced than for the 3-finger and 2-finger grip. A possible explanation for the better preserved key grip force might be that the key grip demands less dexterity and coordination between the fingers.
There are no comparable longitudinal studies on the recovery of hand grip force in different positions. In contrast to Ada et al. (8), we found no evidence of selective weakness in the affected compared with the non-affected side. It is possible that selective weakness may apply to patients with more severe impairment.
In general, measurements of rate of force development have lower reliability than measurements of MVC (26), and the highest variation in muscle force usually occurs during the initial 0.2–0.3 s period. Demura et al. (22) reported higher reliability for rate of force development, with time intervals from 500 ms up to 2,000 ms (ICC 0.77 and 0.93 respectively) compared with shorter intervals, as well as for peak rate of force development (ICC 0.67). Due to the high variation during shorter intervals and because longer intervals do not measure the ability to generate force quickly, we decided to use the 0–500 ms time interval in the current study.
Rate of force development was markedly decreased in the affected hand at W2, but approached the values of non-affected hand during the first 6 months post-stroke. We are not aware of any comparable study on rate of force development of grip strength. Canning et al. (9) found that stroke patients have a decreased rate of force development in elbow flexion and extension 6 weeks after stroke compared with healthy controls. This difference was no longer present at 25 weeks. In contrast, McCrea et al. (27) found that rate of force development in elbow and shoulder muscles is reduced several years post-stroke. Similar results have been reported for the lower limb (10). Interestingly, it has been demonstrated that stroke patients are able to move faster if they are asked to do so during a reach-grip-lift task with a 3-finger grip without decreasing movement quality (28). Thus, the instruction to move faster may be effective in increasing training intensity and facilitating faster functional recovery (28). Our results indicate that this may be of particular importance during the first 6 months after stroke.
These measurements of sustainability of grip force are comparable to the results reported by Kamimura & Ikuta (11). They showed that maximum force and the time until the momentary sustained grip force values dropped below 80% of maximum force were lower in the affected vs the non-affected hand. Maximum force and sustainability of grip force in the non-affected hand were not different from that of healthy controls. In particular, participants< 1 month post-stroke decreased to 80% of maximum force during less than 3 s. This is also shown by the initial marked drop in the sustained curve during the first 2–3 s in our study at W2 and W4. In contrast to the cross-sectional data of Kamimura & Ikuta (11), the longitudinal data in our study allow a description of the recovery of sustainability of grip force. In the current study, the drop in the sustained force curve in the affected hand was less marked after 6 months, indicating that loss of sustainability of grip force is most prominent during the first weeks after stroke.
Kamimura & Ikuta (11) also found a significant relationship between the sustainability of grip force and the ability to squeeze objects during ADL (wring a wet wash-cloth, open a jar, lift a container, wash the non-paretic arm). They concluded that both maximum force and the ability to sustain high grip force is essential in squeezing an object. The ability to sustain high grip force is important for many activities, such as carrying a suitcase or using tools. However, it is not clear if the sustained grip capacity can be modified by training and whether it could be successfully included in strength interventions.
A limitation of this study is the low sample size, which makes it difficult to draw firm conclusions and to analyse the effect of sex and age. Moreover, the findings are limited to patients with mild to moderate stroke. The patients already had reasonable grip strength when they entered the study; the profile of recovery might look different when stroke survivors with no grip strength had been included. Another potential limitation is missing values. One participant missed 3 assessments on the non-affected side. However, measurements on the non-affected side remained stable during the 1-year follow-up, and it seems unlikely that this has caused biased results. Furthermore, there are some missing values for the assessment of the sustained curve after 7 s, which might bias the results for the last part of the sustained curve. The last part of the sustained curve could also be biased, according to the findings by Kamimura & Ikuta (24), who showed that the first 6 s of the sustained curve are more reliable than the 10-s period. However, the force curves on the non-affected side seem to be similar during the 1-year follow-up, both for hand grip and key pinch force, indicating stable values, except for week 30, which showed a similar pattern, but slightly lower values. The latter may in part be explained by lower values by the patient who had a second minor stroke at 6 months. Despite these limitations, the longitudinal data combined with the detailed assessment of various aspects of grip strength provide new knowledge with possible relevance for clinical practice.
Our findings may have some clinical implications. Several meta-analyses and guidelines for stroke rehabilitation stress the importance of task-specific training (29, 30). Even if strength training is common in stroke rehabilitation, there seems to be little focus on practising grip strength that is functional in different hand positions or grip strength capacity related to rate of force development or sustained muscle activation. For example, high grip force in the narrow hand position is necessary for holding a knife while cutting hard vegetables, while, in contrast, opening a jar demands high grip force in the wide hand position. Furthermore, increasing grip force rapidly (e.g. hammering), and being able to maintain grip force over time are important during ADL (e.g. carrying a shopping bag, squeezing objects) and requires task-specific training. The results of our study indicate that training of grip strength should target different modalities and not only focus on improving maximum grip force.
In conclusion, grip strength in the affected hand increases steadily during the first year after stroke. The progress is most pronounced during the first 6 months and less between 6 and 12 months. Pinch force shows less progress during 6–12 months compared with hand grip force. No clear evidence was observed of selective weakness in the shortened range of the hand muscles. Rate of force development and the ability to sustain maximum grip force is reduced in the affected hand early after stroke, but approaches a level similar to the non-affected hand 6 months after stroke.
The authors would like to thank all the patients who participated in the study. The funding sources had no influence on the analysis.


 Click to show fullsize
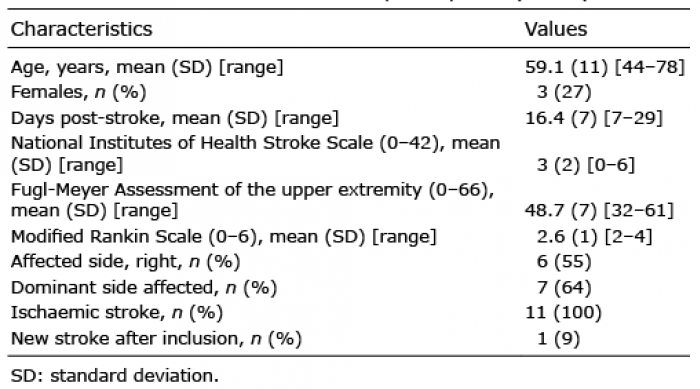 Click to show fullsize
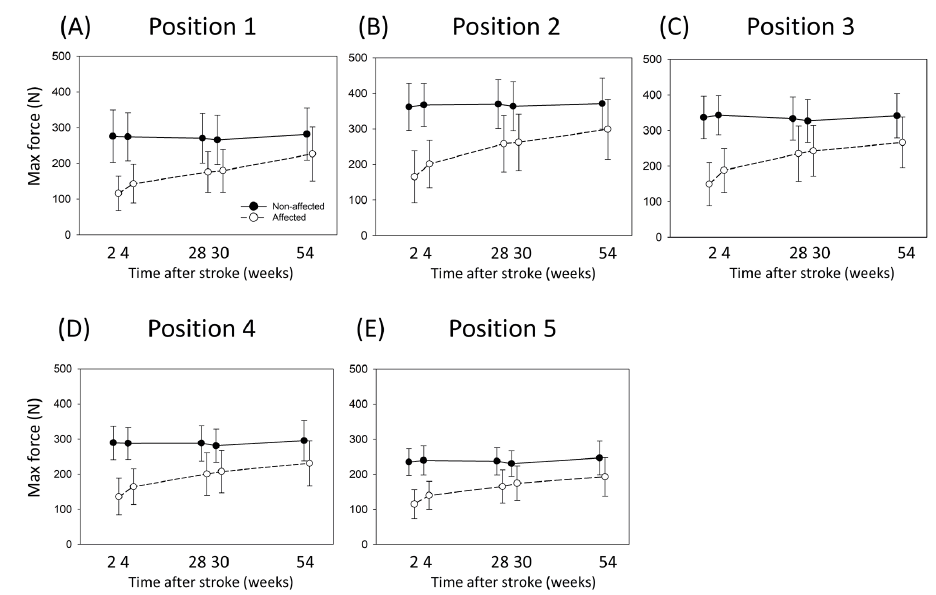 Click to show fullsize
 Click to show fullsize
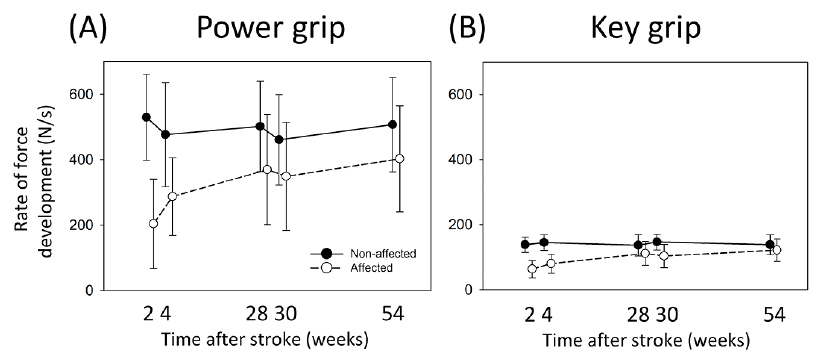 Click to show fullsize
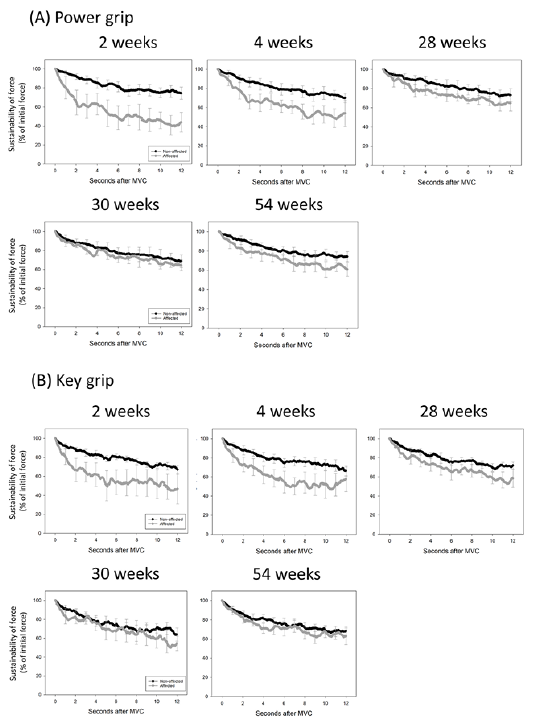 Click to show fullsize
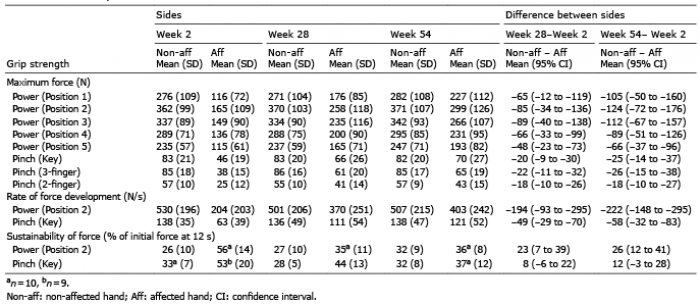 Click to show fullsize