
From the 1Division of Neuropediatrics, Department of Women’s and Children’s Health, Karolinska Institutet 2Department of Physiology and Pharmacology, Karolinska Institutet, Stockholm, 3Department of Rehabilitation, Jönköping University, Jönköping, 4Department of Orthopaedics Eksjö, Region Jönköping County and Department of Biomedical and Clinical Sciences, Linköping University, Linköping and 5Department of Learning, Informatics, Management and Ethics, Karolinska Institutet, Stockholm, Sweden
Objective: To investigate the potential of an acute bout of transcranial magnetic stimulation to induce anabolic signalling.
Design: Experimental intervention on healthy subjects.
Subjects: Ten healthy subjects, 5 women and 5 men (mean age 32 years; standard deviation (SD) 4). Methods: Transcranial magnetic stimulation, resulting in contraction of the quadriceps muscles, was applied at a frequency of 10 Hz for 10 s followed by 20 s of rest, repeated 40 times over 20 min. Electromyography and force data were collected for all transcranial magnetic stimulation sequences. Muscle biopsies were obtained from the vastus lateralis muscle before and 1 and 3 h after stimulation for evaluation of the molecular response of the muscle.
Results: The described stimulation decreased phosphorylation of AKT at Thr308 (1 h: –29%, 3 h: –38%; p < 0.05) and mTOR phosphorylation at Ser2448 (1 h: –10%; ns, 3 h: –21%; p < 0.05), both in the anabolic pathway. Phosphorylation of AMPK, ACC and ULK1 were not affected. c-MYC gene expression was unchanged following transcranial magnetic stimulation, but rDNA transcription decreased (1 h: –28%, 3 h: –19%; p < 0.05). PGC1α-ex1b mRNA increased (1 h: 2.3-fold, 3 h: 2.6-fold; p < 0.05), which also correlated with vastus lateralis electro-myography activity, while other PGC-1α variants were unchanged.
Conclusion: Acute transcranial magnetic stimulation of skeletal muscle in weight-bearing healthy individuals did not induce anabolic signalling, but some signs of impaired muscle anabolism were detected. Therefore, these results do not support the use of acute transcranial magnetic stimulation in prev-enting muscle wasting.
Key words: electromyography; skeletal muscle; transcranial magnetic stimulation; anabolic signalling; muscle wasting.
Accepted Jan 8, 2020; Epub ahead of print Jan 14, 2020
J Rehabil Med 2020; 52: jrm00022
Correspondence address: Ferdinand von Walden, Division of Neuropediatrics, Department of Women’s and Children’s Health, Karolinska Institutet, 171 77 Stockholm, Sweden. E-mail: ferdinand.von.walden@ki.se
Bed rest and limb immobilization promote rapid loss of muscle mass and function, which is evident within days of unloading. There are currently no efficient counter-measures. This study tested whether an acute bout of leg muscle contractions, induced by direct stimulation of the brain with a magnetic field (transcranial magnetic stimulation), could be used as a counter-measure to muscle wasting. However, contrary to our hypothesis, transcranial magnetic stimulation of skeletal muscle in weight-bearing healthy individuals did not induce anabolic signalling. Therefore, these results do not support the use of acute transcranial magnetic stimulation in preventing muscle wasting.
Diseases and injuries that affect the functioning of skeletal muscle lead to decreased weight-bearing and reduced levels of overall physical activity. Bed rest and limb immobilization promote rapid loss of muscle mass and function, which is evident within days of unloading (1, 2). Postural muscles have been shown to be more sensitive to unloading compared with non-weight-bearing muscles (3). Following a period of skeletal muscle deconditioning, rehabilitation is extremely important for recovery of function (4). However, regaining full muscle function can be both difficult and time-consuming (5) and atrophy prevention during immobilization is therefore preferable.
Several studies have shown that resistance exercise (RE) during unloading can counteract muscle atrophy and prevent deterioration of muscle function (1, 6). However, dynamic contractions are typically not possible in bed-bound and/or immobilized patients. Isometric contractions can partly counteract muscle loss, but has not been demonstrated to improve muscle function to the same extent (7, 8). Direct electrical stimulation has some effect, but less than volitional exercise (9). Stimulation directly over the muscle does not activate the entire neuromuscular pathway from the brain to the muscle; therefore, despite evidence of an effect on the muscle, the ability to activate the muscle might still be impaired. Transcranial magnetic stimulation (TMS) has been developed as a neurophysiological diagnostic method (10, 11) and is also used for treatment of depression (12). The motor cortex can be transcranially stimulated to generate skeletal muscle activity (13) and TMS has been used to study neuromuscular adaptations following both unloading (14) and skill training (11). Therefore, it could be speculated that TMS, although a different type of stimulus compared with real exercise, could be used to activate muscles during bed rest, immobilization, or in situations in which patients cannot move freely. In doing so, it may yield neural adaptations, and activate hypertrophic signalling in skeletal muscle.
RE training and rehabilitation results in increased muscle mass via repeated periods of augmented net protein synthesis. The AKT/mTOR/P70S6K pathway is considered to be of special importance to the development of muscle hypertrophy, as it represents a central signalling hub coordinating anabolic and catabolic processes (15). The rate of protein synthesis of skeletal muscle has been shown to be proportional to ribosome content (16), which increases following chronic mechanical overload (17). Furthermore, ribosome biogenesis has been shown to be rapidly induced by RE (18). In contrast, during periods of inactivity, denervation, or even healthy ageing, ribosome biogenesis is slowed down (19) and ribosome numbers decrease (20). Consequently, stimulation of anabolic signalling and ribosome biogenesis during muscle unloading might counteract skeletal muscle atrophy and loss of strength.
The molecular response of acute TMS-induced muscle activation has not been studied previously. The aim of this study was therefore to investigate the anabolic potential of an acute bout of TMS. We hypothesized that a single session of TMS would increase anabolic signalling and induce ribosome biogenesis in human skeletal muscle.
Subjects
Ten healthy subjects, 5 women and 5 men, were included in the study. Their mean age (standard deviation (SD)), height, and weight were 32 (SD 4) years, 177 (SD 8) cm, and 73 (SD 11) kg, respectively. All subjects gave written informed consent before participating. The study was approved by the Regional Ethical Review Board in Linköping, Sweden (ref. 2011/194-31, 2015/143-32, 2015/428-32), conformed to the principles of the Declaration of Helsinki and complied with Swedish law.
Testing procedure
In order to facilitate navigation, all subjects initially underwent a sagittal magnetic resonance imaging (MRI) scan of the brain with a slice thickness of 1.4 mm (Siemens Symphony Tim, Munich, Germany). At least 5 days prior to the intervention, the subjects were familiarized with the experimental set-up. All TMS interventions were performed in a seated position. In order to minimize movements of the head and trunk, the subjects wore a stiff cervical collar (Aspen Vista Cervical Collar, Aspen Medical Products, CA.), which was attached to the neck support of the chair. A belt was used to stabilize the pelvis. A TMS device (Magpro 30, Magventure A/S, Farum, Denmark) with an figure-of-eight shaped coil was used to stimulate the right quadriceps muscle; specifically, the vastus lateralis. The muscles were stimulated without voluntary contraction from the subject. TMS-induced activation was confirmed using surface electromyography (EMG; Delsys, Trigno, Boston, MA, USA). The location of the most optimal stimulation area was identified and saved using a navigating system (eXimia NBS, Nexstim, Helsinki, Finland) interfaced with the pre-existing MRI image using anatomical landmarks. EMG and force data during maximal voluntary contraction (MVC, performed with the knee at 60°; for reference we consider a straight leg 0°) for knee extension and flexion and EMG for MVC of ankle plantar and dorsiflexion were assessed and recorded. To obtain MVC data, each subject was requested to contract the muscle of interest as much as possible while resistance was applied either by the force transducer frame (quadriceps and hamstrings), or by one of the researchers (tibialis anterior and gastrocnemius). Each contraction was performed for a minimum of 3 s under verbal encouragement. Three repetitions were collected for each muscle with at least 1 min of rest in-between.
Subjects were instructed not to perform any strenuous physical activity 3 days prior to the experiment, not to exercise at all the day before, and to keep muscle use and movement to a minimum during the 12 h preceding the first biopsy. On the day of the intervention, all subjects were given a standardized breakfast 2 h before the first biopsy. A muscle biopsy was obtained at rest from the left vastus lateralis (VL) prior to TMS stimulation, proximal to the EMG electrode site.
Subjects were then seated in the position described above. The TMS transducer was placed over the skull using the pre-set coordinates for optimal stimulation of the right quadriceps muscle (specifically VL), determined during the familiarization phase. This area was stimulated at a frequency of 10 Hz for 10 s followed by 20 s of rest, repeated 20 times over 10 min. After 1 min of rest this procedure was repeated. EMG and force data were collected for all TMS stimulation sequences. Muscle biopsies were subsequently obtained from the right VL at 1 h and 3 h post-stimulation. The 3-h biopsy was taken proximally to the 1-h biopsy and separated by at least 2 cm in order to minimize interference.
EMG and force data collection and processing
Muscle activity during TMS was recorded using Qualisys Track Manager software (Qualisys, Gothenburg, Sweden) and Trigno wireless surface EMG sensors (Delsys, Trigno, Delsys Inc. MA). EMG electrodes were placed bilaterally over the vastus medialis (VM) and VL, rectus femoris (RF), biceps femoris (BF), tibialis anterior (TA) and gastrocnemius (Gn) muscles in the direction of the muscle fibres and according to SENIAM guidelines (21). Prior to placement of the electrodes, the skin over the relevant areas of the muscles was prepared by shaving and cleaning with an alcohol swab. To ensure consistency, the same investigator was responsible for placement of the EMG sensors during both familiarization and on the day of the intervention. During the familiarization session the location of each electrode was traced with a permanent marker on the skin. On the day of the intervention the electrode position was duplicated using these marks. Force data were collected from the right leg only using a triaxial force transducer (AMTI MC3-6-1000 Advanced Mechanical Technology Inc., Watertown, MA, USA) mounted on a custom-built rigid frame. Force signals were amplified using a 6-channel strain gauge amplifier (AMTI MSA-6 -gain settings 4K, Advanced Mechanical Technology Inc.). The transducer was mounted with the top plate perpendicular to the shaft of the tibia. The subject’s leg was strapped into place just proximal to the malleoli with the knee at 60°. Data from the transducer was synchronized with the EMG system. EMG signals were recorded at 2,000 Hz. All EMG data were full-wave rectified and filtered using a high-pass Butterworth filter with 20 Hz cut-off, rectified and then filtered using a low-pass, zero-phase lag Butterworth filter with a 500-Hz cut-off (22). A moving root mean square (RMS) filter was applied with a window size of 101 frames. Force data were filtered using a high-pass Butterworth filter with 20-Hz cut-off, and then low-pass zero-phase lag Butterworth filter with a 4-Hz cut-off. Force data were analysed to determine the maximum force in 3 planes (Z = flexion/extension, X = proximal/distal and Y = medial/lateral).
Force and EMG during MVC were determined by identifying the peak force of all 3 contractions and then calculating a mean value of a time epoch of 0.25 s surrounding the peak force. EMG was recorded for each 10-s TMS sequence and analysed independently. Contractions resulting from TMS stimulations were identified as peaks that exceeded 3 SD from baseline EMG. The magnitude of each peak was determined as the mean of a 50-ms window centred about each peak, and peak magnitudes were then averaged for each 10-s sequence. EMG data collected during TMS stimulations were normalized to EMG during MVCs. Mean force was calculated for each 10-s stimulation sequence.
Due to technical difficulties (loss of data registration) some 10-s stimulation sequences were not recorded; however, data from between 30 and 45 stimulation sequences were captured for all subjects. Data capture from the right gastrocnemius muscle of AI and the left rectus femoris of AG failed. In order to determine whether the magnitude of contractions was altered throughout the entire stimulation period, % MVC data were averaged for the first and last 5 sequences. Paired analysis revealed no significant differences in the magnitude of contractions and data were subsequently grouped for analysis.
Muscle biopsy procedure
The biopsies were obtained percutaneously using a Bergström biopsy needle with a diameter of 5 mm (Stille AB, Torshälla, Sweden) as described previously (23). All biopsy samples were frozen immediately in liquid nitrogen and stored at –80°C until further analysis.
Molecular muscle analysis
RNA extraction. Total RNA from the skeletal muscle biopsies was prepared from approximately 15 mg of tissue using an acid phenol method and quantified spectrophotometrically by measuring absorbance at 260 nm (NanoDrop 2000, Thermo Scientific, Gothenburg, Sweden). One microgram of total RNA was reverse transcribed according to the manufacturer’s instruction using the High Capacity Reverse Transcription Kit (Applied Biosystems, Foster City, CA, USA) in a total volume of 20 μl. Samples were stored at –80°C until further use.
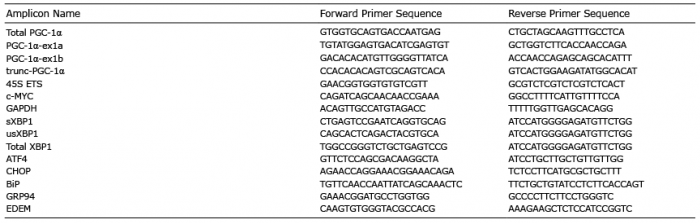
Real-Time qRT-PCR. Real-time qRT-PCR was used for mRNA quantification of PGC-1α (total PGC-1α and isoforms PGC-1α-ex1α, PGC-1α-ex1b and trunc-PGC-1α), 45S pre-rRNA and MYC. Glyceraldehyde-3-phosphate dehydrogenase (GADPH) was used as an endogenous control and proved stable across all time-points. When possible, primers were designed to cover exon-exon boundaries to avoid amplification of genomic DNA (Eurofins Genomics, Ebersberg, Germany; Table I). The total reaction volume was 10 μl, containing: 2 μl cDNA sample; primer forward (final concentration 0.3 μM); primer reverse (final concentration 0.3 μM); and SYBR Green PCR Master Mix (Applied Biosystems, Foster city, CA, USA.). All quantification reactions were controlled with a melting curve and primer efficiency was tested using standard curves. All reactions were performed in 384-well Hard-Shell PCR plates (Bio-Rad, Hercules, CA, USA), with sample duplicates, using the Bio-Rad CFX384 Real Time System, C100 Touch Thermal Cycler.
Protein extraction and Western blot. Muscle samples (approximately 20 mg) were homogenized in radioimmunoprecipitation assay buffer (RIPA) buffer (20 μl RIPA/mg tissue) containing: 150 mM NaCl; 10 mM Tris-HCl (pH 7.8); 5 mM EDTA (pH 7.4); 0.5% Na deoxycholate; 0.1% SDS, 1% Triton-X100; and 1 × complete protease inhibitor cocktail (Roche Diagnostics, Basel, Switzerland.), using glass homogenizers. The homogenate was rotated gently at 4°C for 60 min, followed by centrifugation at 4°C for 10 min (15,000 g). All chemicals were purchased from Sigma unless stated otherwise (Sigma-Aldrich, St Louis, MO, USA). Protein concentration was assessed with the detergent compatible (DC) protein assay (Bio-Rad) and lysates diluted (if needed) with lysis buffer before mixing 3:1 with 4 × Laemmli buffer (Bio-Rad) containing 10% beta-mercaptoethanol. All samples were heated at 95°C for 10 min, cooled on ice, and stored at –20°C until further use. Skeletal muscle homogenates (20 μg protein/sample) were separated by electrophoreses on 4–15% SDS-PAGE gels (Bio-Rad) and proteins were then blotted onto polyvinylidene difluoride (PVDF) membranes (Millipore, Billerica, MA, USA). The membranes were blocked for 1 h at room temperature in blocking reagent (Millipore) and then incubated with primary antibodies for AKT (1:1000, no. 4691), phospho (PO4)-AKT Thr308 (1:1000, no. 2965), mTOR (1:1000, no. 2983), PO4-mTOR Ser2448 (1:1000, no. 5536), AMPK (1:1000, no. 2532), PO4-AMPK Thr172 (1:1000, no. 2531), acetyl-coA carboxylase (ACC) (1:1000, no. 3662), PO4-ACC Ser79 (1:1000, no. 3661), ULK1 (1:1000, no. 8054), PO4-ULK1 ser757 (1:1000, no. 14202); all from Cell Signaling (Beverly, MA, USA). All primary antibodies were diluted in blocking reagent: ddH2O (1:1) and incubated overnight at 4°C. After washing with PBS-T (0.1% Tween 20), membranes were incubated for 30 min at room temperature with IRDye secondary antibody (1:20000, LI-COR Biosciences, Cambridge, UK). Membranes were scanned using an Odyssey SA Infrared Imaging System (LI-COR Biosciences), and quantified using ImageStudio (LI-COR Biosciences).
Proteasome activity assay. Muscle samples were lysed in lysis buffer (50 mMTris-HCl, 5 mM MgCl2, 250 mM sucrose, 1mM Dithiothreitol (DTT), pH 7.5). Lysates were centrifuged at 12,000 g to pellet insoluble material. Supernatants were collected and protein concentrations assessed with the DC Protein Assay (Bio-Rad). Samples were diluted with lysis buffer to 100 μg/ml concentration, giving 5 µg per reaction in 50 µl. For each sample, 50 µl was loaded in triplicate on a 96-well assay plate together with 2 × concentrated (200 μM) Suc-Leu-Leu-Val-Tyr-AMC. (Enzo Lifesciences, Farmingdale, New York). Plates were read using a fluorescence plate reader (BMG Labtech, FLUOstar Optima, Offenburg, Germany) under the following conditions; 37°C, 60 cycles, 10 flash/well and 60 s interval. Proteasome activity was calculated per well by normalizing to background fluorescence per subject (no fluorogenic substrate) and then calculated by assessing the slope of the curve between cycles 5 and 55 (24).
Table I. Primer list
Statistical analyses
Data were analysed using statistical software Statistica (Stat-soft, Tulsa, OK, USA). As data were not normally distributed for most parameters and sphericity was significantly different, non-parametric methods were used. Friedman analysis of variance (ANOVA) was used to detect differences over time and, if significant, Wilcoxon matched pairs test was used to detect where differences occurred. For graphical presentation, the data were adjusted for baseline (PRE) by calculating the relative change. All statistical tests were performed on the original data. Statistical significance was set at p < 0.05.
EMG and force data
During TMS, the mean magnitude of quadriceps EMG was 17% of the magnitude during MVC measured at pre-test (SD: 17, range: 1–50%; Fig. 1). The antagonist BF and the lower leg muscles were stimulated to a similar extent. The mean EMG magnitude for VL was 13% of MVC (range 0.8–41%). The total number of peaks recorded for each participant during TMS stimulations followed a similar pattern with respect to muscle specificity (Table II). Side specificity was very high, with the left, non-stimulated, leg registering a minimal number of contractions compared with the stimulated right leg. Force output during knee extension was very low (Table III).
Fig. 1. Right-side mean electromyography (EMG) magnitude expressed as a percentage of maximal voluntary contraction (MVC). In this figure, peak contractions have been averaged for each participant across all recorded transcranial magnetic stimulation (TMS) sequences (see further details in Methods section). Data are presented for each subject and for the mean value across subjects. VL: vastus lateralis; RF: rectus femoris; VM: vastus medialis; BF: biceps femoris (BF); Gn: gastrocnemius; TA: tibialis anterior; Quad: quadriceps femoris.
Table II. Total number of peaks recorded in electromyography (EMG) data
Table III. Maximal force produced during maximal voluntary contraction (MVC) and transcranial electric stimulation (TMS)
Molecular muscle data
Exercise-related signalling and gene expression following TMS. The described stimulation decreased phosphorylation of AKT at Thr308 post-TMS (mean change at 1 h: –29%; p = 0.059 and at 3 h: –38%; p < 0.05, Fig. 2A) and mTOR phosphorylation at Ser2448 post-TMS (1 h: –10%; ns and at 3 h: –21%; p < 0.05, Fig. 2B). To further assess the effects of TMS two well-established RE response genes were chosen, MYC and 45S pre-rRNA. MYC mRNA was unchanged post-TMS (Fig. 2C) and the abundance of 45S pre-rRNA was reduced at the 1-h time-point post-TMS (1 h: –28%; p < 0.05, 3 h: –19%; ns, Fig. 2D), in line with the observed decreased phosphorylation status of the anabolic AKT/mTOR pathway.
Fig. 2. (A–B) Representative Western blots and quantifications of PO4/total ratio of AKT (A) and mTOR (B) PRE, 1- and 3-h post-transcranial magnetic stimulation (post-TMS). (C–D) Relative gene expression of (C) c-Myc and (D) pre-rRNA at PRE, 1- and 3-h post-TMS. (n = 10 for all graphs). *Significantly different from PRE. Gene expression of target genes related to expression of glyceraldehyde 3-phosphate dehydrogenase.
Acute endurance exercise typically increases phosphorylation of the AMPK pathway and promotes the expression of PGC-1a and its splice variants. Following TMS, we did not observe any significant changes in phosphorylation status of the AMPK pathway (Figs 3A–B). However, a significant increase in the expression of PGC1α-ex1b was observed post-TMS (1 h: 134%, 3 h: 157 %; p < 0.05; Fig. 3C). This increase at 1 h post-TMS correlated (p < 0.05) with the degree of activation of the quadriceps muscle (r =0.75; Fig. 4), but not at 3 h post-TMS. Other PGC-1α variants investigated were unchanged post-TMS (Fig. 3C).
Fig. 3. (A–B) Representative Western blots and quantifications of PO4/total ratio of (A) AMPK and (B) ACC PRE, 1- and 3-h post-transcranial magnetic stimulation (post-TMS). (C) Relative gene expression of total PGC1a and isoforms (PGC1a-ex1a, PGC1α-ex1b, PGC1α-trunc) at PRE, 1- and 3-h post-TMS. (n = 10 for all graphs). *Significantly different from PRE. Gene expression of target genes related to expression of glyceraldehyde 3-phosphate dehydrogenase (GADPH).
Fig. 4. Correlation between increase in PGC1α ex1b to 1 h and relative activation of vastus lateralis (VL) muscle, r= 0.75.
Skeletal muscle proteolytic activity following TMS. Reduced phosphorylation status of the AKT/mTOR pathway and lower abundance of the 45S pre-rRNA transcript prompted us to further investigate the effect of TMS on processes of importance for skeletal muscle protein homeostasis. The phosphorylation status of ULK1 (Fig. 5A) and the proteolytic activity of the 26S proteasome (Fig. 5B) following TMS were unchanged over time. Gene expression markers of endoplasmatic reticulum (ER)-stress were also unchanged (Fig. 6).
Fig. 5. (A) Representative Western blot and quantification of PO4/total ratio of ULK1 at PRE, 1- and 3-h post-transcranial magnetic stimulation (post-TMS) (n = 10). (B) Proteolytic activity of the 26S proteasome at PRE, 1- and 3-h post-TMS (n = 9).
Fig. 6. mRNA levels of genes involved in endoplasmic reticulum stress at PRE, 1- and 3-h post-transcranial magnetic stimulation (post-TMS) (n = 10). Gene expression of target genes related to expression of glyceraldehyde 3-phosphate dehydrogenase (GADPH).
the quadriceps femoris muscle for stimulation, EMG, and especially peak forces, were generally low. Stimulating muscles of the lower limb with TMS can be difficult, as the somatotopic organization of the motor cortex results in a smaller specific area suitable for stimulation for muscles of the thigh compared with, for example, hand muscles (25). This was exemplified by a relatively high degree of activation of both antagonists at the level of the knee joint (BF) and in the lower leg (TA, Gn) in addition to the intended quadriceps muscle. In contrast, stimulation accuracy with respect to right/left leg was very high with the left, non-stimulated, side registering several hundred-fold fewer contractions compared with the stimulated right leg. Some subjects (AC, AD and AG) registered comparably more contractions of muscles on the left side compared with the other subjects. For one of these subjects, this could be due to the need for a higher level of stimulation, which was required to reach adequate activation of the right quadriceps. This would probably have resulted in a larger area of the motor cortex being affected by the magnetic field, including the left side. The other 2 research subjects who experienced comparatively more muscle contractions on the left side had a lower degree of stimulation. For these subjects it was reasoned that the somatotopic organization of the motor cortex might been slightly different. An alternative explanation for muscle contractions on the left side may be due to varying degrees of ipsilateral descending corticospinal pathways among the subjects. Indeed, TMS has been used previously to demonstrate ipsilateral motor-evoked potentials in muscles of the upper limb of healthy humans (26). Furthermore, 2 other factors of importance for muscle activation, as measured by EMG amplitude, are the firing frequency of individual motor units and the synchronization of motor units (27). Both of these factors will probably be lower with TMS compared with maximal voluntary actions. In addition to muscle activation, force production relies on the coordination of muscles acting around the same joint. In the current study, EMG data indicates that co-contraction was common and might, to a large extent, explain the observed low force output. However, from a theoretical point of view, the data are interesting as they uncouple excitation and activation from mechanical stress of the muscle and clearly support the need for proper loading of the muscle for an anabolic response.
Contrary to our hypothesis, TMS stimulation did not activate anabolic signalling pathways, but rather decreased the phosphorylation status of the AKT/mTOR pathway and reduced RNA polymerase (POL) I transcription rates. In contrast, direct electrical stimulation of the muscle has been shown to result in activation of the mTOR/S6K1 pathway and to increase ribosome content in rodent muscle (28, 29). However, these studies utilized a training-like situation with repeated bouts of electrical stimulation over several weeks, compared with the acute stimulation used in the current study. The rate-limiting step of ribosome biogenesis is thought to be an mTOR pathway mediated increase in POL I transcription of the ribosomal (r)DNA genes, resulting in synthesis of the 45S pre-rRNA strand. Ribosome biogenesis is elevated at 4 h post-RE in human skeletal muscle (18) and precedes the development of skeletal muscle hypertrophy in a rodent model of RE (30). It has been suggested that, following mechanical loading, increased transcriptional activity of POL I is necessary for the hypertrophic phenotype to develop. In vitro experiments on muscle cells in culture support this theory, as specific inhibition of POL I transcription prevents myotube hypertrophy following serum stimulation (31). Therefore, we interpret the observed acute reduction in POL I activity following TMS as reduced anabolism, or as an effect of signalling events yet to be defined. Thus, our data do not support the use of TMS as a counter-measure to muscle wasting. An alternative view is that contractile activity, irrespective of absolute load, acutely suppresses rDNA transcription. This interpretation is supported by a recently presented timeline for RNA POL I transcriptional activity in response to acute exercise, suggesting an immediate decrease in the abundance of 45S pre-rRNA during exercise, and that a return to baseline levels may be delayed until 3–4 h post-exercise (32). Thus, it could be hypothesized that our timeline was not long enough to capture positive changes in the levels of 45S pre-rRNA.
The effect of TMS on processes involved in muscle protein homeostasis appeared to be limited to anabolic events, as no changes were observed in the degree of phosphorylation of the autophagy-related protein ULK1 or in proteasome activity. In an effort to elucidate the underlying cause of impaired anabolism following TMS, we investigated mRNA levels of genes involved in endoplasmic reticulum (ER) stress. TMS results in a high number of low-force contractions and concomitant EMG peaks over a short period of time. Thus, the protocol is, despite low force output, not that different from high-frequency electrical stimulation, which has been shown to result in cell membrane damage leading to elevated calcium influx (33). Similarly, exhaustive endurance exercise activates ER stress in mice (34) and human skeletal muscle (35). However, none of the ER-stress marker genes investigated in this study were altered, which does not support a role for ER-stress in the impaired AKT/mTOR signalling and POL I transcription observed following TMS.
Given the high frequency yet low intensity nature of the TMS stimulation, we reasoned that the effect on the muscle might be more similar to endurance than resistance exercise. Thus, the AMPK pathway has traditionally been linked to endurance exercise. Following a bout of endurance exercise, the AMPK pathway has been shown to activate downstream factors, such as PGC-1α (36). In the present study, no significant changes in phosphorylation of AMPK or its downstream target ACC could be detected. However, AMPK has been observed to be activated mainly at exercise intensities of approximately 60% VO2 peak (37–39), a level of exertion that our TMS protocol most likely did not reach. We also studied the effect of PGC-1α, a well-known and important factor for the molecular response to endurance type training in skeletal muscle. One of the recently discovered isoforms of PGC-1α has been shown to be transcribed from an alternative promotor (PGC-1α-ex1b), and suggested to be the most exercise- and stress responsive isoform (36, 40, 41). Contrary to c-Myc and rDNA transcription rates, PGC1α -ex1b mRNA abundance increased significantly following TMS stimulation. However, this increase was substantially lower than that seen following any form of exercise at higher intensities. Furthermore, mRNA levels of PGC1α -ex1b at 1-h post-stimulation correlated with the degree of activation of the VL muscle (EMG). This could be interpreted as a weak, but significant, endurance exercise-like effect of TMS on skeletal muscle; an effect that would probably increase if stimulation accuracy could be improved and/or the stimulation repeated. Although no substantial acute effects on skeletal muscle were observed in the current study, it is possible that repeated TMS over time promotes positive central nervous system effects on neural recruitment and activation. This could potentially prevent reduced neuromuscular drive following prolonged muscle unloading. In the present study, healthy subjects (who had not been exposed to unloading prior to the investigation) were used. It can be speculated that a more robust muscle response would have been present if the TMS intervention had been performed on deteriorated muscles that had been subjected to bed rest or unloading prior to the study. It can also be hypothesized that a higher degree of stimulation might have yielded a greater response. However, a higher level of stimulation could be more inconvenient for the patient and might ultimately lead to lower compliance with the protocol.
The current study has several limitations. First, the study was designed without a resting (non-TMS) control group for comparison. We reasoned that, in this initial study, the main aim was to evaluate whether any training-like effects could be seen in skeletal muscle following TMS-stimulation. As no such effects were seen, except a negligible increase in one marker compared with effects observed in the literature following acute bouts of exercise, we believe that we can conclude, without a control group, that TMS is not an effective counter-measure for muscle wasting. Secondly, in order to minimize the number of biopsies needed, the 3 biopsies were obtained using an alternating leg approach. This resulted in 1 leg being biopsied once, whereas the other leg was biopsied twice, and thus different legs were compared during the time course. Differences in gene expression between the right and left quadriceps muscles have been investigated and proven to be small and probably not biologically important (23). All subjects ate a standardized breakfast prior to the first biopsy. As a consequence, we cannot disregard the potential influence of an initial nutrient effect on anabolic signalling and gene expression, which probably decreased from PRE to the 1-h and 3-h time-points.
In conclusion, signs of impaired muscle anabolism were observed up to 3 h after an acute bout of TMS, specifically involving the AKT/mTOR pathway and ribosome biogenesis. Abundance of PGC1a-ex1b mRNA increased slightly following acute TMS and correlated with the degree of activation of the VL muscle recorded using EMG. We interpret this as a mild exercise-like effect of TMS on skeletal muscle, an effect that might prove relevant in a muscle not subjected to any weight-bearing activity. However, TMS of skeletal muscle in weight-bearing healthy individuals did not induce anabolic signalling. Therefore, these results do not support the use of acute transcranial magnetic stimulation in preventing muscle wasting.
The authors would like to thank the subjects for their extraordinary effort and participation. We would also like to thank Charlotte Schönbeck for her valuable technical and laboratory assistance. We further greatly acknowledge the help provided by staff at Höglandssjukhuset Eksjö; Sonny Isaksson, Vagn Liest and Robin Kihlbaum at the Department of Psychiatry for their help with the TMS equipment, Henrietta Ståhlbrandt, Merima Persson and Annika Sander at the Department of Radiology for their help with MRI, Sonja Dahlberg and colleagues at Department of Laboratory Medicine for their help with biopsy storage, the staff from the Department of Medical Technology and the General Technical Department for their support with the equipment and the great support from personnel at the Orthopaedic Department.
This work was supported by Futurum – the Academy for Health and Care, Region Jönköping County, Sweden and the Swedish Society of Medicine.


 Click to show fullsize
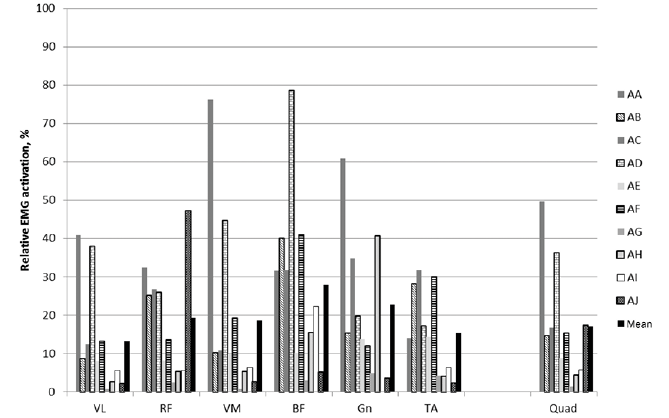 Click to show fullsize
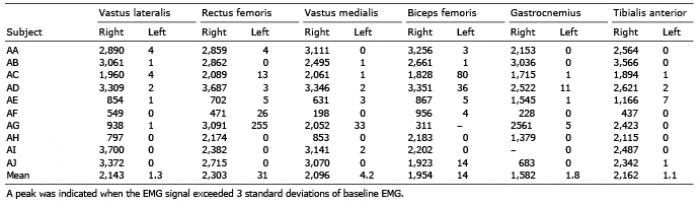 Click to show fullsize
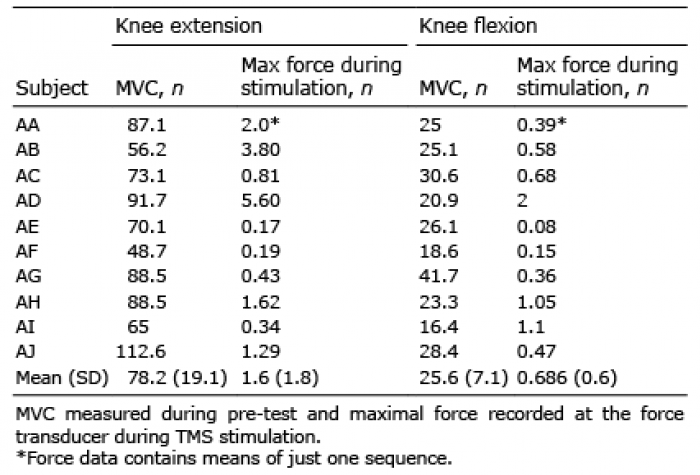 Click to show fullsize
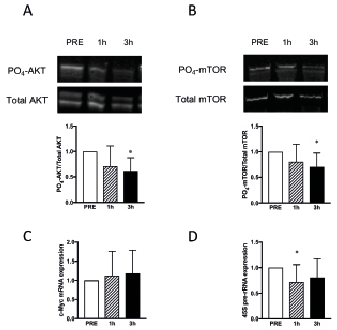 Click to show fullsize
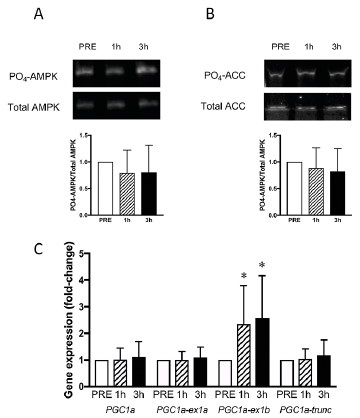 Click to show fullsize
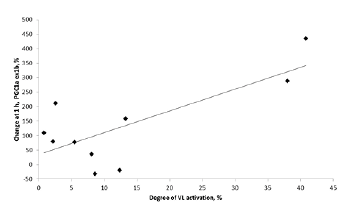 Click to show fullsize
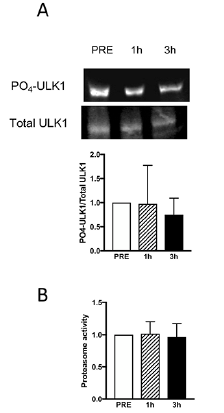 Click to show fullsize
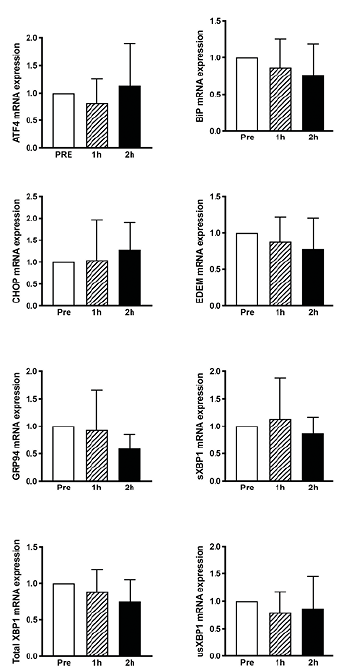 Click to show fullsize