
From the 1Centre intégré universitaire de santé et de services sociaux (CIUSSS) de la Capitale-Nationale (Institut de réadaptation en déficience physique de Québec), 2Centre interdisciplinaire de recherche en réadaptation et intégration sociale et 3Departement de réadaptation, Université Laval, Québec, Québec, Canada
Objective: To evaluate the effects of introducing the practice of targeting a discharge date for patients admitted to an inpatient stroke rehabilitation unit on process and patient outcomes.
Design: Comparison of retrospective (control group n = 69) and prospective (experimental group n = 60) patients.
Methods: Rehabilitation professionals assessed both groups at admission and discharge using a standard-ized assessment toolkit. Benchmarks for length of rehabilitation stay (LoRS) were introduced based on median severity-specific LoRSs in the control group. The multidisciplinary team documented facilitators and obstacles affecting the prediction of patient benchmark attainment. Categorical variables were compared using a χ2 test with exact probabilities. Ordinal and continuous variables were analysed using rank-based non-parametric analysis of variance. Effect sizes were estimated using a relative treatment effect statistic.
Results: The mean combined length of stay in acute care and rehabilitation beds for the experimental group (82 days) was shorter (p = 0.0084) than that of the control group (103 days). This 21-day reduction in combined length of stay included a 10-day reduction in the mean time between stroke onset and admission to the stroke rehabilitation unit (p = 0.000014). Improvements in 6 func-tional and sensorimotor outcomes with rehabilitation were of similar magnitude in both groups, while Functional Independence Measure (FIMTM) efficiency improved (p = 0.022). The team was 87% successful in predicting which patients were discharged on the LoRS benchmark.
Conclusion: Benchmarking the length of stay in rehabilitation resulted in reduced bed occupation and system costs without adversely affecting functional and sensorimotor patient outcomes.
Key words: stroke; inpatient rehabilitation; quality improvement; length of stay; benchmarking.
Accepted Sep 3, 2020; Epub ahead of print Oct 1, 2020
J Rehabil Med 2020; 52: jrm00113
Correspondence address: Dr Carol L. Richards, Center for Interdisciplinary Research in Rehabilitation and Social Integration (CIRRIS), Institut de réadaptation en déficience physique de Québec (CIUSSS-de la Capitale-Nationale), 525 Boul. Wilfrid-Hamel Est, Québec (QC) G1M 2S8, Canada. E-mail: Carol.Richards@fmed.ulaval.ca
Doi: 10.2340/16501977-2746
This study aimed to determine the effects on length of stay and functional recovery of introducing the practice of targeting a date for discharge when patients are admitted to inpatient rehabilitation in the stroke unit. Data for patients who had already completed their rehabilitation were analysed for severity-related target length of stays or benchmarks. In a second group of patients these benchmarks were used to estimate discharge date targets at admission. Both groups received their rehabilitation from the professionals in our stroke unit who assessed their characteristics and functional recovery at the beginning and end of their rehabilitation stay for comparison. Benchmarking was associated with an 11-day mean reduction in length of stay in rehabil-itation and a 10-day mean reduction in the time between stroke onset and admission to rehabil-itation, resulting in fewer bed occupation days (a mean reduction from 103 to 82 days). Functional recovery of the benchmarked group was similar to that of the comparative group. The results show that benchmarking at admission to inpatient rehabilitation was associated with reduced bed occupation and system costs without adversely affecting patient recovery.
Stroke is the second leading cause of death worldwide and the third leading cause of disability (1). In 2013 in Canada, an estimated 405,000 individuals had a stroke; a prevalence of 1.15% (2). More than half of these individuals are not independent in activities of daily living (3). Based on a mean annual first year cost of CAD 74,353 in resource utilization for patients with ischaemic stroke and 38,000 stroke admissions, the burden of ischaemic stroke in Canada is estimated to be CAD 2.8 billion with the mean annual cost of a disabling stroke (modified Rankin score (MRS) 3–5) being 2-fold greater than that of a non-disabling stroke (MRS 0–2) (4). The costs of healthcare in hospitals and inpatient rehabilitation settings are closely linked to patient lengths of stay (5); one-day reduction in the mean length of stay in post-stroke inpatient rehabilitation (LoRS) has been calculated to save the Province of Ontario’s healthcare system CAD 2 million annually (5, 6).
Despite Canadian recommendations (7, 8) to use LoRS benchmarks, only Meyer et al. (9) have reported the results of a benchmarking strategy. They showed that the implementation of a severity-specific benchmarking strategy resulted in shorter LoRSs without compromising patients’ functional gains or the rate of discharge to the community. Based on Meyer et al.’s report (9) the team of rehabilitation professionals in our stroke rehabilitation unit (SRU), when tasked by the Institute administrators with reducing the LoRS of patients, decided to introduce a benchmarking strategy. The recent participation of this rehabilitation team in the creation of a multi-centre clinical research platform, which included the development and implementation of a standardized assessment toolkit (SAT) and associated clinical database (10–12), provided the infrastructure for their engagement in this quality improvement project.
The main objective of the quality improvement project was to introduce the practice of setting a discharge target date (DTD) for inpatients admitted to the SRU and to determine the effect of this on process and patient outcomes. Specific objectives were: (i) to establish severity-specific LoRS benchmarks; (ii) to evaluate the impact of implementing these LoRS benchmarks on process variables and patient functional and sensorimotor outcomes; (iii) to engage rehabilitation professionals in documenting factors (facilitators or obstacles) that influence discharge from inpatient rehabilitation, and on the basis of these factors to predict whether a patient will meet the DTD.
Design
This study compared 2 patient cohorts: a retrospective (control; CTL) group, and a prospective (experimental; EXP) group, who received post-stroke inpatient rehabilitation in our SRU. Ethics approval was granted by the Institutional Research Ethics Committee of the Centre intégré universitaire de santé et de services sociaux (CIUSSS) de la Capitale-Nationale (Institut de réadaptation en déficience physique de Québec (project 2011-258).
Subjects
The CTL group (n = 69) comprised patients admitted to the SRU between 25 February 2013 and 20 January 2014. The EXP group (n = 60) comprised patients admitted between 2 February 2015 and 7 December 2015. All patients ≥ 18 years of age with a confirmed ischaemic or haemorrhagic stroke were eligible for inclusion. Exclusion criteria were: other neurological conditions (spinal lesions, cerebral palsy, Parkinson’s disease, cerebral tumours, traumatic brain injury, intoxication); musculoskeletal disorders (severe arthritis or osteoarthritis, amputations); pre-existing intellectual, visual or auditory impairments not related to the stroke, but likely to affect the rehabilitation potential; presence of cancer requiring active treatment; or re-admittance of patients admitted in the CTL group.
Patient assessments
Both groups of patients were assessed by the SRU professionals (5 occupational therapists, 5 physical therapists, 2.1 neuropsychologists, 3 speech and language pathologists, 2 nurses, and 2 physicians (in equivalent full-time positions)). The SAT (11) protocol required administration of the FIMTM instrument in the first 72 h following admission to the SRU, when possible, and the other assessments within the first week. Discharge assessments were made in the last week of planned interventions.
The following data were extracted from the clinical database: (i) patient variables (age, sex, side of lesion, living situation) and process (onset of stroke to inpatient rehabilitation admission, time between referral and admission to inpatient rehabilitation, LoRS); (ii) assessment of cognitive function on the Montreal Cognitive Assessment (MoCA) (13) and depression on the Hospital Anxiety and Depression Scale (HADS (14); results of the FIMTM (15), Berg Balance Scale (BBS) (16), Chedoke-McMaster Stroke Assessment-Activity Inventory (CMSA-AI) (17), Chedoke Arm and Hand Activity Inventory-V9 (CAHAI-V9) (18), 10-meter walk test (10mWT) (19) and 6-minute walk test (6MWT) (20), to document the recovery of functional independence and sensorimotor function.
Process outcomes for the acute and inpatient rehabilitation phases were selected to determine the effects of the benchmarking project (time from onset of stroke to admission to inpatient rehabilitation, time from referral to admission to inpatient rehabilitation, LoRS, combined length of bed occupation: length of stay (LOS) in hospital plus LoRS). Patient outcomes were: 6 functional independence and sensorimotor measures (FIMTM, BBS, CMSA-AI, CAHAI-V9, 10mWT and 6MWT), FIMTM gain and FIMTM efficiency. The outcome measures for objective (iii), described above, were the percentage of patients predicted to meet the DTD by the professionals who did meet the DTD, and facilitators and obstacles raised by the rehabilitation professionals related to these predictions.
Establishing severity-specific length of rehabilitation stay benchmarks
LoRS benchmarks for the EXP group were derived from stroke severity-specific LoRSs measured in the CTL group. First, for the CTL group the total FIMTM scores at admission were divided into 4 severity subgroups, based on Ween et al.’s (21) classification of stroke severity (1: FIMTM score ≥ 100; 2: FIMTM score 80–99; 3: FIMTM score 60–79; 4: FIMTM score < 60). Median LoRS values for the patients in each subgroup were: 30, 46, 77 and 94 days, respectively. These median LoRS values were then used as reference values to establish the benchmark LoRS or DTD of patients in the EXP group. Based on the patient’s FIMTM total score at admission, the SRU coordinator assigned each individual to a reference severity subgroup. Finally, the DTD was included on the weekly list of patients and communicated to all SRU personnel.
Documenting factors perceived by rehabilitation professionals to influence attainment of the discharge target date
A form was developed to capture pre-determined personal and environmental factors (facilitators and obstacles) put forward by the rehabilitation professionals in multidisciplinary team meetings to support their predictions of whether a patient would be discharged on the DTD. A committee that included the clinical coordinators, a research therapist, the SRU manager, and a researcher specialized in stroke rehabilitation, developed the form, which was pre-tested for a 2-week period and modified based on the professionals’ suggestions for improvement.
A patient’s likelihood of meeting the DTD was first discussed in light of the usual SRU discharge criteria (aims of the personalized treatment plan are achieved; interventions no longer improve the patient’s ability to carry out life habits; a recovery plateau has been reached; after receiving relevant information the patient wishes to end rehabilitation; the patient lacks motivation or the collaboration needed to meet the objectives of the treatment plan; the patient’s new or residual needs are not in line with the aim of the rehabilitation programme; or the patient’s physical or mental health is an obstacle to rehabilitation). The coordinator then used the form to capture information on 4 types of discharge predictions (1: patient ready for discharge from inpatient rehabilitation to home on the DTD; 2: patient ready for discharge home from inpatient rehabilitation on the DTD, but with a referral to outpatient rehabilitation; 3: patient who lives with another person who is not ready for discharge on the DTD; 4: patient who lives alone who is not ready for discharge on the DTD). Personal or environmental factors (facilitators and obstacles) evoked by the professionals to influence their predictions were noted. Predictions of meeting the DTD were made in multidisciplinary team meetings convened to discuss the patient’s individualized treatment plans. Since the LoRS of patients with FIMTM scores of 80 or higher were relatively short, predictions were made 2 weeks after admission for these patients, and for patients with FIMTM scores < 80, predictions were made in the last team meeting before the DTD.
Rehabilitation therapy
Patients in both groups received the usual therapy provided by the SRU rehabilitation team. The team included occupational therapists, physiotherapists, neuropsychologists, speech language pathologists, nutritionists, physicians (physiatrists and general practitioners), social workers, a kinesiologist, special care counsellors, a physical rehabilitation technician, rehabilitation assistants and nursing staff. As reported previously (10), the SRU provides an organized approach to rehabilitation that includes the patient and family members, caregivers, or both, in setting rehabilitation goals. The occupational and physical therapists promoted sensorimotor recovery (10) by having patients practice novel tasks and strengthening exercises for the upper extremities, and balance, walking tasks, and strengthening exercises and transfer of skill training for the lower extremities, in accordance with the Canadian stroke rehabilitation practice guidelines (7, 10). The patients underwent endurance testing by a kinesiologist supervised by a cardiologist, followed by fitness training supervised by a kinesiologist. Mood and cognition were evaluated by neuropsychologists, who then provided therapy as needed. The social workers tended to the patients’ psychosocial needs. Physicians monitored the patient’s medical condition, and speech language pathologists and nutritionists provided therapy when indicated. On the ward, nurses worked on integrating rehabilitated skills into activities of daily living, while a rehabilitation technician and the nursing staff helped the patients practice their skills on the ward on weekday evenings, and nursing staff on weekend evenings, to augment therapy time (10). Although the SRU manager and a research therapist met regularly with the clinical staff to promote adherence to Canadian stroke rehabilitation practice guidelines and maintenance of the clinical database, the usual rotation of staff may have contributed to some variations in therapy between the 2 groups of patients.
Statistical analysis
Since the data for the CTL group (n = 69) were acquired at least one year before the data for the EXP group (n = 60), a first step was to check whether both groups were similar with regard to 8 patient characteristics at admission (Table I). Process variables (Tables II and III) and changes in patient outcome variables were also compared (Tables II and III). Patients in the EXP group who were discharged on or before the DTD date (n = 36) were then compared with those who were not discharged by the DTD (n = 24) (Table IV). Finally, the EXP group stroke severity subgroups were compared (Table V and Fig. 1).
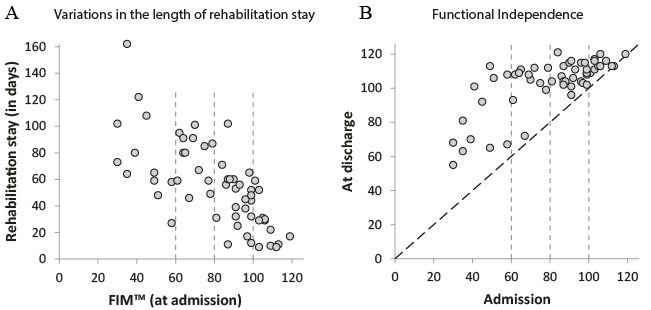
Fig. 1. Variations in the length of rehabilitation stay and improvements in Functional Independence (FIMTM) scores with rehabilitation among the four stroke severity subgroups of the Experimental group. In A: LoRS in days (y-axis) in relation to the FIMTM total score at admission (x-axis). In B: changes in the total FIMTM score between admission (x-axis) and discharge from inpatient rehabilitation (y-axis). In both A and B, stroke severity subgroups indicated by vertical interrupted lines on the x-axis.
Table I. Comparison of patient characteristics in control and experimental groups at admission
Categorical variables were analysed using a χ² test with exact probabilities. Continuous and ordinal variables were analysed using rank-based non-parametric analysis of variance (ANOVAs). R (versions 3.6.3)’s nparLD package (version 2.1, 2012-09-18) was used with repeated measures. Otherwise, the rankFD package (version 0.0.5, 2020-01-28) was used in the absence of repeated measures. In contrast to ordinary least-square ANOVAs, which segment a total sum of squares, rank-based ANOVAs segment the probability of “being larger than”. Thus rank-based ANOVAs are especially suited for ordinal scales and interval scales when the equality between intervals is not certain. Rank-based algorithms are also especially robust with regards to outliers (22, 23). The rankFD and nparLD packages work in the case of missing data, without the need to exclude participants or to impute missing values. The procedures make no assumptions about distribution. The shape of distributions may change between conditions, which eases the homogeneity of variance and sphericity assumptions and does not require that impacts are strictly limited to a change in location (22, 23). Effect sizes were estimated using a relative treatment effect (RTE) statistic, the value of which is proportional to Cohen’s d when data are normally distributed (see pp. 24 and 30 in (22)). This value varies between zero and 1, with 0.5 as the H0 null value. RTE is the same as the A12 statistic of Vargha & Delaney (24), who proposed (see Table I on p. 106 in (23)) that the effect size boundaries for small, medium and large effects should be 0.56, 0.64 and 0.71, respectively, when above the H0 null value, and 0.44, 0.36, 0.29, respectively, or the mirror value, when below the H0 null value. These procedures are explained in full in Brunner et al. (22) for rankFD and Brunner et al. (23) for nparLD.
Table II. Comparison between process variables in control and experimental groups
At admission, no between-group differences were found for all 8 patient characteristics (see Table I). For age and MoCA scores, p-values were not significant and all RTEs were close to 0.5, the H0 null value. The time between onset of stroke and referral by the acute hospital was the same for both groups (p = 0.88; Table II). However, the time between referral and admission to inpatient rehabilitation was different between groups (p = 0.0000000000000014). Patients in the EXP group were admitted, a mean of, 8.8 days earlier than the CTL group. The RTE value of 0.32 for the EXP group is considered a medium-to-large effect size. For a given effect, the mean RTE was 0.5. Consequently, the RTE for the CTL group is a mirror value compared with the H0 null value with the same effect size. Since, in the EXP group, the time between referral and admission to inpatient rehabilitation is shorter, the time between onset of stroke and admission to inpatient rehabilitation is also shorter (p = 0.000014) than in the CTL group. The LoRS was the same in both groups (p = 0.13), but there was an overall reduction of 21 days (p = 0.0084) in the EXP group when combined with the hospital length of stay (LOS). With an RTE value of 0.43 for the EXP group, the effect size is considered small, but the 21-day reduction in time of bed occupation is of clinical importance. Overall, there was no increase in FIMTM gain in the EXP group (p = 0.10); however, due to the shorter time until admission to inpatient rehabilitation, or the reduction in combined LOS and LoRS in this group, FIMTM efficiency was better for the EXP group (p = 0.022).
Changes in 6 performance variables between admission and discharge (Table III) were measured. No significant group effect was found, with the exception of a p-value close to the alpha criterion (p = 0.050) for the 10mWT. This confirms the equivalence of both groups at admission. At discharge both groups (time effect) showed significant gains in FIMTM, CMSA-AI and BBS scores and walked faster in the 10mWT. The following pooled group values, which estimate the common changes between admission and discharge, are not shown in Table III. At discharge, gains in FIMTM, CMSA-AI and BBS scores were 20.6, 18.5 and 14.0, respectively, and 0.19 m/s in the 10mWT. No significant group x time interaction was found, indicating that application of a DTD had neither a negative nor a positive impact on these outcomes.
Table III. Assessment results at admission and discharge of patients in control and experimental groups
At discharge from inpatient rehabilitation 36/60 (60%) EXP group patients had met their DTD (Table IV). The EXP group of patients who met their DTD were 7 years older (p = 0.02), were admitted 4.8 days earlier to inpatient rehabilitation after stroke onset (p = 0.023), had a 44-day shorter LoRS (p = 0.00000000025), a 15-point higher CMSA-AI score (p = 0.016), and walked 0.25 m/s faster in the 10mWT (p = 0.0048). P-values for the MoCA (0.09), FIMTM (0.066) and BBS (0.052) were also close to the alpha criterion of 0.05.
Table V, comparing selected variables among the 4 severity subgroups of the EXP group, shows significant differences in the LoRS (p = 0.00000011) and FIMTM gain (p = 0.000000054) among the groups. Post-hoc analyses revealed that the LoRSs were longer and FIMTM gains greater in the 2 more severely affected subgroups (C and D) compared with subgroups A and B, while in subgroup A, the least severely affected group, the LoRS was shorter and the FIMTM gain smaller than in the 3 other subgroups. Importantly, these smaller FIMTM gains in the least severely affected stroke severity subgroup were not due to a ceiling effect (Fig. 1B). In addition, longer LoRSs (Fig. 1A) and greater FIMTM gains (Fig. 1B) were observed when the initial FIMTM score at inpatient admission was below 80. The FIMTM admission score was not influenced by age (p = 0.64) or by length of time between stroke onset and admission to inpatient rehabilitation (p = 0.12).
It is notable that the rehabilitation professionals were 87% (52/60) correct in predicting whether the patients would be discharged by the DTD determined by the severity-specific benchmarking strategy. The 32 (32/52; 62%) patients correctly predicted to meet the DTD were discharged, a mean (±1 standard deviation) of 19±4 days (median 18 days, min–max 1–67 days) before the target date. For 8 of these (8/32; 25%) predicted to be discharged without referral for outpatient rehabilitation, facilitators raised by the professionals to support their predictions were related to attainment of discharge criteria such as: achievement of the treatment plan; plateaus in sensorimotor recovery and life habits. For those predicted to be discharged with a referral for outpatient rehabilitation (24/32; 75%) the facilitators were: medical support and nursing support no longer needed; appropriate physical endurance; adequate cognitive function for home safety; accessible and safe home; and patient lives with a person who is capable and willing to provide assistance.
The 20 (20/52; 38%) patients correctly predicted to be unable to meet the DTD were discharged, a mean (±1 standard deviation) of 21±16 days (median 16 days; min–max 6–68 days) after the DTD. For these patients, major obstacles for those who lived with another person (n = 9) included: caregiver is not willing or unable to provide the needed home care; caregiver unable to provide physical assistance with hygiene; caregiver unable to provide physical assistance with transfers and mobility. For those who lived alone (n = 11), the obstacles were: patient cannot live alone due to cognitive and physical disabilities (n = 11/11); not independent in meal preparation, grocery shopping, mobility, transportation, budget management, personal hygiene; and the home not accessible for the patient’s level of disability.
Table IV. Characteristics, process variables and assessment scores of patients in experimental group (n = 60) who met or did not meet the discharge target date (DTD)
Table V. Selected process and patient outcome variables in stroke severity subgroups of the experimental group
The rehabilitation professionals were incorrect in their predictions in 13% (8/60) of patients. Of these, 4 patients who were predicted to be unable to meet the DTD did, in fact, attain it. Three of these lived with another person, while the fourth lived alone. The 4 other patients who were predicted to attain the DTD, did not. Of these, 2 lived with another person and 2 lived alone. It is notable that medical complications were not raised as an obstacle for any of the 60 patients.
The main finding of this quality improvement project is that introducing the practice of setting a DTD for patients admitted to the SRU resulted in a mean reduction of 21 days in the combined length of acute care and inpatient rehabilitation bed occupation. The 10-day mean reduction in acute bed occupation (time from stroke onset to admission to rehabilitation) was associated with a shorter time (mean 8.8 days) between referral from acute care to admission to inpatient rehabilitation. Among the series of time periods from stroke onset to inpatient rehabilitation documented in this project, the only period under the responsibility of the acute care team alone was the time between stroke onset and referral to inpatient rehabilitation. This time, 20.75 and 19.50 days for the CTL and EXP groups, respectively, was similar in both groups, despite implementation of the provincial acute care stroke strategy that recommended shorter stays in acute care (25) while this project was ongoing. For the EXP group, the significantly shorter time between referral and admission to the SRU may be due to a faster turnover of rehabilitation beds, such that referred patients could be admitted more rapidly even though the 11-day reduction in the EXP group LoRS was not significant (p = 0.13).
Importantly, the 21-day reduction in total bed occupation time did not adversely affect functional independence or sensorimotor patient outcomes in the EXP group (Table III). Furthermore, the trend of a larger gain in mean FIMTM (p = 0.10) in the EXP group compared with the CTL group may be related to the earlier initiation of intensive rehabilitation, although the role of early spontaneous recovery is unknown (7, 26). Combined with the tendency to reduced LoRS (p = 0.13) in this group, a higher (p = 0.022) FIMTM efficiency was generated. By comparing the results in the 4 EXP severity subgroups it was shown that higher FIMTM gains and longer LoRSs were associated with FIMTM scores at admission to the SRU of < 80. Conversely, those with FIMTM scores of 80 or higher at admission underwent smaller FIMTM gains and shorter LoRSs.
The 21-day mean reduction (from 103 to 82 days) in combined bed occupation days also contributed to a reduction in the cost of post-stroke rehabilitation, considering the costs of hospital and rehabilitation institute combined. The carry-over effect of perform-ing this study probably resulted in further long-term reductions in costs.
The rehabilitation professionals had a notable capacity to predict whether patients would meet the DTD determined by the severity-specific benchmarks. These predictions, based on their analyses of factors other than the level of sensorimotor recovery, were accurate 87% of the time. These results confirm that a number of patient-related and environmental factors have a role in determining the LoRS (27, 28). A large Canadian study involving 11,983 patients admitted to rehabilitation hospitals in 2008 and 2009 (28), found that age, geographical region, and FIMTM Motor scores at admission explained 20% of the variation in LoRSs, indicating that factors other than an individual’s medical, functional and demographic characteristics play an important role in determining the LoRS, as shown in this study. Such analyses provide information on the multiple personal and environmental factors that impact on the discharge date. The facilitators or obstacles noted in this study do not provide information on individual patients, but rather give an overview of the types of factors other than functional recovery that play a role when deciding that a patient is ready for discharge. These factors, whether present or not in individual patients, also help explain the large variation in patient LoRSs for those discharged earlier or later than the proposed DTD.
Key factors affecting whether a patient meets the DTD are the availability of a caregiver who is capable and willing to assist the person recovering from a stroke once discharged, and the accessibility of their home. These 2 factors support the need for living arrange-ments (temporary or permanent) that provide the necessary accessibility and personal care, or of services that provide caregiver assistance in the home. For patients who live alone, factors raised as obstacles were: cognitive or physical disabilities; a home not accessible for the patient’s level of disability; and lack of independence in meal preparation, grocery shopping, mobility, transportation and budget management. This suggests that assessment of instrumental ADLs, for example with the Functional Autonomy Measurement System (29), would be of use in discharge planning.
It was possible to perform this quality improvement project because of the engagement of all members of the SRU rehabilitation team who were empowered by the project. As suggested by Meyer et al. (9), a methodology was chosen that aimed at reducing the LoRS, without setting goals that would be perceived as too difficult to attain. First, given the relatively small sample size, total FIMTM scores were used to divide the reference patients (CTL group) into 4 subgroups instead of the 7 Rehabilitation Patient Groups based on admission motor and cognitive FIMTM scores and age in Ontario studies (8, 9). Next, it was decided that it was unrealistic to set LoRS benchmarks aimed at achieving a FIMTM efficiency of 1.0 or even 0.75, with no reduction in mean FIMTM gain (9). To encourage the participation of rehabilitation staff, a median LoRS of each comparative subgroup was chosen as a target that should be relatively easy to attain, without considering FIMTM efficiency. This strategy is used in Australia, where post-stroke patients are classified using the Australian National Sub-Acute and Non-Acute (AN-SNAP) patient classification (30) and LOS benchmarks are set with the aim of discharging 50% of patients in each AN-SNAP group before the DTD. Such a strategy promotes a shorter stay that takes into account stroke severity without applying undue stress on rehabilitation professionals to aim for a DTD related to efficiency targets.
The finding that 32/52 (61.5%) of patients in the EXP group correctly classified by the SRU professionals as apt to meet the stroke severity benchmark were ready for discharge at, or a median of 18 days before, the DTD, indicates that the benchmark LoRS could have been shorter. Conversely, those (20/52; 38.5%) patients classified as unlikely to meet the benchmark DTD, surpassed the benchmark LoRS by a median of 16 days, suggesting the need for a longer LoRS. Even though the LoRS benchmarks for the 4 disability levels in this study were not optimal, there was, nevertheless, a mean, although not significant, reduction of 11 days in the LoRS, and a significant 21-day reduction in combined acute and inpatient rehabilitation bed occupation, which supports our benchmarking strategy. Moreover, the 11-day reduction in LoRS (from 66 to 55 days) in the current study is greater than the 5.9-day reduction (from 41.2 to 35.3 days) reported by Meyer et al. (9). In addition, the mean LoRS of 37 (median 32) days for the patients in the current study who met the DTD (Table IV) is shorter than the mean 41- day (median 35 days) LoRS reported for patients in Canada (n = 11,983) who received inpatient rehabilitation in 2008 and 2009 (29), and close to the mean 35.3 days (median 30 days) achieved by Meyer et al. (9).
Study limitations
This pragmatic quality improvement project has some limitations. The sample size is relatively small and may explain, at least in part the lack of significant reductions in LoRS and FIMTM gain, and limited statistical analysis of the effects of the benchmarking strategy in the 4 severity subgroups. Although a research therapist and the SRU manager informed and monitored the rehabilitation professionals, there may have been changes in the patient evaluations and therapy due to staff turnover, since the CTL cohort was admitted mainly in 2013 and the EXP cohort in 2015. Discharge predictions may have been influenced by the fact that the rehabilitation professionals made the predictions at different stages of the rehabilitation process for patients with admission FIMTM scores ≥ 80 compared with those with scores < 80. Furthermore, no in-depth analyses were made of costs or of the facilitators and obstacles influencing discharge decisions. Finally, although this study showed promising results for a “personalized” benchmarking strategy in the SRU, further work is required to optimize the strategy.
Conclusion
The introduction of the practice of setting a DTD, which encouraged the participation of the rehabilitation team, and discussing the factors (facilitators and obstacles) affecting the likelihood of patients meeting the DTDs during team meetings, had positive results. The benchmarking strategy resulted in a 21-day mean reduction in length of combined acute hospital and SRU bed occupation, and consequent reductions in the costs. In addition, the SRU team acquired a better understanding of the personal and environmental factors that affect the DTD by attempting to predict which patients would be discharged on the DTD. Importantly, 6 patient functional and sensorimotor outcomes were not adversely affected by the reduction in combined acute and rehabilitation bed days. In fact, one can argue that the reduction in time from stroke onset to initiation of intensive rehabilitation was beneficial to patients, and combined with the non-significant 11-day reduction in LoRS, led to an improved FIMTM efficiency. The results of this study of a “personalized” benchmarking strategy may encourage other SRUs to develop their own benchmarking strategies.
This project was financially supported by the Canadian Institutes of Health Research Sensorimotor Rehabilitation Research Team grant, and grants from the Centre interdisciplinaire de recherche en réadaptation et intégration sociale (CIRRIS) and the Institut de réadaptation en déficience physique (IRDPQ) now integrated into the Centre intégré universitaire de santé et de services sociaux (CIUSSS) de la Capitale-Nationale.
This quality improvement project could not have been performed without the participation of the professionals in the rehabilitation stroke unit of the CIUSSS-Capitale-Nationale.


 Click to show fullsize
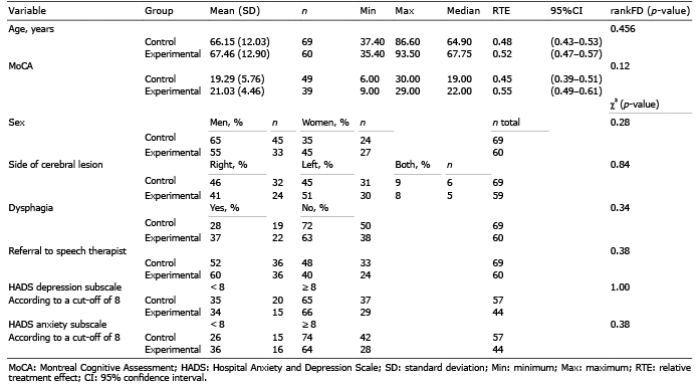 Click to show fullsize
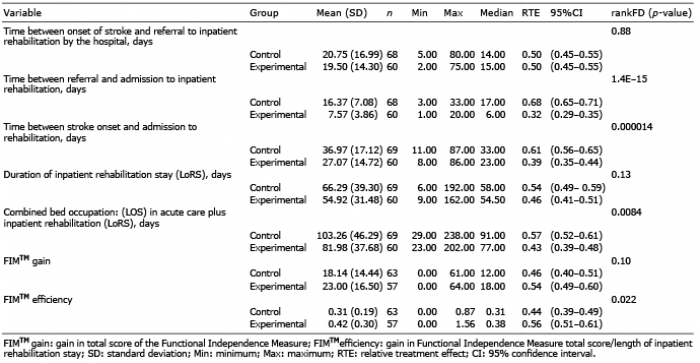 Click to show fullsize
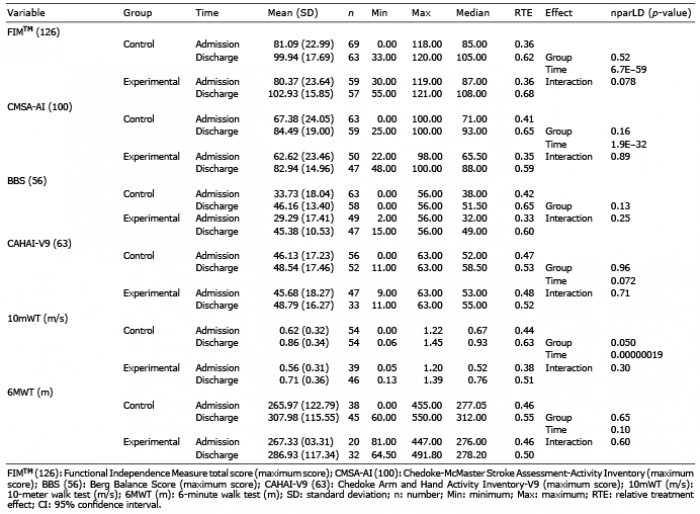 Click to show fullsize
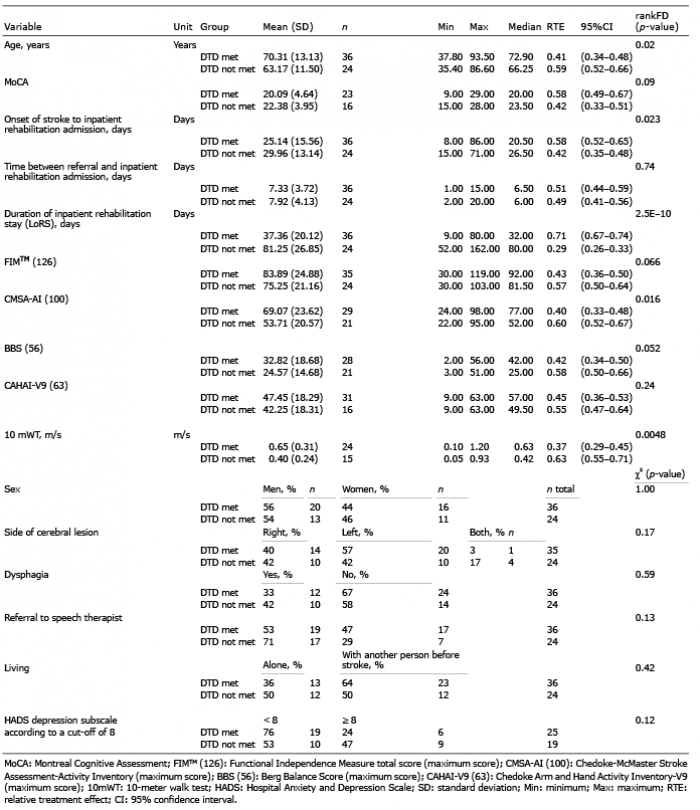 Click to show fullsize
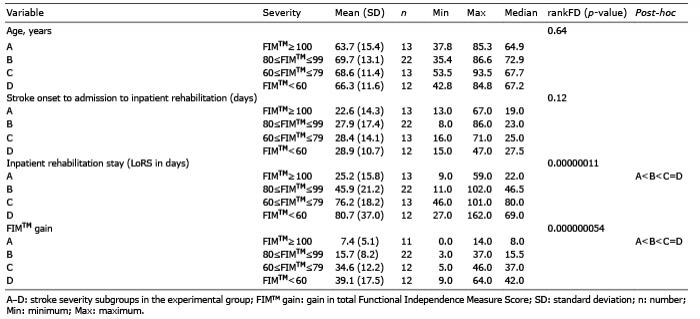 Click to show fullsize