
From the 1Pain and Rehabilitation Center, and Department of Health, Medicine and Caring Sciences, Linköping University, Linköping, Sweden
Background: Chronic pain is prevalent in Sweden, nearing 20% in the adult population. Treatment often requires a multimodal approach, with medication, physical therapy and psychological interventions. However, the frequency of medication in patients with chronic pain in Sweden, and its correlation with patient-reported outcome measures (PROMs), are currently unknown.
Objectives: To investigate the frequency of use of analgesics and other medication in patients with chro-nic pain referred to a multidisciplinary pain centre, and how opioid treatment relates to PROMs.
Design: Cross-sectional, registry-based study.
Patients: New referral visits (n = 1,275) to the Pain and Rehabilitation Center in Linköping, Sweden in 2015. 441 patients had complete medication and PROM data.
Methods: Patient-reported analgesic and other medications were matched with patient PROM data from the Swedish Quality Registry for Pain Rehabilitation. Univariate analysis was conducted with IBM Statistical Package for the Social Sciences (SPSS; IBM Corporation, Somers, NY, USA) version 24.0, and multivariate analysis with SIMCA-P+ (version 13, Umetrics AB, Umeå, Sweden), with a special emphasis on opioids.
Results: n = 132 (30%) patients used opioids daily, and this group differed from other patients on many PROMs, with medium effect sizes for pain severity, interference, health-related quality of life, activity engagement, and satisfaction with social life. Multivariate analysis identified four groups and showed that daily use of opioids was significantly correlated with high pain intensity and low physical functioning.
Conclusion: Prevalence of daily opioid use was 30% and daily opioid use did not correlate with better outcome of PROMs. Longitudinal studies are warranted (e.g. on the clinical effect of tapering), as are studies that can better explain the medication variability in patients with complex chronic pain.
Key words: chronic pain; opioid analgesics; multidisciplinary pain rehabilitation; SQRP; multivariate analysis.
Accepted Oct 6, 2020; Epub ahead of print Oct 23, 2020
J Rehabil Med 2020; 52 jrm00126
Correspondence address: Thomas F. Kallman, Pain and Rehabilitation Medicine, Linköping University, Brigadgatan 22, SE-581 85 Linköping, Sweden. E-mail: thomas.kallman@liu.se
Doi: 10.2340/16501977-2758
Chronic pain is fairly common in Sweden, affecting approximately 20% of the adult population. The role of opioids in the treatment of chronic pain is contested. This study examined the frequency of use of pain medication in 441 patients referred to a pain and rehabilitation clinic for interdisciplinary treatment, and the relationship between medication use and patients’ self-reported health. The results show that 43% of the patients used opioids; 30% daily and 13% “as needed”’. There was a significant negative correlation between use of opioids and pain severity, interference, health-related quality of life, activity engagement, and satisfaction with social life. Lower doses of opioids were associated with better physical function and better self-perceived health.
Chronic pain affects nearly 20% of the adult pop-ulation in Sweden (1). The available treatments rarely result in complete remission of pain (2). Instead, focus is often on rehabilitation and improvement of functioning. A recent meta-analysis found that opioid treatment for chronic non-cancer pain was associated with significantly less pain and significantly improved physical activity; however, the improvements were small (3). The use of opioids for managing chronic non-cancer pain is contested (4–6), and possible benefits must be weighed against risks and side-effects, e.g. addiction, overdose, nausea, constipation, depression, and hormonal disruption (3, 7–9).
The biopsychosocial model, introduced by George Engel, is a widely accepted perspective for understand-ing chronic pain. The model focuses on the interactions between biological, psychological and social aspects (10). Concerning psychological aspects, the distinction between states and traits is worthy of consideration. States are of shorter duration, constantly changing and varying in intensity and duration, e.g. a person’s current anxiety. Traits, on the other hand, are individuals’ general dispositions, e.g. to become anxious (11).
The sale of opioids quadrupled in the USA during the period 1999–2010, and, in parallel the overdose death rate in 2008 was almost 4 times that in 1999 (12). In 2014, a total of 47,055 drug overdose deaths occurred in the USA, representing a one-year increase of 6.5%, with 61% of these deaths involving some type of opioid, leading the Centers for Disease Control and Prevention to conclude that the “opioid epidemic” was worsening (13).
In Sweden, total opioid prescriptions, measured as oral morphine equivalents (OME), increased 22% in 2000–06, but has been stable since. There does not therefore appear to be an opioid “epidemic” in Sweden (14, 15).
The aim of this study was to assess the use of pain medication in patients with chronic pain who were referred to and visited the multidisciplinary Pain and Rehabilitation Center (PRC) in Linköping, Sweden, in 2015. A secondary aim was to investigate the correlation between patient-reported outcome measures (PROMs) from the Swedish Quality Registry for Pain Rehabilitation (SQRP) with pharmacological treatment, in particular opioids.
Study population
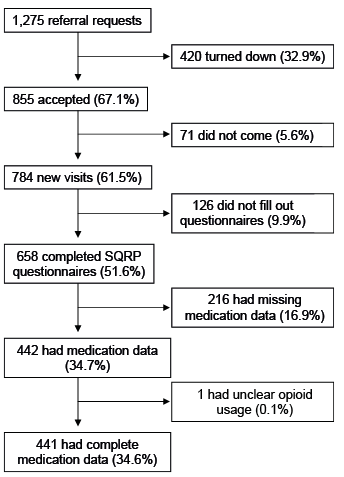
All subjects were new referrals to the PRC in Linköping in 2015, which received a total of 1,275 referral requests during that period. Of these, 855 (67.1%) were accepted and 420 (32.9%) were not. Seventy-one patients did not attend their referral meeting; thus, the total number of new patient visits was 784. Of these, 658 completed SQRP questionnaires. However, 216 patients had missing medication data and were excluded from further analysis. One patient listed the type of opioid, but not the dose or whether they used it daily or as needed, and was therefore excluded from further analysis. Thus, study data were therefore based on 441 patients (34.6% of all referral requests) (Fig. 1).
Fig. 1. Flow chart of selection of study population. All percentages are in relation to the original 1,275 referral requests. Study data was subsequently based on 441 patients (34.6%). SQRP: Swedish Quality Registry for Pain Rehabilitation.
Swedish Quality Registry for Pain Rehabilitation
The SQRP contains data on sociodemographic variables, health status, symptoms of pain, mood, pain coping and life satisfaction (16). The questionnaires used in the SQRP have been described in detail elsewhere (17). This paper therefore gives only a short description of the questionnaires included and specifies the variable abbreviations used in the present study.
The SQRP has collected national data since 1998 from 30 clinical specialist departments, and data includes questionnaires completed by patients with chronic pain. Questionnaires may be completed before admittance, directly after a rehabilitation programme, and again after one year, allowing longitudinal observation of patients’ scores. For the purposes of this study, medications taken and questionnaires completed before admittance were investigated, in order to gain a cross-sectional view of the patients prior to rehabilitation.
Demographic data
Age, sex, country of birth, education (HighEdu), number of days since last in work or studies (DaysNotWork), waiting time from referral date until first visit (RefWait), and number of physician visits within the last year (NbDrVisits) were extracted from SQRP data.
Characteristics of pain
Days since pain debut (PainDur) and days with persistent pain (PainDurPer) were obtained from SQRP data. Patients registered pain intensity during the previous week (NRS7d). The number of pain localizations were registered (NbPainReg).
Hospital Anxiety and Depression Scale
The anxiety subscale of the Hospital Anxiety and Depression Scale (HADS) is denoted HAD-A, and the depression subscale HAD-D. Higher scores indicate higher levels of self-reported symptoms of anxiety or depression, respectively. Scores may be stratified: ≤ 7 indicating a non-case; 8–10 a possible case; and 11–21 a definite case of either anxiety or depression. A mean score of 4.55 (HAD-A) and 3.98 (HAD-D) has been reported in a randomly selected Swedish population (18).
West Haven-Yale Multidimensional Pain Inventory
The West Haven-Yale Multidimensional Pain Inventory (MPI) comprises 3 subsections. Part 1 has 5 scales: pain severity (MPI-PainSev); interference (MPI-Interf); perceived life control (MPI-Contr); affective distress (MPI-AffDis); and social support (MPI-SocSup). Part 2 has 3 scales: punishing responses (MPI-Pun); solicitous responses (MPI-Solic); and distracting responses (MPI-Distra). Part 3 has 4 scales and measures to what extent the patient engages in daily activities, which are combined to yield a general activity index (MPI-GAI). The Swedish MPI has been shown to be valid, except for the individual items in part 3. Thus, only the MPI-GAI (19) was used in the current study.
European Quality of Life Instrument
The European Quality of Life Instrument (EQ-5D) measures health-related quality of life. The instrument has 2 parts: (i) self-estimation of today’s health on a 100-point scale with defined end-points (EQ5D-VAS) (a high score indicates good health, and vice versa); and (ii) 5 dimensions: mobility; self-care; usual activities; pain/discomfort; and anxiety/depression, weighted to yield an index (EQ5D-Index). Index values range from 1 to –0.594, where 1 is the best possible perceived health, 0 is death, and negative values are considered to be worse than death (20). A mean value of 0.84 has been reported for the Swedish general population (21).
Short Form Health Survey
The Short Form Health Survey (SF36) has 8 subscales, which provide 2 index values: a Physical Component Score (SF36-PCS) and a Mental Component Score (SF36-MCS) (22).
Chronic Pain Acceptance Questionnaire
The Chronic Pain Acceptance Questionnaire (CPAQ) yields 2 subscales: activity engagement (CPAQ-AE) and pain will-ingness (CPAQ-PW). Higher scores indicate better activity en--gag-ement and pain willingness, i.e. more acceptance of pain (23).
Tampa Scale for Kinesiophobia
The Tampa Scale for Kinesiophobia (TSK) assesses fear of movement and re-injury. Total TSK scores range from 17 to 68, higher scores indicating more fear of movement and re-injury. The Swedish version of the TSK has been shown to be reliable and valid (24).
Life Satisfaction Questionnaire
The Life Satisfaction Questionnaire (LiSat-11) measures overall life satisfaction (LiSat-Life), and in 10 specific areas: vocation (LiSat-Voc); finances (LiSat-Eco); leisure (LiSat-Leis); social life (LiSat-Soc); sexual life (LiSat-Sex); self-care (LiSat-ADL); family life (LiSat-Fam); partner relationship (LiSat-Part); phys-ical health (LiSat-Phys) and; mental health (LiSat-Ment) (19).
Pain Catastrophizing Scale
The Pain Catastrophizing Scale (PCS) consists of 13 items answered on a 5-point Likert scale from 0 (not at all) to 4 (all the time). Total scores range from 0 to 52. Higher scores indicate more pain-related catastrophizing thoughts (25).
Interpreting patient pain medication lists and matching with Swedish Quality Registry for Pain Rehabilitation data
Patient data were collected on medications patients were using on admittance, specified dose, which medications were taken daily (i.e. continuously), and which were taken “as needed” on a designated paper medication list. Patients also had the option to state they took no medications. Medication data is not routinely added to SQRP data. Using the SQRP’s unique identifier code (MCEID), each patient’s medication list was manually matched with their corresponding PROMs in Microsoft Excel (Excel, Microsoft, Redmond, WA, USA) version 16.17 by author TFK.
In the case of illegible handwriting on medication lists, these were examined by both authors. Consensus as to which medication was written on the list was, if possible, attained. In cases of uncertainty, the patient’s medication data was listed as missing. If patients had listed the type of medication, how they used it (daily vs “as needed”), but not dose, the patient was listed as a user in that medication group and the specific dose registered as missing data (e.g. patient listed oxycodone daily without specifying dose, subsequently registered as daily opioid user with dose as missing data). Patients with no medication data at all (e.g. their list was not completed) or their list was missing, were excluded from further analysis.
For all medications, a mean daily dose (in mg) was calculated. Each respective daily opioid dose was converted to a daily OME by using the equivalence table in O’Brien et al. (4).
Organizing patient medications according to The Anatomic Therapeutic Chemical codes
The Anatomic Therapeutic Chemical (ATC) classification system for prescription drugs was used to organize each medication specified on the patient’s list (26). The following ATC code groups were included and registered for each patient: H02AB (glucocorticoids); M01 (anti-inflammatory and anti-rheumatic agents); M03B (muscle relaxants); and all medications beginning with N (N02A–N06AX26, nervous system).
Statistical analysis
Univariate analysis. IBM Statistical Package for the Social Sciences (SPSS, IBM Corporation, Somers, NY, USA) version 24.0 was used for univariate analysis. p≤0.05 was considered statistically significant in all tests, with no adjustment for multiple comparisons. For comparisons between groups, independent samples t-test was used. For categorical data, Pearson’s χ2 test or Fisher’s exact test were used.
Effect size was calculated as Cohen’s d, using the formula:
Formula
where M1 is the mean of the opioid group; M2 the mean of non-opioid group; SD1 the standard deviation for the opioid group, and; SD2 the standard deviation for the non-opioid group. Cohen’s d of 0.2 is considered a small effect size, 0.5 medium, and 0.8 large (27).
Multivariate data analysis
For multivariate data analysis by projection, SIMCA-P+ (version 13, Umetrics AB, Umeå, Sweden) was used. The more well-known regression analysis techniques, multiple linear regression (MLR) or logistic regression (LR) are not well suited for multi-collinear data, as such data breaks the underlying assumptions behind MLR and LR, i.e. that the predictors (often also called independent variables) are not inter-correlated. Furthermore, MLR and LR have difficulty in handling missing data. Due to these challenges, principal component analysis (PCA), hierarchical cluster analysis (HCA), partial least squares – discriminant analysis (PLS-DA), and orthogonal projections wto latent structures discriminant analysis (OPLS-DA) were used. In short, these methods explore: PCA detected outliers; HCA identified subgroups (clusters); PLS-DA for characterization of defined clusters and comparing medication frequencies between clusters, and; OPLS(-DA) to specifically explore opioid use/OME dose in relation to PROMs. An in-depth explanation of the multivariate data analysis (MVDA) workflow is available in Appendix S11 and from Wheelock & Wheelock (28).
Ethics
Ethical approval was granted by the Regional Ethics Committee in Linköping, Sweden (Dnr 2015/108-51).
Stratification by opioid use
Demographic data, patient pain characteristics, and PROMs are shown in Table I. The results were dichotomized into patients using (n = 132) vs not using opi-oids (n = 309) on a daily basis; hence, 30% of patients were using opioids on a daily basis. A total of 56 patients (13%) used opioids only on an “as needed” basis.
Patients using opioids on a daily basis were older, visited the doctor more frequently, had longer duration of pain and persistent pain, and had higher pain intensity during the last week. Opioid users scored themselves as more depressed (HAD-D), had higher pain severity (MPI-PainSev,), poorer somatic and psychological health (EQ5D-Index, EQ5D-VAS, SF36-PCS, LiSat-Phys, SF36-MCS), were less willing to engage in activities (MPI-GAI, CPAQ-AE, CPAQ-PW) and experienced lower quality of life on many LiSat-subscales (see Table I for values and p-values). Medium effect sizes (Cohen’s d ≥ 0.5) were found for pain severity, interference, health-related quality of life, activity engagement, and social life satisfaction (Table I).
Table I. Demographic data, pain characteristics, and patient-reported outcome measures (PROMs) of all patients and sub-grouped by opioid use. Patients using opioids only “as needed” are included in the “not on opioids” group. p-values refer to either χ2, Fisher’s exact test, or t-test between those on opioids and those not on opioids, as appropriate
Analgesics and other medications
An overview of the frequency of patients’ daily medications is shown in Table II. The 5 most frequent daily medications that patients reported at admission were: paracetamol (44.5%), antidepressants (37.9%), opi-oids (29.9%), non-steroidal anti-inflammatory drugs (NSAIDs) (16.8%), and hypnotics (16.6%). Of the patients using opioids daily, 25.0% used oxycodone, and 24.2% used tramadol. Morphine and codeine were the third most frequent medications, both at 18.2%. Medications taken only “as needed” are listed in Table III.
Twelve patients (2.7%) used benzodiazepines daily, and 12 used them as needed. The proportion of patients using benzodiazepines daily was significantly higher in the group taking opioids every day compared with non-opioid users (7% vs 1%, Fisher’s exact test, p = 0.001). Of those using opioids every day, 53% were taking antidepressants, compared with 31% in the non-opioid group (Fisher’s exact test, p < 0.001). Of daily opioid users, 29% were using hypnotics regularly compared with 11% in the non-opioid user group (Fisher’s exact test, p < 0.001).
Table II. Frequencies of medications taken daily by patients on admission to the Pain and Rehabilitation Centre (PRC), Linköping. The Anatomic Therapeutic Chemical (ATC) classification system for prescription drugs was used to group each medication type, for details see Methods.
Table III. Frequencies of medications taken "as needed" by patients on admission to the Pain and Rehabilitation Centre (PRC) in Linköping. The Anatomic Therapeutic Chemical (ATC) classification system for prescription drugs was used to group each medication type. For details on the ATC-system, see Methods
Median medication doses are listed in Table IV. The median (range) OME dose in patients using opioids daily was 30 (4.5–270) mg per day, while the mean (SD) OME dose was 46.5 mg (SD 48.8) per day. Three patients using opioids listed type of opioid and how they used it (i.e. daily), but not specified the dose. For patients taking OME ≥ 100 mg (n = 19), a retrospective journal check was conducted to ensure that none had a cancer diagnosis, as this could indicate management of cancer pain. No cancer diagnoses were present in the 19 individuals receiving OME ≥ 100 mg. The type of opioid these 19 patients used was: 9 used oxycodone, 4 used fentanyl, 2 used morphine, 1 used tapentadol. Three patients used a combination of 2 types of opioid: fentanyl and oxycodone; tramadol and morphine; and codeine and morphine.
Table IV. Dosages of selected medications (mg). All medications were taken daily
Multivariate data analysis
Due to a high number of missing variables, 6 patients were excluded from further MVDA analysis. Hence, 37 variables in 435 individuals were analysed by PCA. One individual was a strong outlier by Hotelling’s T2 and excluded from further analysis, leaving a total of 434 individuals for analysis. This PCA model had 3 principal components (R2 = 0.43, Q2 = 0.27). Based on this PCA model, HCA was effectuated, and in the resulting dendrogram (not shown) a level of 4 clusters/groups was chosen. A PLS-DA model was then computed, using group belonging (i.e. 4 groups) as outcome variable (2 latent variables, R2 = 0.41, Q2 = 0.40, p < 0.001 by analysis of variance of the cross-validated predictive residuals (CV-ANOVA)). PLS-DA results in a score and loading plot; see Fig. 2a and 2b, respectively. In the score plot, the 4 groups are shown (group 1, n = 123; group 2, n = 104; group 3, n = 67; group 4, n = 140).
According to the loading plot in Fig. 2b, one may see that group 1 was characterized by:
Group 2 was the opposite of group 1.
Groups 3 and 4 were intermediate groups concern-ing the above-mentioned variables (i.e. between the x-axis “extremes” of groups 1 and 2), but differed on the y-axis by, for example, the following variables:
Levels of “social distress”: group 3 correlated negatively with MPI-Pun and positively with MPI-Solic, MPI-SocSup, and MPI-Distra; the opposite was true for group 4
Pain duration: group 4 was associated with longer pain duration than group 3
Descriptive data and inferential statistics (Kruskal–Wallis, Pearson’s χ2 test, Mann–Whitney U) for the variables in the 4 groups are shown in Appendix S11 (Tables SI1 and Table SII1), confirming the interpretation of Fig. 2b.
Fig. 2. (a) Partial least squares – discriminant analysis (PLS-DA) model score plot visualizing the 4 clusters. Each patient is represented by a dot. Scores t[1] and t[2], i.e. the 2 axes in the grid, represent the 2 latent variables (principal components) of the model. Four groups are shown with different colours: group 1 (blue), n = 123; group 2 (green), n = 104; group 3 (red), n = 67; group 4 (yellow), n = 140. (b) PLS-DA model loading plot. The 2 axes in the grid represent the loadings of the respective latent variables. The loading plot is complementary to the score plot and summarizes the relationship between the independent variables as well as their relation to group belonging (dependent variable symbolized by group dot). Independent variables located near a group dot are positively associated with that group. For example, group 1 is characterized by high Hospital Anxiety and Depression Scale (HADS) HAD-D scores. Group 2, found on the opposite end of the axis, is instead characterized by low HAD-D scores. For variable abbreviations, see Methods.
Medication use in the four groups
An overview of the frequencies of medications taken daily by patients in the 4 groups is shown in Table V. Of the patients in group 1, 43% used opioids daily, compared with 15% in group 2. Similarly, there was a higher frequency of benzodiazepine and hypnotics use in group 1 compared with group 2 (7% vs 0% and 22% vs 9%, respectively).
Multivariate analysis of opioid use
The use of opioids was further investigated by MVDA, see Appendix S11 . In short, it was found that regular use of opioids was first and foremost associated with:
Moreover, in patients taking opioids regularly, we found:
Table V. Frequencies (%) of medications taken daily by patients in the 4 groups defined by the hierarchical cluster analysis (HCA). The Anatomic Therapeutic Chemical (ATC) classification system for prescription drugs was used to group each medication type, for details see Methods. p-values refer to Pearson-Chi between the groups.
To the best of our knowledge, no previous study has reported medication frequencies in patients with chronic pain referred to a multidisciplinary pain rehabilitation centre or put it in relation to PROMs. Hence, although there are limitations and interpretational challenges concerning the statistical associations presented, we nonetheless propose that the present study has clinical relevance.
Main findings (primary aim)
Of the study patients, 43% (30% daily and 13% “as needed”) were taking some form of opioid when being assessed at the PRC. This proportion may seem high; however, it should be noted that this is a highly selected group of patients. Hysing et al. (29) reported that 71% of patients with chronic pain used opioids. The 2 study populations, however, are not fully comparable, as Hysing’s patients participated in an inpatient rehabilitation programme reserved for the most refractory cases. This percentage, together with the current results, exemplifies the complexity of pain in this patient group, and that it is important to examine opioid use in this patient group.
As the medication frequencies reported in the current patients are “on admission”, prescriptions were written by doctors outside of specialized pain medicine. This may then be seen as a reflection of how physicians outside of specialized pain medicine prescribe opioids to patients with complex chronic non-cancer pain. As opioids are not generally indicated for this type of pain, one can only speculate if this prescribing is due to a lack of understanding of the difference between acute and chronic pain, or, more likely, that it may represent a non-satisfactory prescribing pattern due to situational complexity. Both aspects, among others, are likely to be present in a given prescribing situation and patient.
The fact that 43% of patients were taking some kind of opioid may then been seen as either a discour-aging or somewhat hopeful percentage. While the percentage itself is important, we consider the dose to be an important variable. The current patients were taking relatively low daily median and mean doses, notwithstanding the 19 patients who used doses that were considered high, i.e. OME ≥ 100 mg per day (30, 31). Thus, the referring physicians did not routinely prescribe opioids to a majority of even their most complex pain patients.
Low frequencies of migraine medication are reported in this study, since severe cases of migraine are primarily managed by neurologists in Sweden, and not by pain specialists. Frequencies of Z-type hypnotics used “as needed” was low at 4.8%. Given the dangers of long-term use of benzodiazepines, it is encouraging that only 2.7% of patients were taking benzodiazepines daily, and 2.7% as needed; frequencies that must be considered low in a patient group characterized by high levels of co-morbid anxiety. Co-prescribing between daily opioid and benzodiazepine use reported in this study (7%) was lower than a previous study by Fleming et al. (32), which reported a frequency of 40%. This type of co-prescription is generally viewed as problematic (33).
Association between daily opioid treatment and patient-reported outcome measures
The patients’ demographic data and PROMs in the current study are similar to those found from the SQRP in previous studies on patients with chronic pain (34, 35). Excluding demographic variables in Table I, patients using opioids daily scored themselves significantly worse on 24 of 34 PROMs compared with non-opioid users, except for social support, where patients on opioids scored significantly better. Opioid users’ perception of increased social support could perhaps be explained by a legitimization effect. Simultaneously, opioid users scored their overall satisfaction with their social life lower.
Statistical significance does not imply clinical significance. To somehow assess the latter, we used Cohen’s d, finding medium effect sizes for a negative impact of opioids on pain severity, interference, health-related quality of life, activity engagement, and social life. From a pain rehabilitation point of view, opioids are often deactivating, which may be detrimental in situations where activation is considered beneficial (36). Patients using opioids reported more interfer-ence, lower willingness to engage in activities, and negatively impacted social life, indicating that these are important factors to focus on clinically. Considering that the patients using opioids in the current study reported higher pain severity, combined with the small effect sizes of opioid treatment in patients with chronic pain (3), tapering opioid doses in this patient group seems appropriate.
It may be speculated that patients were, in fact, under-treated, i.e. higher doses would have been appropriate. However, long-term daily doses above 100–120 mg OME are currently not recommended (31, 36). Patwardhan et al. (37) showed that reducing opioid doses in patients with chronic pain leads to less pain on a numerical rating scale and better quality of life, regardless of the pain condition being treated. As patients not using opioids daily reported less pain and higher quality of life compared with those using opioids daily, our findings may in part be mirrored in Patwardhan’s results. While some patients may benefit from short-term (weeks to months) dose increases, long-term dose escalation is to be avoided, as the risk-benefit ratio does not seem to be advantageous for many patients, especially at higher doses.
We do not know if opioids lead to worse self-perceived health, or if worse self-perceived health leads to a higher prescription of opioids. It is probable that both aspects are present in clinical practice, albeit in varying proportions in different patients. State vs trait aspects are also to be considered in this context. The PROMs we report can largely be considered to mainly reflect patients’ states, e.g. their health during the last month. Patients’ underlying traits, e.g. anxiety proneness, unwillingness to activate themselves, are likely factors for both opioid usage and patients’ overall well-being, but cannot be expounded by the current study.
Of the opioid users in this study, 53% used antidepressants, congruent with our finding that daily opioid users reported significantly higher HAD-D scores. This supports the link between opioid use and depression, as previous studies have reported that opioid treatment is associated with increased depression (7). If depressed patients are more frequently prescribed opioids than non-depressed patients, this could be viewed as an example of adverse selection (i.e. prescribing opioids to a category of patients at risk for opioid dependency) (38). If, on the other hand, it is the case that opioid use leads to depression, this is also problematic. The relationship between depression and opioid use is an important clinical issue to address in patients with chronic pain.
Multivariate data analysis
MVDA identified 4 groups of patients, similar to the ones described by Bäckryd et al. (39). When investigating medication usage in the groups, a pattern emerged, similar to that reported in the dichotomized analysis of patients using opioids daily vs those who do not. Specifically, group 1, characterized by the lowest self-perceived health and well-being, had the highest frequency of opioid use. Conversely, group 2, defined by the highest self-perceived health and well-being, instead had the lowest frequency of opioid use. Groups 3 and 4, are “intermediate” groups in regard to opioid use.
Pain catastrophizing is a common predictor for pain intensity and disability (40). The current study found no difference between patients in our univariate analysis, despite opioid users reporting higher pain intensity. Pain catastrophizing was, however, the highest in group 1 and lowest in group 2 (Table SI1), opioid use being most common in group 1 (Table V).
MVDA confirmed the univariate analysis of clinically significant variables, as group 1 reported high levels of pain severity, interference, low health-related quality of life, and activity engagement, while simultaneously having the highest opioid use. Furthermore, the current OPLS(-DA) demonstrated that low physical functioning and high pain intensity were predictors of daily opioid treatment. The OPLS showed that, as opioid doses decrease, physical function and self-perceived health increase. Conversely, as doses increase, so does interference. These observations strengthen that these variables are important factors to assess clinically.
Study limitations
As this study used self-reported data, patients may have either misremembered and/or misreported medications and dosages. Furthermore, as medication lists were handwritten, interpretational challenges were present. Thus, it is possible that not all patients who used opioids were included. This would lead us to underestimate the frequency of patients using opioids, in turn impacting the PROMs of opioid users, e.g. perhaps opioid users were more, or less depressed than reported here. A total of 217 patients who had PROMs but incomplete medication data were excluded, which could cause under- or overestimation, both the frequency of opioid use and the impact that opioid treatment may have on PROMs. The above could affect the internal validity of the current study.
The current study has not included patient diagnoses and how they relate to drug of choice or to PROMs, which is another limitation. In our opinion, the International Classification of Diseases (ICD-10) codes currently available do not communicate relevant information for chronic pain. This may change with the upcoming ICD-11.
Physician prescribing habits are likely to differ be-tween countries, and it is important not to overgeneralize the current findings (i.e. limited external validity). However, we consider it probable that these results could be extrapolated, with caution, to multidisciplinary pain clinics in Sweden. These results highlight the risks that may be present when using opioids in this patient group.
With increasing knowledge of the associations between opioid treatment and its impact on patients’ health, there is a need for both longitudinal studies and studies that may explain the medication variability in this patient group. Research into other unknown areas, such as the longitudinal effects of opioids on sex hormones, would be of interest (9). The present study has not accounted for medications in relation to alcohol use in patients with chronic pain, as this is not registered in the SQRP; and this clinical aspect would be of interest in future research.
To conclude, in this cross-sectional study of highly selected pain patients, prevalence of daily opioid use was 30% and daily opioid use did not correlate with better outcome of PROMs.
The authors thank Eva-Britt Lind for her help and assistance with acquiring SQRP data and referral numbers to the Pain and Rehabilitation Centre in Linköping in 2015.
Funding. Funded by ALF Grants, Region Östergötland.
The authors have no conflicts of interest to declare.


 Click to show fullsize
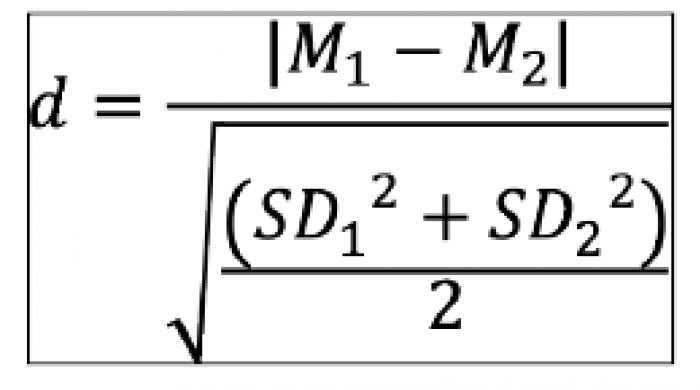 Click to show fullsize
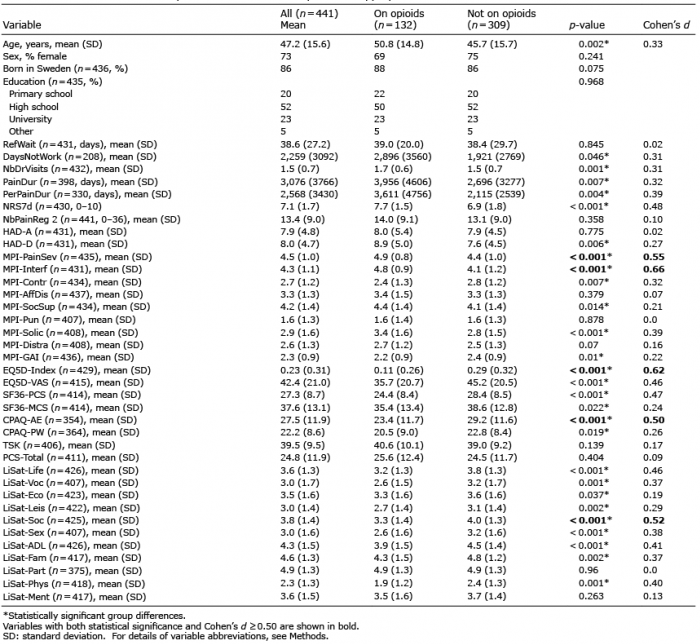 Click to show fullsize
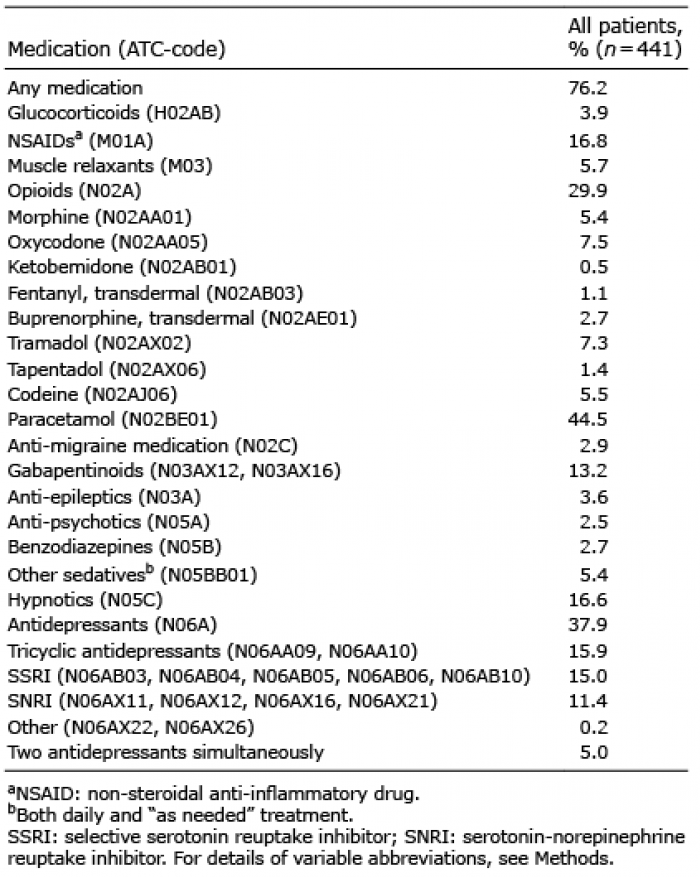 Click to show fullsize
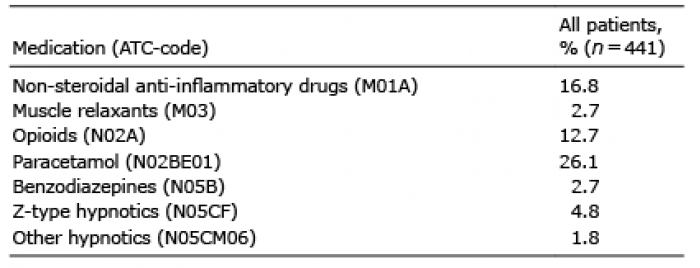 Click to show fullsize
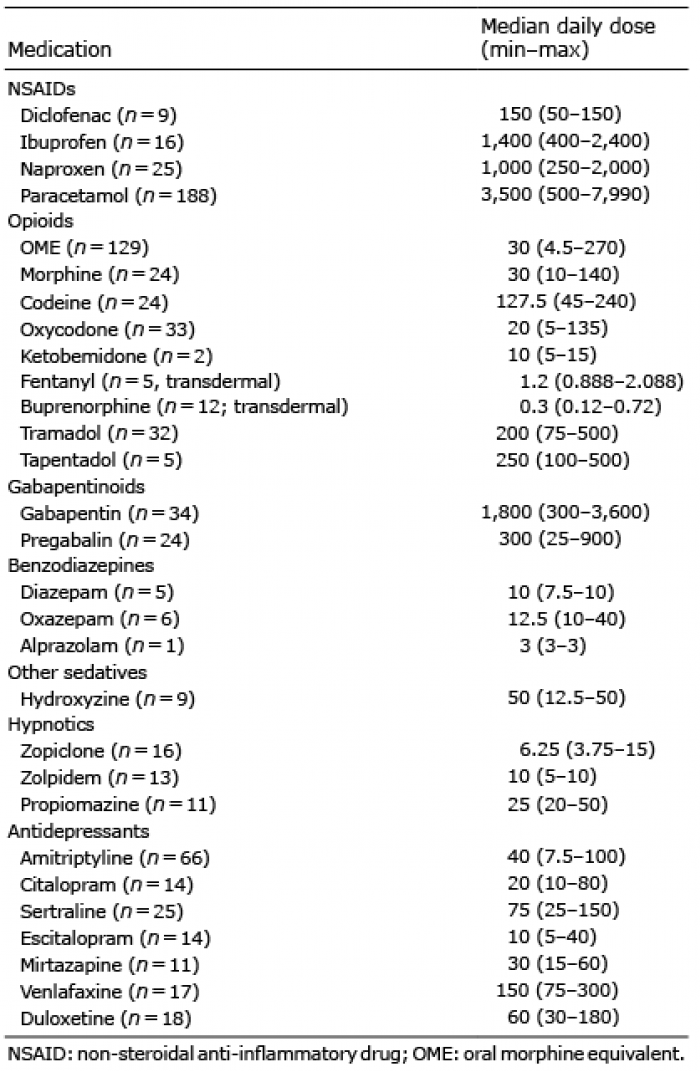 Click to show fullsize
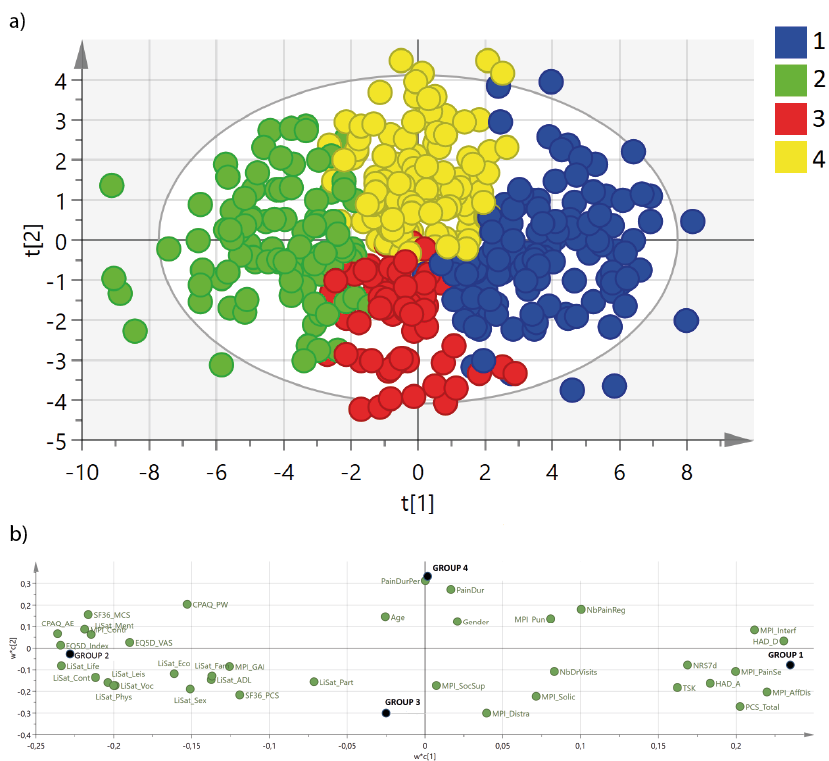 Click to show fullsize
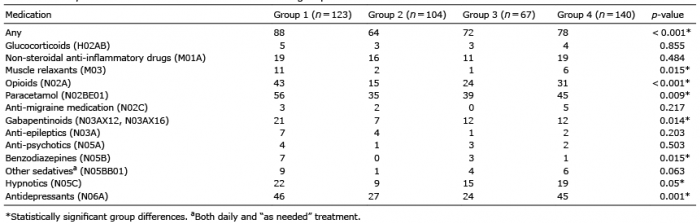 Click to show fullsize