


1Fibrosis & Lung Injury DPU, 5BioPharm R&D, GlaxoSmithKline, Stevenage, 2Plastic & Reconstructive Surgery Research, Institute of Inflammation and Repair, University of Manchester, Manchester, UK, 3Department of Clinical and Experimental Medicine, Faculty of Health Sciences, Linköping University, Linköping, 4Division of Dermatology, Ryhov Hospital, Jönköping, Sweden, and 6Center for Dermatology Research, Institute of Inflammation and Repair, Faculty of Medical and Human Sciences, University of Manchester, Manchester Academic Health Science Centre, Manchester, UK
The keloid lesion is recognised as a spatially heterogeneous mass both in cellular and acellular composition and biological activity. Here, we have utilised a bioinformatic approach to determine whether this spatial heterogeneity is also evident at the molecular level and to identify key upstream regulators of signalling pathways enriched in the lesion in a spatially-restricted manner. Differentially expressed genes (20% change, p < 0.05) obtained from microarray datasets derived from whole keloid biopsies and ex vivo-cultured keloid fibroblasts, both from distinct regions of the keloid lesion (leading edge, centre, and top) have been analysed to show that the TGFβ family plays a significant but spatially dependent role in regulation of keloid gene expression. Furthermore, we have identified additional upstream signalling molecules involved in driving keloid biology and provide information on therapeutic targets whose modulation might be expected to lead to significant therapeutic efficacy.
Key words: keloid disease; gene expression; microarray; TGFβ1; upstream regulator.
Accepted May 11, 2016; Epub ahead of print May 13, 2016
Acta Derm Venereol 2017; 97: 10–16.
Corr: Dr Ardeshir Bayat, Institute of Inflammation and Repair, The University of Manchester, Stopford Building, Manchester M13 9PT, United Kingdom. E-mail: ardeshir.bayat@manchester.ac.uk
Keloid disease (KD) is characterised by benign skin lesions that form as a result of localised, excessive collagen synthesis and deposition within the dermis that occur following surgery or injury in susceptible individuals (1). The scar tissue that is formed extends beyond the initial margins of the wound site, distinguishing this type of scar from hypertrophic scars (2). Treatment of keloids include intralesional corticosteroid injections, pressure dressings, cryotherapy and surgical excision (3). The high recurrence rate (4) combined with the very significant physical (5) and psychologically damaging impact (6, 7) of keloid scars on individuals with these lesions, means that KD is a disease of significant unmet medical need.
KD shares features associated with excess fibrous tissue formation in other cutaneous abnormal wound healing conditions. In particular, the central cellular component driving the formation and accumulation of aberrant extracellular matrix (ECM) formation is the fibroblast (8) which, when grown ex vivo, also exhibits altered functional responses including expression of cell cycle-related genes (9), proliferation (10), migration (11) and elevated collagen expression (11).
Numerous studies point towards the central importance of the TGFβ pathway in driving organ fibrosis in a number of indications including those of the lung (12), kidney (13), liver (14), eye (15), and other visceral organs (16). Likewise, dermal fibrosis also appears to be driven in part by the TGFβ pathway as has been demonstrated for hypertrophic scars (17), Dupytren´s contracture (18), and KD (19–21). The majority of studies of KD involve the use of ex vivo-cultured keloid fibroblasts stimulated with exogenous TGFβ1 to observe fibroblast functional responses that have been compared to fibroblasts obtained from uninvolved skin or skin biopsies from healthy control subjects. TGFβ pathway modulators have also been described to inhibit the signalling and aberrant functional responses of keloid fibroblasts stimulated by exogenous TGFβ1 (19, 22, 23). The expression of TGFβ downstream Smad signalling components have been studied in KD. The expression level of Smad2/3 (24) and phosphorylation of Smad3, an event that indicates activation of the pathway, are elevated in keloid fibroblasts compared to fibroblasts from unaffected skin (25). Interestingly, the expression of Smad6 and Smad7, signalling proteins that act as negative regulators of TGFβ signalling, are reduced in keloid fibroblasts compared to fibroblasts from healthy skin (26). Taken together, these data implicate an important role of TGFβ pathway in the pathogenesis of KD.
The clinical observation that keloids tend to grow invasively at the margin and show regression in the centre is well supported by several studies pointing to spatially restricted regulation in the molecular and cellular composition of the keloid mass that might provide important information for the design and execution of clinical studies in KD. For instance, the expression of apoptosis-related proteins (27) and type I collagen alpha 1 (COL1A1), TGFβ1, periostin, plasminogen activator inhibitor 2, and inhibin beta A (28) have been shown to be differentially altered in fibroblasts isolated from spatially distinct areas of the keloid. Likewise, the frequency of occurrence of dermal fibroblasts appears to be higher at the leading edge of the keloid compared to the centre which also correlates with the degree of disease activity (29), underscoring the likely importance of dermal fibroblasts in driving KD.
In this study, we have employed a systems-based approach to determine whether there is evidence of activation of the TGFβ pathway in KD compared to normal skin and in dermal fibroblasts isolated and grown ex vivo from keloid biopsies in a spatially-restricted manner. This involved meta-analysis of previously published microarray studies of KD involving biopsies obtained from different spatial locations of keloid scars and normal skin to identify a set of differentially expressed genes (DEGs) followed by Ingenuity Pathway Analysis (IPA) upstream regulator analysis (30, 31). The same analytical approaches have been used on dermal fibroblasts isolated and grown ex vivo from the different spatial locations of the keloid scar and normal skin biopsies. GeneSet Enrichment Analysis (GSEA) has also been conducted on the keloid microarray data using a TGFβ1 gene signature generated in normal dermal fibroblasts. Our data demonstrates evidence of TGFβ pathway activity at the transcriptional level in intact keloid biopsies and ex vivo-cultured dermal fibroblasts in a spatially-restricted manner underscoring the likely pathological importance of the TGFβ pathway in KD.
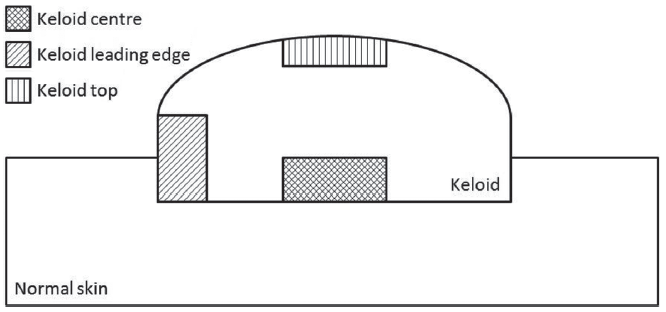
Fig. 1. Schematic of keloid biopsies. Whole keloid was excised from patients and biopsies were collected from the centre, leading edge or top as indicated in the schematic above. The same spatial locations were used for the whole biopsy and isolated fibroblast microarray studies.
Fig. 2. Scores plot from principal component analysis (PCA) performed on ex-vivo cultured fibroblasts and whole biopsies from anatomically distinct keloid regions or healthy skin. The keloid isolated fibroblasts and whole keloid biopsy microarray datasets were normalised separately by GCRMA. PCA was performed on detected probe sets only (see Appendix S11 for details). The scores plots showing principal components 1 and 2 for the isolated fibroblasts where the first principal component (x-axis) describes the largest source of variability in the data and can be attributed to normal compared to keloid fibroblasts (A) and whole biopsies where the first principal component is most likely describing donor variability and the second principal component (y-axis) describes the difference between normal and keloid biopsies (B).
After filtering to leave detected probe sets (see Appendix S1 for details on all methods) the gene lists for the keloid leading edge, keloid centre and keloid top were filtered for significant changes (p < 0.05). TaqMan validation was performed on selected genes in independent samples, see Appendix S1 for more details.
For the keloid leading edge biopsy gene list, there were 1,736 significant changes (1,611 up-regulated, 1,036 up-regulated > 2-fold; 125 down-regulated, 70 down-regulated > 2-fold). The largest 5 up-regulated genes were: Opioid binding protein/cell adhesion molecule-like (OPCML) 145-fold (17.4 fold FDR p = 0.0053 by qPCR), COL11A1 (collagen type XI alpha 1) 39-fold (45.5 fold FDR p = 0.0021 by qPCR), ADAM metallopeptidase domain 12 (ADAM12) 37-fold (157.3 fold FDR p < 0.0001 by qPCR), SPOD domain containing 1 (SPODC1) 35-fold and Synapse differentiation inducing 1 (SYNDIG1) 26-fold (15.8 fold FDR p = 0.0006 by qPCR). The largest 5 down-regulated genes were: Thyroid hormone responsive (THRSP) 48-fold, Acyl-CoA wax alcohol acyltransferase 1 14-fold, ELOVL fatty acid elongase 3 13-fold, WNT inhibitory factor 1 10-fold and Procollagen C-endopeptidase enhancer 2 7-fold.
For the keloid centre biopsy gene list, there were 6,054 significant changes (1,967 up-regulated, 1,326 up-regulated > 2-fold; 4,087 down-regulated, 2,181 down-regulated > 2-fold). The largest 5 up-regulated genes were: OPCML 40-fold (17.4 fold FDR p = 0.0053 by qPCR), Secreted frizzled-related protein 4 28-fold, Chordin-like 2 18-fold, SPODC1 14-fold, SYNDIG1 14-fold (15.8 fold FDR p = 0.0006 by qPCR). The largest 5 down-regulated genes were: Keratin 2 (KRT2) 1,750-fold, LCE2B (Late cornified envelope 2B) 739-fold, FLG (Filaggrin) 674-fold, Loricrin 446-fold and KRT1 (Keratin 1) 369-fold.
For the keloid top biopsy gene list, there were 2,348 significant changes (740 up-regulated, 500 up-regulated > 2-fold; 1,608 down-regulated, 640 down-regulated > 2-fold). The largest 5 up-regulated genes were: OPCML 54-fold, ADAM12 15-fold (157.3 fold FDR p < 0.0001 by qPCR), Family with sequence similarity 189, member A1 (FAM189A1) 14-fold, COMP (Cartilage oligomeric matrix protein) 14-fold (151.9 fold FDR p < 0.0001 by qPCR) and SYNDIG1 14-fold (15.8 fold FDR p = 0.0006 by qPCR). The largest 5 down-regulated genes were: DCD (Dermcidin) 12,478-fold, THRSP 1044-fold, SCGB2A2 (Secretoglobin, family 2A, member 2) 614-fold, SCGB1D2 (family 1D member 2) 237-fold and SCGB1D1 (family 1D, member 1) 186-fold.
The Z-scores from IPA upstream regulator analysis (see Appendix S1 data for definition of Z-score calculation), shown in Table SI, predicted that TGFβ1 was the most likely positive regulator of expression observed in keloid leading edge. For the keloid centre, several genes and molecules had large negative Z-scores (including pirinixic acid, v-myc avian myelocytomatosis viral oncogen homolog (MYC) and MYC neuroblastoma derived (MYCN) indicating that they were potential negative regulators of the observed gene expression changes. Of the genes and molecules that had positive Z-scores, TGFβ3 was the highest, and TGFβ1 was 4th highest (2nd and 3rd highest were tretinoin and sirolimus, respectively), suggesting that the TGFβ family plays a role in regulating gene expression from the keloid centre. Conversely, there was no evidence that TGFβ1 or other TGFβ family members were likely to have regulated the gene expression changes observed in the keloid top. Interestingly, all regulators had negative Z-scores, indicating negative regulators of expression, with mono-(2-ethylhexyl)phthalate, dexamethasome, pririnixic acid and rosiglitazone having the largest Z-scores.
After filtering to leave detected probe sets, the gene lists for the fibroblasts from the keloid leading edge and keloid centre were filtered for significant changes (p < 0.05). For the keloid leading edge fibroblast gene list, there were 4,510 significant changes (2,479 up-regulated, 1,489 up-regulated > 2-fold; 2,031 down-regulated, 724 down-regulated > 2-fold). The largest 5 up-regulated genes were: INHBA (Inhibin, beta A) 37-fold, Regulator of G-protein signalling 4 26-fold, NOTCH3 (Notch homolog 3 (Drosophila)) 23-fold, PLOD2 (Procollagen-lysine, 2-oxoglutarate 5-dioxygenase 2) 23-fold and Ezrin 23-fold. The largest 5 down-regulated genes were: WISP2 (WNT1-inducible signalling pathway protein 2) 104-fold, CLDN11 (Claudin 11) 40-fold, MASP1 (Mannan-binding lectin serine peptidase 1 (C4/C2 activating component of Ra-reactive factor)) 39-fold, RSPO3 (R-spondin 3 homolog (Xenopus laevis)) 37-fold, LRRN4CL (LRRN4 C-terminal like) 28-fold.
For the keloid centre fibroblast gene list, there were 5,509 significant changes (3,120 up-regulated, 1,880 up-regulated > 2-fold; 2,389 down-regulated, 805 down-regulated > 2-fold). The largest 5 up-regulated genes were: periostin, osteoblast-specific factor 71-fold (25.7 fold FDR p = 0.0003 by qPCR in independent keloid biopsies), KRT18 66-fold, Inhibin, beta A 59-fold, regulator of G-protein signalling 4 (RGS4) 43-fold, Transferrin receptor protein 1 (p90, CD71) (TFRC) 35-fold. The largest 5 down-regulated genes were: WISP2 134-fold, CLEC2B (C-type lectin domain family 2, member 8) 48-fold, RSPO3 44-fold, MASP1 36-fold and LRRN4CL 29-fold. The Z-scores from IPA upstream regulator analysis, shown in Table SII1, predicted that TGFβ1 was the most likely positive regulator of expression in both the keloid leading edge and keloid centre fibroblast gene lists.
For the leading edge signature, 193 unique genes were identified showing a significant change (> 1.2-fold, p < 0.05) in both keloid biopsy and keloid fibroblast gene lists. Of these, 181 showed an increase and 12 showed a decrease. The top 33 genes are shown in Table SIII. The gene symbols were loaded into IPA and the build function was used to connect the genes (direct and indirect interactions). A network of 91 genes formed and of particular note, TGFβ1 was the only central node to this network (Fig. 3).
Fig. 3. Network analysis (Ingenuity Pathway Analysis) performed on robust keloid leading edge gene signature. 193 unique genes that showed a significant (> 1.2-fold, p < 0.05) change in both keloid biopsy and keloid fibroblast leading edge gene lists. Gene symbols were loaded into IPA and the build function was used to connect the genes (direct and indirect interactions). The data depicts a network of 91 genes that forms from the 193 genes loaded. TGFβ1 has the most connections to other nodes in this network.
For the centre signature, 440 unique genes were identified as a showing a significant difference (> 1.2-fold, p < 0.05) in both keloid biopsy and keloid fibroblast gene lists. Of these, 209 increased and 231 decreased. The top 34 genes are shown in Table SIV. Networks were built as for the leading edge signature and a network of 218 genes formed. Although TGFβ1 was a central node in this network, there were other nodes that appeared to have equivalent interactions with other genes in the network, such as Integrin β1 and epidermal growth factor receptor (EGFR) (Fig. S1).
For the top signature, 456 unique genes were identified as a showing a significant (> 2-fold, p < 0.01) in the keloid biopsy gene lists. Of these, 171 showed an increase and 285 showed a decrease. The top 40 genes are shown in Table SV. Networks were built as for the leading edge signature and a network of 175 genes formed, and although TGFβ1 was a central node in this network, other nodes appeared to have equivalent interactions with other genes in the network, such as nuclear factor NF-kappa-B p65 subunit (RELA), Interferon γ and nuclear receptor subfamily 3, group C, member 1 (NR3C1) (Fig. S2).
Generation of a TGFβ1 gene signature in normal dermal fibroblasts
To confirm that the dermal fibroblasts from normal skin used in our study were capable of responding to TGFβ1, the cells were stimulated with TGFβ1 (0.5 ng/ml) for 24 h and supernatants assessed for IL-11 secretion (Fig. S3). A TGFβ1 gene signature was generated for GSEA, by challenging normal dermal fibroblasts with TGFβ1 (0.5 ng/ml) for 8 h and identifying genes that were detected and showed a significant (> 2 fold, p < 0.01) difference compared to vehicle treated cells.
For the TGFβ1 signature, there were 11,016 significant changes (5,379 up-regulated, 1,263 up-regulated > 2-fold; 5673 down-regulated, 1,506 down-regulated > 2-fold). The largest 5 up-regulated genes were: TSPAN2 (Tetraspanin 2) 558-fold, interleukin- (IL) 11 442-fold, IL-33 289-fold, heparin-binding EGF-like growth factor 269-fold and Frizzled homolog 8 (Drosophila) 261-fold. The largest 5 down-regulated genes were: KIT (v-kit Hardy-Zuckerman 4 feline sarcoma viral oncogene homolog) 120-fold, FAM65B (Family with sequence similarity 65, member B) 76-fold, MASP1 39-fold, RSPO3 37-fold, LRRN4CL 28-fold.
The universe was defined as the 17993 genes that were represented on both the Affymetrix U133_plus_2.0 and Agilent 4 X 44K microarray platforms. All gene lists were filtered to include only genes in the universe. This reduced the gene lists as follows: keloid leading edge signature reduced from 193 to 191 genes, keloid centre signature reduced from 440 to 419, keloid top signature reduced from 456 to 410. The TGFβ1 signature of 2,796 significant (p < 0.01) changes > 2-fold represented 1,884 unique genes. Of these, 1,771 (789 showing an increase, 982 showing a decrease) were also present in the defined universe.
A Fisher’s Exact Test on overlapping genes indicated a highly significant overlap between the keloid leading edge (p = 5.8 × 10⁻⁸) signature and keloid centre signature (p = 2.0 × 10⁻⁷) with the TGFβ1 signature, whereas the overlap between the keloid top signature and the TGFβ1 signature was not significant (p = 0.06). Fig. S4 shows 4-way Venn diagrams summarising the overlap between the keloid signatures and TGFβ1 signature.
Several studies have utilised whole genome-wide microarray technology to identify DEGs in keloid fibroblasts or from keloid tissue biopsies in situ compared to healthy control dermal fibroblasts and skin samples (32–41). These microarray studies have been important in providing descriptive information on DEGs in these biological samples, however, they have not identified the key upstream signalling molecules driving these changes that could provide information on therapeutic targets whose modulation might be expected to lead to significant therapeutic efficacy in KD.
It is evident that keloid lesions exhibit distinct spatial and temporal heterogeneity at the molecular and cellular level that could have profound implications for clinical development of novel therapeutics for KD. For instance, the number of activated dermal fibroblasts is greatly increased at the peri-lesional, leading edge of the keloid lesion compared to corresponding biopsies obtained from the centre of the lesion (29). In addition, ex vivo-cultured keloid fibroblasts isolated from the growing edge of the keloid lesion exhibit higher capability for synthesising ECM than cells isolated from extra-lesional and intra-lesional sites (42). These differences in cellular behaviour observed in the keloid lesion may result from changes in cellular senescence that occurs in a regionally-selective manner by molecular mechanisms that are incompletely understood (43). Thus, a more precise understanding of signalling pathways driving the molecular changes in different regions of the keloid lesion is warranted.
With that in mind, this significant study had the following goals: (1) To utilise IPA to identify the upstream signalling nodes/regulators likely responsible for the DEGs observed in keloid fibroblasts and whole keloid biopsies using previously published microarray data (2) To determine whether the upstream signalling nodes/regulators predicted to drive the DEGs differ in a spatially-restricted manner (top, centre, and leading edge) in keloid lesions and whether these patterns are retained in ex vivo-cultured fibroblasts grown from biopsies obtained from the distinct areas of the keloid lesions (3) To utilise GSEA to determine whether the TGFβ1 pathway is over-represented in a defined robust keloid signature that was curated by combining the common DEGs from the keloid fibroblast and whole keloid biopsy datasets in a spatially-selective manner.
The published datasets used for the meta-analysis (30, 31) were chosen primarily due to the opportunity to interrogate the global gene expression profiles of keloid lesional samples (keloid fibroblasts and whole keloid biopsies) in a spatially-restricted manner. For the samples collected in the study, there is likely to be inherent biological variability driven in large part by the heterogeneity of the sampling with respect to anatomical location of the keloid lesions, different disease stages of the excised keloids, and the fact that we compared keloid fibroblasts with whole keloid biopsies that contain a mixture of cell types. In addition, technical variability with respect to the different microarray platforms used in the studies also needs to be recognised. The sources of variability described above, particularly the utilisation of different microarray platforms, most likely limited the number of overlapping genes from the keloid fibroblast and whole keloid studies that we collectively termed the robust keloid signature which we used to conduct the GSEA. In addition, transcriptional responses that arise as a result of treatment of normal dermal fibroblasts with TGFβ1 are likely to occur in a temporally-restricted manner with individual genes exhibiting distinct and unique temporal profiles as has been documented in other systems (44). Thus, the obvious limitations associated with using a single time-point of TGFβ1 stimulation of dermal fibroblasts for the generation of the TGFβ pathway signature for GSEA in our study should also be recognised. That said, our analysis clearly points to the likely pathophysiological importance of the TGFβ pathway in driving keloid lesion development.
From a purely spatial perspective, we speculate that identification of the TGFβ pathway being the central upstream regulator at the leading edge of the keloid lesion and exhibiting the strongest enrichment assessed by GSEA, may indicate the prime importance of this pathway in driving expansion of the keloid mass laterally into adjacent uninvolved skin. This finding is in line with existing published data that points towards the likelihood that the leading edge of the keloid is the most biologically active part of lesion where the increased frequency of activated, proliferative and synthetic dermal fibroblasts are observed (42) and the large body of in vitro, cell-based data that has demonstrated the functional capability of the TGFβ pathway to drive collagen synthesis (45) and proliferation (46) of dermal fibroblasts. It is also highly likely that pathways activated downstream of TGFβ1 such as the IL-6 cytokine family, will also contribute to disease pathogenesis. In this regard, our finding that IL-11 expression is dysregulated in keloids adds to previous reports indicating that downstream components of the IL-6 pathway such as JAK1, STAT3, RAF1, and ELK1 (47) and IL-11RA (39) appear to be up-regulated in keloid tissue. The finding that pSTAT3 levels have also been shown to be elevated in keloid fibroblasts and to be involved in driving keloid fibroblast proliferation in vitro (48) confirms that increased pathway activity can be detected in keloid tissue and provides some indication to the possible pathophysiological contribution of this pathway to KD. It is tempting to speculate that the identification of multiple upstream regulators driving the global DEGs in the central and top regions of the keloid lesion is also representative of different biological events occurring in these areas. In this regard, the finding that upstream regulators such as NR3C1 appear as one of the candidate regulators of the gene expression profiles in the top region of the keloid lesion is particularly interesting given the previous association of this protein in driving epithelial mesenchymal transition (EMT) (49) especially as keratinocyte differentiation to a mesenchymal phenotype has been implicated as a key pathological event contributing to keloid lesion development (50). This conclusion is supported by the significant down-regulation of several keratin isoforms (KRT25, KRT27) observed in the DEGs in the top region keloid signature as would be expected if this region contains a significant proportion of keratinocytes undergoing EMT (51, 52).
It is interesting to note that the keloid fibroblasts appear to retain some of the transcriptional memory of signalling events that occur within keloid tissue in situ. This has important implications for the use of keloid fibroblasts as opposed to keloid tissue for target identification and testing of novel therapeutic agents particularly where routine access to intact keloid tissue is problematic and where no suitable animal models of keloids exist (53). Our data would provide rationale for the use of keloid fibroblasts in this regard. The transcriptional memory that the keloid fibroblasts exhibit that is maintained after isolation of the cells and over several cell doublings, also indicates that these cells have been subjected to disease processes that have altered certain gene expression networks in a relatively stable manner, which might indicate epigenetic alterations underlying these changes. Indeed, recent studies have shown that alterations in DNA methylation and histone acetylation may underpin some of the altered in vitro wound healing properties observed in keloid fibroblasts as inhibitors of DNA methyltransferases (54) and histone deacetylases (54, 55) have been demonstrated to attenuate collagen production and CTGF secretion in these cells.
In summary, our bioinformatic study provides strong rationale for the pathophysiological importance of a number of signalling regulators/nodes, particularly TGFβ, in the development of keloid lesions in a spatially-restricted manner. Remarkably, our analysis also indicates that ex vivo-cultured keloid fibroblasts exhibit similar transcriptional signatures to those observed in whole keloid lesions suggesting that keloid fibroblasts may represent a relevant cell-based model of keloid lesion development for target identification and testing of novel investigational agents.
Conflict of interest: AT, DCB, AB, TW, MD, FK, JE, RPM, and NA are all employees of GlaxoSmithKline and hold shares/stock options in GlaxoSmithKline.
 Appendix S1 Figure S1 Figure S2 Figure S3 Figure S4 Table SI Table SII Table SIII Table SIV Table SV

 Click to show fullsize
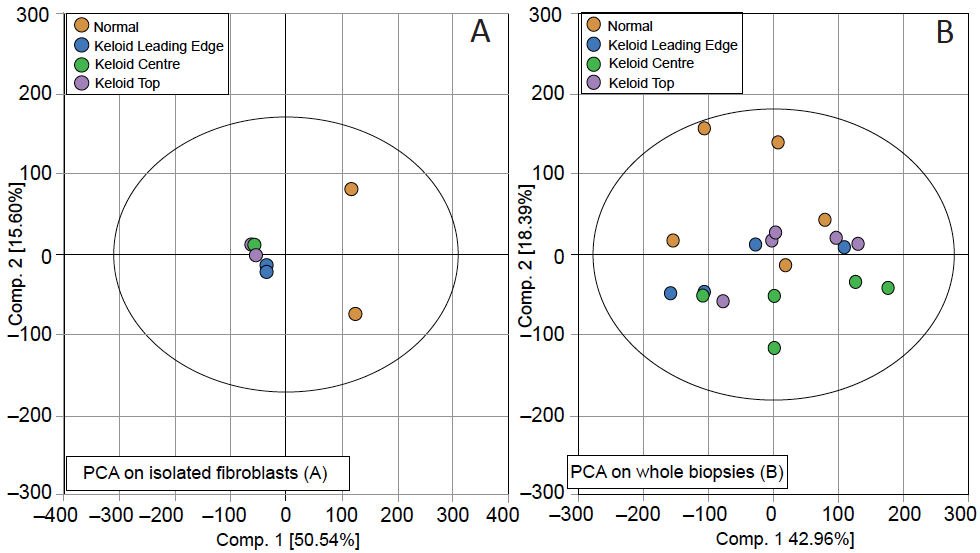 Click to show fullsize
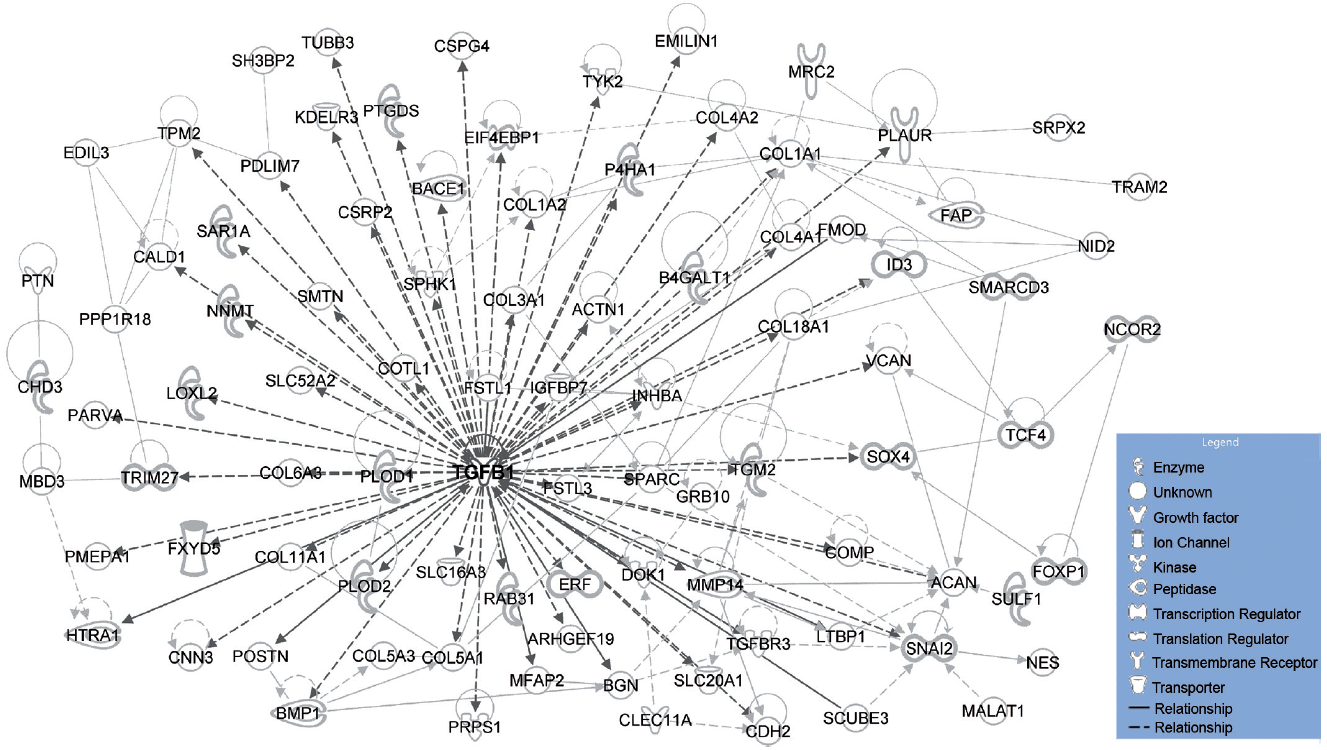 Click to show fullsize