


1Department of Dermatology, University of Heidelberg, Heidelberg, and 2Current address: Artemed Fachklinik, Bad Oeynhausen, Germany
Only limited data on laboratory parameter dynamics and safety under prolonged biologic treatment in a “real-world” scenario are available for recommendations on screening and monitoring. This study is a retrospective analysis of routine parameter dynamics and laboratory adverse events (LAE) in psoriasis patients on long-term treatment (n = 199) with tumour necrosis factor (TNF)-α-antagonists (adalimumab, etanercept), and the interleukin (IL)12/23-antagonist ustekinumab. Overall, neutrophil (PMN) counts (–11%) and triglycerides (+9%) changed considerably. TNF-α-antagonists and ustekinumab differentially affected lymphocyte counts (+13% and ±0%, respectively). Dynamics were pronounced during the first 180 days of treatment. In 340 treatment-years, 15 Common Terminology Criteria for Adverse Events (CTCAE) III–IV° LAE were recorded (11 involved liver enzymes). They prompted alteration of the biologic regime in only 2 cases. Age, sex, previous systemic treatments, and psoriatic arthritis did not significantly predict LAE. Liver enzyme and triglyceride screening may be warranted in some instances. Our data suggest that unguided monitoring of other routine laboratory parameters is unnecessary under long-term biologic treatment.
Key words: psoriasis; biological products; adalimumab; etanercept; ustekinumab; neutrophils; lymphocytes; transaminases; triglycerides; blood cell count; clinical chemistry tests.
Accepted Feb 20, 2017: Epub ahead of print Feb 22, 2017
Acta Derm Venereol 2017; 97: xx–xx.
Corr: Jochen Hoffmann, Department of Dermatology, University of Heidelberg, INF 440, DE-69120 Heidelberg, Germany. E-mail: jochen.hoffmann@med.uni-heidelberg.de
Recommendations of international dermatological societies on routine laboratory parameter monitoring under biologic treatment include complete blood count (CBC) and a comprehensive metabolic panel (1–3). These recommendations are based on a limited number of studies. In particular “real-world” data are sparse. A recent review (4) identified only one study providing data on routine laboratory parameter dynamics under long-term treatment with adalimumab and etanercept (5). Long-term treatment of psoriasis patients with the tumour necrosis factor α (TNF-α) antagonists adalimumab and etanercept, and the IL12/23 antagonist ustekinumab is, however, becoming increasingly common in everyday dermatological practice. A detailed description of routine parameter dynamics under long-term adalimumab and etanercept treatment and data on routine laboratory parameter dynamics under long-term ustekinumab treatment under “real-world” conditions are therefore desirable to further optimize and harmonize recommendations on monitoring under biologic treatment.
We present here a retrospective data analysis that encompasses 199 treatments with adalimumab, etanercept, and ustekinumab. Parameter dynamics under treatment were assessed and compared among the individual biologics. Laboratory adverse events (LAEs) were identified and graded according to Common Terminology Criteria for Adverse Events (CTCAE) criteria. Finally, possible predictors of CTCAE III–IV° adverse events were investigated.
Patients were eligible for study participation if: (i) they were treated with adalimumab, etanercept, or ustekinumab for psoriasis vulgaris (PV), psoriasis guttata (PG), psoriasis palmoplantaris pustulosa (PPP) with or without accompanying psoriasis arthritis (PA) at our institution; (ii) laboratory data under treatment was available for at least one biologic; and (iii) they gave informed consent to retrospective data analysis. A treatment cycle encompassed the interval from initiation to termination of a specific treatment. Patients consecutively treated with adalimumab, etanercept, and ustekinumab could contribute data to all biologics. Overall, 35 patients contributed data for 2 different biologics, and 10 patients contributed data for 3 different biologics. If treatment with a given biologic was, however, terminated for any reason and re-initiated later, only the first treatment cycle was eligible. This study was approved by the local ethics committee.
Typically, 40 mg adalimumab (Humira; AbbVie, North Chicago, IL, USA) is administered subcutaneously (s.c.) every other week after an initial loading dose of 80 mg. Etanercept (Enbrel; Pfizer, New York City, USA) is administered s.c. with an initial dose of 25–50 mg biweekly or 25 mg weekly for 12 weeks followed by biweekly administration of 25 mg or weekly administration of 50 mg following national guidelines (6). Ustekinumab (Stelara; Janssen-Cilag, Neuss, Germany) is administered s.c. at weeks 0, 4, and 12 – weekly thereafter, at weight-adapted doses of 45 or 90 mg. Routine visits are usually scheduled every 8–12 weeks. Psoriasis Area and Severity Index (PASI) scores were accepted as baseline score only if obtained less than 30 days prior to treatment initiation.
Laboratory blood tests are routinely performed in psoriasis patients receiving adalimumab, etanercept, and ustekinumab according to our standard operating procedures. CBC including leucocyte, neutrophil (polymorphonuclear) granulocyte (PMN), lymphocyte, thrombocyte, and erythrocyte counts, as well as haemoglobin, C-reactive protein (CRP), lactate dehydrogenase (LDH), transaminases (aspartate transaminase (GOT/AST), alanine transaminase (GPT/ALT), gamma-glutamyl transferase (GGT)), triglyceride, total cholesterol, blood urea nitrogen (BUN), and creatinine levels were recorded at baseline and during treatment. Measurements of routine laboratory parameters were accepted as baseline values up to 30 days prior to treatment initiation, if no biologic treatment was administered during this period. On average, neutrophil and lymphocyte counts were available every 7.5 weeks, thrombocyte counts, GOT, and GPT levels were available every 7.4 weeks, and triglyceride levels were available every 8.2 weeks. CTCAE criteria v4.03 (http://evs.nci.nih.gov/ftp1/CTCAE/CTCAE_4.03_2010-06-14_QuickReference_5x7.pdf) were used to grade laboratory abnormalities. CTCAE III–IV° laboratory abnormalities were defined as LAEs.
First, the Wilcoxon signed-rank test, corrected for false discoveries (7), was used for comparison between baseline parameter values and the mean parameter value under treatment. Subsequently, the Kruskal-Wallis test was applied to identify differences among baseline-to-treatment ratios of the 3 biologics, if parameter dynamics were highly significant in the previous test and more than 159 treatment cycles were available. It was followed by a Mann–Whitney U test between, first adalimumab and etanercept, and, if no significant difference was detected in the first step, secondly between the TNF-α antagonists combined and ustekinumab. Correlation between treatment duration and parameter values in the first 180 days of treatment and for later time points was analysed separately using the Spearman’s correlation test. Binary logistic regression was used to identify predictors of CTCAE III–IV° laboratory adverse events. Data was binned into 90-day bins and baseline for visualization. Heat maps were created using Matlab R2016a (Mathworks, Natick, MA, USA).
Values are given as median and interquartile range (IQR), if not specified otherwise. p-values < 0.1 were considered a trend, < 0.05 significant, and < 0.01 highly significant. Statistical procedures were performed using SPSS 22.0 (IBM, New York, USA).
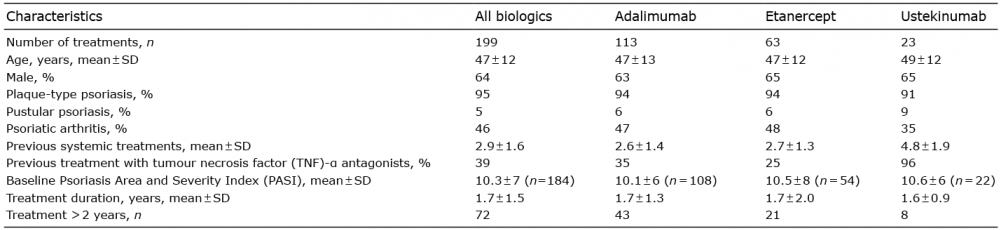
A total of 199 treatments (113 adalimumab, 63 etanercept, 23 ustekinumab), encompassing a total of 340 treatment-years, were included in the present study. With the exception of previous systemic treatments, patient characteristics were largely similar among the 3 subgroups and are summarized in Table I.
Table I. Patient characteristics
The relative difference between baseline values and mean treatment values was calculated in order to robustly assess global dynamics under treatment. Fig. 1A and Table SI show the median baseline-to-treatment difference of the parameters investigated for all biologics combined (Wilcoxon signed-rank test). Neutrophil granulocyte counts (–10.9%; n = 169, p < 0.001) and lymphocyte counts (+11.4%; n = 169, p < 0.001) changed most considerably. Triglycerides (+9.4%; n = 139, p < 0.001) and GOT (+7.0%; n = 172, p < 0.001) increased moderately. CRP values were left-censored.
Fig. 1. Laboratory parameter dynamics. (A) Heat map of baseline-to-treatment relative difference [%] for all biologics (left-hand lane). Baseline-to-treatment relative differences are also shown for tumour necrosis factor (TNF)-α antagonists combined, and the interleukin (IL) 12/23 antagonist ustekinumab, if a significant difference among the individual biologics was found. (B) Lymphocyte counts (median) at baseline and at different time points during treatment for TNF-α and IL 12/23 antagonist treatment, separately. (C) Neutrophil granulocyte and lymphocyte counts as well as triglyceride levels (median and IQR) at baseline and at different time points during treatment for all biologics combined. Leuco: leucocytes; Neutro: neutrophil granulocytes; Lympho: lymphocytes; Thrombo: thrombocytes; Erythro: erythrocytes; Hb: haemoglobin; CRP: C-reactive protein; LDH: lactate dehydrogenase; TG: triglycerides; Chol: cholesterol; GOT: glutamate-oxaloacetate transaminase; GPT: glutamate-pyruvate transaminase; GGT: gamma-glutamyl transferase; BUN: blood urea nitrogen; Crea: creatinine.
Therefore, even though values decreased significantly, the median difference was 0. A significant difference among the individual biologics was only found for lymphocyte count dynamics (p = 0.011, Kruskal-Wallis test) between TNF-α antagonist and anti IL12/23 treatment (p = 0.005, Mann-Whitney U test). Lymphocyte counts increased considerably under TNF-α antagonist treatment (+12.6%; n = 148, p < 0.001), while levels remained stable under anti IL12/23 treatment (±0%; n = 21, p = 0.748; Wilcoxon signed-rank test). Fig. 1B shows median lymphocyte counts of TNF-α antagonist (solid line) and IL 12/23 antagonist treated patients (dashed line) at different time points.
Fig. 1C shows median neutrophil granulocyte and lymphocyte counts, as well as triglyceride levels for all biologics combined at baseline and different time points under treatment. To further characterize parameter dynamics over time, we correlated parameter values and treatment duration over the first 180 days, and subsequent time points, separately (Spearman’s correlation test). The results are presented in Table II. With the exception of triglycerides and GOT, parameter dynamics were generally more pronounced during the first 180 days.
Table II. Parameter dynamics during early and late treatment
Finally, a Spearman’s correlation was performed to assess the relationship of neutrophil granulocyte counts, CRP values, and thrombocyte counts. Neutrophil granulocyte counts were highly significantly correlated to CRP values (r = 0.370, p < 0.001) and thrombocyte counts (r = 0.307, p < 0.001).
Overall, a CTCAE III–IV° parameter deviation was discovered in 8% of patients on treatment. On average, CTCAE III–IV° LAEs occurred after 299 ± 418 days of treatment.
Table SII gives detailed information on the CTCAE III–IV° LAEs. The biologic regime was altered in 2 patients on adalimumab treatment (GPT increase in a patient with concomitant haemochromatosis, and GGT increase because of newly diagnosed liver metastases of a so-far unknown primary tumour). In both cases, however, the liver enzyme elevation was not considered to be causally linked to the biologic treatment by the treating physician (cessation of treatment in good skin condition as a withdrawal trial, cessation of treatment because of malignancy). Other CTCAE III–IV° LAEs were either self-limited, attributed to concomitant treatment (methotrexate) or co-morbidities (alcohol intake, chronic kidney failure).
Overall, 6 CTCAE III–IV° CBC deviations were detected in 2365 complete blood counts performed, 93 CTCAE III–IV° liver enzyme (GOT, GPT, GGT) deviations were detected in 2401 liver enzyme tests, and 2 CTCAE III–IV° creatinine deviations were detected in 2413 creatinine tests.
Previously, we demonstrated that baseline parameters can predict response to infliximab and adalimumab treatment (8, 9). Therefore, we investigated whether patient characteristics also predict CTCAE III–IV° adverse events and may thereby help to guide monitoring. Table SIII gives results of a respective binary logistic regression analysis. No significant predictor was found.
Two patients had CTCAE III–IV° level lymphopaenia (both adalimumab), and 4 patients had CTCAE III–IV° level GGT increase at baseline (2 adalimumab, 2 ustekinumab). Both of the patients with CTCAE III–IV° lymphopaenia at baseline received previous treatments with fumaric acid esters and methotrexate. Among the patients with CTCAE III–IV° GGT increase, one patient reported alcohol abuse, and one patient was previously treated with methotrexate. Other previous treatments were fumaric acid esters, cyclosporine, efalizumab, and infliximab. Lymphocyte counts increased in both patients during treatment without any specific measures. GGT levels slightly decreased under biologic treatment in the 4 patients. GOT and GPT levels never exceeded 111 U/l and 130 U/l, respectively. The 6 patients were treated for a mean of 1.2 ± 1.1 years without laboratory parameter related biologic regime alterations.
This study provides a long-term analysis and comparison of detailed routine laboratory parameter dynamics and CTCAE laboratory adverse events in psoriasis-patients in “real-world” conditions under biologic treatment with adalimumab, a humanized TNF-α antibody, etanercept, a TNF-α decoy receptor, and ustekinumab, an IL12/23 antibody. We believe that this information will be valuable for recommendations on laboratory screening under long-term biologic treatment.
Neutrophil granulocyte, thrombocyte counts, and CRP concentrations decreased under biologic treatment. No significant difference was found among the 4 biologics. Dynamics were pronounced during the first 180 days and stabilized thereafter. Increased markers of systemic inflammation were previously reported in psoriasis patients (10–12) and might be related to overall mortality (13). The reduction in systemic inflammation by biologics, as demonstrated in this study, may directly contribute to the beneficial effects of biologic treatment on cardiovascular risk in psoriasis patients (14). Furthermore, neutrophil granulocytes, whose counts decreased considerably under biologic treatment in the present study, are increasingly recognized as important parts of psoriasis pathogenesis (15, 16). Lymphocyte counts considerably and persistently increased under treatment with TNF-α antagonists. In contrast, lymphocyte counts remained stable under treatment with the IL 12/23 antagonist ustekinumab. TNF-α was previously reported to induce T-cell apoptosis, possibly via TNF receptor-I (17), and to enhance migration of lymphocytes into inflamed tissue (18). Increased lymphocyte blood counts under TNF-α antagonist treatment may reflect the blockade of these mechanisms. Ustekinumab, on the other hand, and generally in line with our results, did not affect the T-cell repertoire in a recent study (19). Dermatological diseases, in particular psoriasis, are increasingly defined by their immunological signature (20), and differential effects of anti-psoriatic treatments on leucocyte subsets on a microscopic, as well as on a molecular level, may contribute to a personalized treatment choice in the future. Finally, triglyceride levels increased significantly under biologic treatment. This is in line with similar reports in TNF-α antagonist treated rheumatoid arthritis patients (21). Since mild to moderately increased triglyceride levels confer a cardiovascular risk (22), screening may be warranted in selected patients.
Eleven of a total of 15 CTCAE III–IV° LAEs involved increased liver enzymes. These laboratory abnormalities were, however, either self-limited or attributed to concomitant treatment (methotrexate) or pre-existing medical or psychological conditions (alcohol intake). In some patients no reason for liver enzyme increase was found. Alcohol abuse may, however, be more prevalent in psoriasis patients (23, 24), and one may speculate that alcohol abuse may have remained undetected in some of these latter cases. Even though liver enzyme related LAEs were therefore probably not a direct consequence of biologic treatment in most cases, given the overall increase of liver enzymes under treatment, screening may be warranted depending on concomitant treatment and comorbidities. CTCAE III–IV° creatinine increase was only observed in a single patient with pre-existing chronic kidney disease. The treatment regime was not altered. Even though neutrophil counts decreased significantly under biologic treatment, only a single case of CTCAE III° neutropaenia (0.6/nl) occurred and resolved spontaneously. Reports of serious neutropaenia under treat-ment with etanercept (25, 26) and adalimumab (27) do, however, exist in rheumatoid arthritis patients. The disappearance of neutrophil granulocyte activation antigen CD69 in rheumatoid arthritis patients on treatment with adalimumab (28) and alterations of the activation markers CD62L and CD11b under treatment with infliximab and ustekinumab (29) were reported. Other specific alterations in neutrophil granulocyte function, such as chemotaxis or reactive oxygen production by TNF-α antagonists, were, however, not sufficiently demonstrated to date (30, 31). In the present study, neutrophil counts correlated with CRP values and thrombocyte counts. This suggests that the observed reduction of neutrophil counts may, to some extent, reflect a reduction of systemic inflammation to normal levels. Six patients were started on biologic treatment even though they had a CTCAE III–IV° baseline GGT increase or lymphopaenia. No laboratory parameter induced alterations of the biologic regime were necessary during a mean of 1.2 years of treatment.
Finally, we analysed possible predictors of LAEs. Given the respective confidence intervals, it is highly unlikely that age and previous treatments considerably predict CTCAE III–IV° LAEs. These parameters are therefore unlikely to help the selection of a specific patient population that may benefit from frequent routine laboratory testing. A protective effect of male sex may have been missed due to the sample size. Given the broad confidence interval, no conclusive statement can be made on the predictive effect of psoriatic arthritis.
Currently, the AAD (1), JDA (2) and EADV (3) recommend monitoring of the CBC and a comprehensive metabolic panel under biologic treatment. According to the German schedule for physician fees (GOÄ, http://www.aerztekammer-bw.de/10aerzte/42goae/volltext.pdf, accessed November 4th, 2016), a CBC including venipuncture is compensated with 7.00€, a liver enzyme test (GOT, GPT, GGT) including venipuncture is compensated with 9.32€, and a creatinine test including venipuncture is compensated with 4.66€. The following calculation is based on data of 199 biologic treatments, a total of 340 treatment-years. Approximately 2,759€ (394 CBCs) had to be invested to detect a CTCAE III–IV° CBC deviation, approximately 5,622€ (1207 creatinine tests) had to be invested to detect a CTCAE III–IV° creatinine deviation, and approximately 241€ (26 liver enzyme tests) had to be invested to detect a CTCAE III–IV° liver enzyme deviation. These estimates do not include indirect and follow-up costs, such as loss of working hours or additional tests.
Although limited by its retrospective design, the strengths of this study are its real-world setting, the description of parameter dynamics at a high temporal resolution, and the long observation period (36% of treatments had a duration of more than 2 years). The gender, age, and PASI of our study population are comparable to registry data reported for psoriasis patients on systemic treatment in Germany (32). The power to detect a medium effect (Cohen’s d) of biologic treatment on baseline-to-treatment dynamics was higher than 99% for all parameters (Wilcoxon signed-rank test, G*power 3.1 (33)). Subsequent testing was only done if at least 159 treatment cycles were available. Overall, the power to detect a medium effect size difference among the baseline-to-treatment dynamics of the individual biologics was therefore higher than 80% (Kruskal-Wallis test, approximated by a 3-group analysis of variance (ANOVA) (34), G*power 3.1). Considering the given, unequal sample sizes, this roughly translated to an 80% power to detect a medium-to-large effect size difference of ustekinumab dynamics compared with TNF-α antagonists, if the dynamics of the TNF-α antagonists were assumed to be equal. While patients treated with ustekinumab had a higher number of previous treatments, baseline parameter values were very similar among the biologics. All other patient characteristics of the biologic groups were comparable.
Our main findings are that: (i) parameter dynamics were most pronounced for markers of systemic inflammation, in particular PMN counts, and triglycerides, (ii) dynamics were most pronounced early during treatment, (iii) CTCAE III–IV° laboratory adverse events most commonly affected liver enzymes, and (iv) CTCAE III–IV° laboratory adverse events were mostly self-limited and did not require alteration of the biologic regime. Finally, (v) lymphocyte count dynamics differed significantly between TNF-α antagonist and IL12/23 antagonist treatment and may reflect differential immunological effects on lymphocyte subsets.
Our data suggest that liver enzyme and triglyceride screening may be warranted in some instances, while unguided monitoring of other routine laboratory parameters, if not required for another medical condition or concomitant treatment, is unnecessary under long-term biologic treatment.
We acknowledge the financial support of the Deutsche Forschungsgemeinschaft and Ruprecht-Karls-Universität Heidelberg within the funding program Open Access Publishing.
The authors declare no conflicts of interest.


 Click to show fullsize
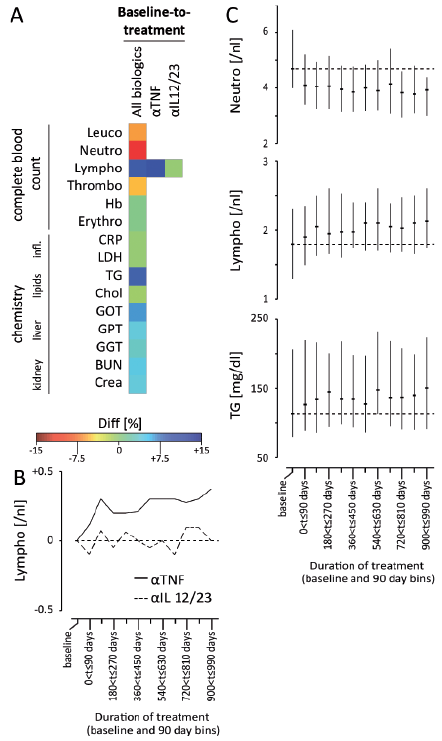 Click to show fullsize
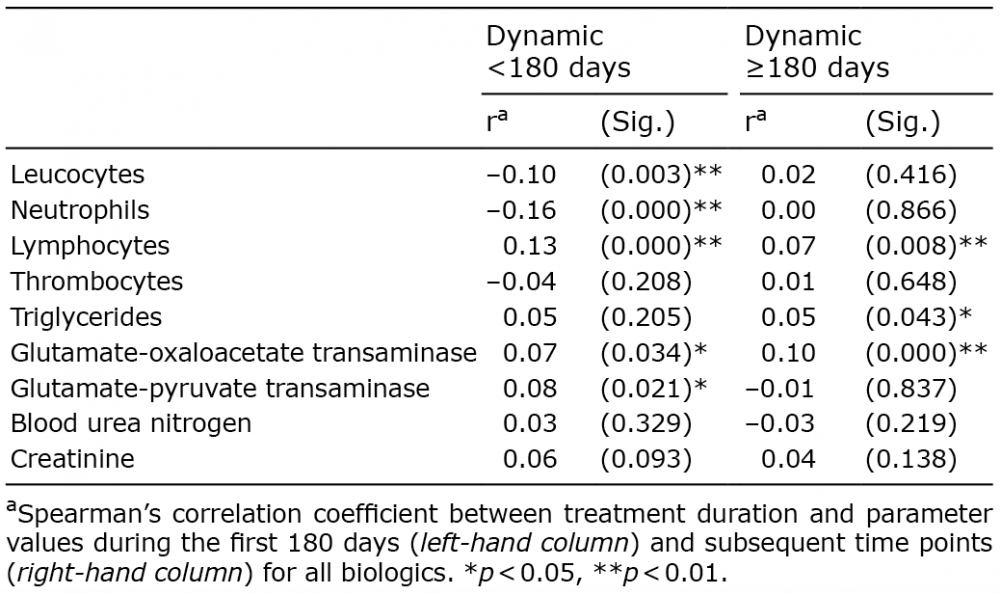 Click to show fullsize