


1Institute of Medical Informatics, University of Münster, and 2Center for Chronic Pruritus, University Hospital Münster, Münster, Germany
In order to improve diagnosis and treatment, physicians require information about the social context and quality of life of their patients. The Center for Chronic Pruritus at the University Hospital Münster achieves this goal using the electronic patient-reported outcome system “Mobile Patient Survey”, which assesses pruritus and quality of life measures. The aim of this study is to evaluate the consistency and reliability of such measures. A total of 42 patients, age range 19–82 years, participated in the study and were asked to assess the measures at baseline via a paper questionnaire, and to use the “Mobile Patient Survey” at baseline and after 1 h in order to test reliability. Statistical analysis was performed using coefficient rc for metric variables and weighted kappa κw for categorical variables. The internal consistency of all measures was unaffected. It was shown that 6 out of 7 measures can be assessed without loss of reliability. It is recommended that questionnaires for electronic usage are assessed for validity and reliability.
Key words: validation; patient-reported outcome measures; pruritus.
Accepted Sep 19, 2017; Epub ahead of print Sep 20, 2017
Acta Derm Venereol 2018; 98: XX–XX.
Corr: Michael Storck, Institute of Medical Informatics, University of Münster, Domagkstraße 9, DE-48149 Münster, Germany. E-mail: michael.storck@uni-muenster.de
In order to provide the best healthcare treatment, physicians require knowledge not only of a patient’s clinical history, but also of their corresponding social context and quality of life. With increasing workload, the time clinicians can spend with their patients, and thus the possibility to collect this information, is decreasing (1). Patient data reported by the patient without interpretation of the patient’s response by a clinician, so called “patient-reported outcomes” (PRO) (2), can be helpful for better understanding of the patient’s social context and his/her perception of the illness, which enhances patient diagnosis and treatment.
Patient-based data is usually gathered via paper and pencil (P&P) questionnaires. Electronic collection of PROs offers several advantages compared with P&P: reduction in errors produced by typewriting; reduction in missing data by requiring completion; and reduction in invalid data through implementation of skip patterns, among others (3). In order to overcome the drawbacks of P&P questionnaires, some projects use an electronic PRO (ePRO) system allowing the patient to answer a digital survey (4). At the University Hospital Münster (UKM), such a system, called the “Mobile Patient Survey (MoPat)”, was implemented prototypically in 2010 and re-implemented in 2014 (5). MoPat is a web-based survey system that allows patients to complete multilingual digital questionnaires. The results are automatically sent to the electronic health record and/or research database.
The first department to use MoPat in routine care was the Center for Chronic Pruritus (CCP) of the UKM (6). To date, several PRO measures have been collected with MoPat, including: visual analogue scale (VAS) (7); numerical rating scale (NRS) (7); verbal rating scale (VRS) (7); dynamic pruritus score (DPS) (8); Dermatology Life Quality Index (DLQI) (9); Hospital Anxiety and Depression Scale (HADS) (10); and ItchyQoL (German version) (11).
All of these PROs have been validated as P&P tools. Due to the importance of assessment validity and reliability, the corresponding electronic version of these tools should also be validated. We assume that aspects of validity other than reliability are mostly unaffected by the mode of assessment (P&P vs. ePRO). Therefore, the relevant aspect of validity when switching from P&P to ePRO is reliability, and by confirming reliability and internal consistency, validity is also confirmed. The aim of this study is to evaluate the internal consistency and reliability of the electronic versions of the above-mentioned assessment tools implemented within MoPat.
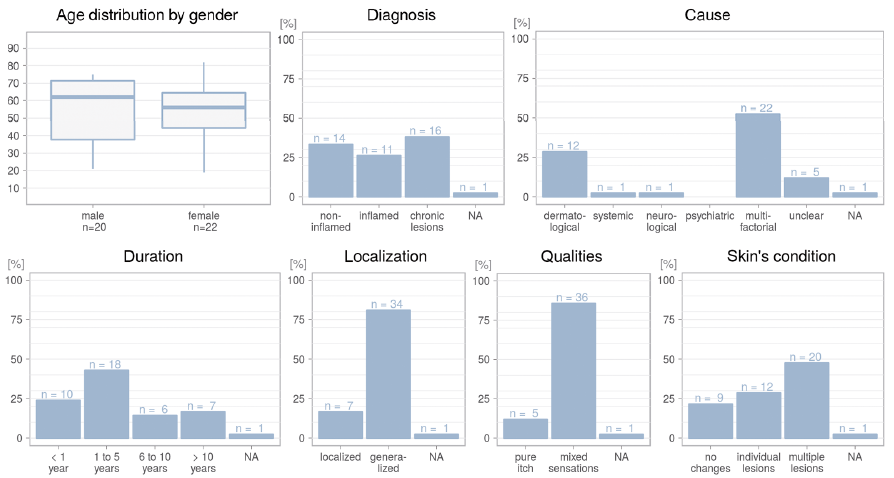
During the 12-month period to October 2015, 42 subjects (20 males and 22 females) aged ≥ 18 years with chronic pruritus (CP) of an intensity of at least 2 points on the NRS (mean over 24 h) were recruited in the CCP to participate in the study. The patients’ ages range from 19 to 82 years, median age 58 years. Other demographic data including diagnosis and cause of itch, presented according to the International Forum for the Study of Itch (12) are shown in Fig. 1.
Fig. 1. Characteristics of the study population (patients with chronic pruritus), including diagnosis and cause of itch, presented according to the International Forum for the Study of Itch (12). NA: not available.
The aforementioned PROs were implemented within MoPat. The participants were asked to complete the P&P version of the questionnaires and the MoPat version on an Apple iPad at baseline. After 1 h, the participants then re-answered the PROs using the MoPat. The data from the P&P PROs was typewritten and combined with the MoPat export in an Excel file for data cleaning. Statistical analysis was conducted with R (13) (version 3.3.3), using RStudio (version 1.0.136). All subjects provided written informed consent for data collection and analysis. The ethics committee of the University of Münster approved the trial (number 2014-385-f-S) and it was registered at the German Clinical Trials Register DRKS00009902.
The focus of this study is on reliability, i.e. the comparison between P&P and ePRO answers of the symptom assessment by VAS, VRS, NRS and DPS and quality of life assessment through DLQI, HADS and ItchyQoL and the comparison of the 2 MoPat surveys collected with a time interval of 1 h. Reliability measures were computed for questionnaire scores and individual questionnaire items.
Regarding reliability, categorical and metric items and scores need to be differentiated. In the case of metric variables, we hypothesize a one-to-one linear relationship, and thus the concordance correlation coefficient rc is used as measure of agreement (14). For the complete picture, one should inspect a scatterplot, in which observations are expected to lie on the bisecting line. In the case of ordinal or mixed nominal-ordinal variables, a meaningful measure of agreement is the weighted kappa (κw) statistic. In analogy to the scatterplot, one can inspect heatmap-like confusion matrix plots for a more in-depth view of the relationship.
κw measures the proportion of weighted agreement corrected for chance agreement (15). Here, for the sake of simplicity, equal-spacing, i.e. symmetrical linear weights in the zero-one range based on absolute deviations, were used for any ordinal variables. These weights act on the assumption of Likert-like equal-spacing between each adjacent pair of ordered categories. In case of DLQI items containing the category “not relevant” a weight of zero agreement was assigned to any misclassification within this category.
Internal consistency was assessed mainly as a means of verification in comparison with the measures reported in the original publications of the questionnaires (P&P validity evaluations) (9, 10, 16–18). With the exception of DLQI validation (employing pairwise rank correlations) (9) the internal consistencies of the questionnaires under consideration were all originally evaluated using Cronbach’s α. Therefore, we computed α as an empirical statistic, making no assumptions, and informally compared the results with the values reported in the above-mentioned P&P validation studies.
After using MoPat the participants answered a short questionnaire about user acceptance. User acceptance evaluation consisted of 4 main yes/no questions, including: “Did you get along well using the iPad for data entry?”; “Did you have any problems using the touch-screen interface?”; “Was it helpful to answer the questions one by one?” and “Would you like to use the iPad in routine care?”.
Fig. 2 shows confusion matrix plots of Cohen’s κ with equal-spacing weights for ordinal variables (VRS, NRS) and scatterplots of concordance correlations for metric variables (VAS, DPS). Observations are expected to lie on the bisecting lines, emphasized by an orange line for P&P–MoPat and a blue line for MoPat–MoPat comparisons.
Fig. 2. Confusion matrix plots for verbal rating scale (VRS), numerical rating scale (NRS) showing Cohen’s κ, and scatterplots showing concordance correlation for visual analogue scale (VAS) and dynamic pruritus score.
In the confusion matrix plots, normalized proportions are given by grey shadings, from white for 0 to black for 1. Thus, white cells have no observations and a black cell corresponds to 100% of observations from respective row and column combinations within that cell. The numbers of actual observations are added for all non-zero cells. The agreement of both P&P vs. first MoPat survey (MoPat1) and MoPat1 vs. second MoPat survey (MoPat2) are considered good for VRS and NRS.
In the scatterplots (Figs 2 and 3), a linear model fit was included with 95% pointwise confidence intervals around the mean. The regression line depicts the linear relationship fit to the data, which together with the spread of the data, would be reflected in the product moment correlation. The concordance correlation also incorporates deviations from the agreement line. Note the influence of so-called outlying or influential observations, both on the linear regression line and the correlation coefficient.
Fig. 3. Reliability of scores on the Dermatology Life Quality Index (DLQI), ItchyQoL, and Hospital Anxiety and Depression Scales (HADS-A and HADS-D), using scatterplots showing concordance correlation.
As shown in Fig. 2, agreement of VAS today P&P–MoPat1 is very good, with a concordance correlation of 0.94. However, in the MoPat–MoPat comparison the few outlying observations decrease the concordance correlation to a still-good value of 0.86. The DPS has a low P&P–MoPat1 correlation of 0.29, but it is comparable to the VAS today when assessing agreement between the 2 MoPat surveys.
Fig. 3 summarizes the concordance correlations for the calculated scores of the questionnaires DLQI, ItchyQoL and HADS. Since the DLQI is not applicable for subjects with non-inflamed skin, the correlation was calculated only for the corresponding subset. Almost all scores correlate very well in both reliability analyses, except for the DLQI score, which has one outlier in the P&P–MoPat1 comparison, which still results in a good concordance correlation of 0.84.
The boxplots shown in Fig. 4 summarize the item agreements of the above-mentioned scores measured by κw. The median of the κ values is above 0.7 in all cases (good agreement), while the median for MoPat1–MoPat2 comparison is always slightly higher than the median for P&P–MoPat1. Approximately 75% of all item comparisons have a κ value of at least 0.7. There is a single outlier with a medium agreement of 0.5, namely question 14 in the ItchyQoL.
Fig. 4. Item agreement of the Dermatology Life Quality Index (DLQI), ItchyQoL, and Hospital Anxiety and Depression Scale (HADS) using boxplots showing Cohen’s weighted kappa.
Summing up, the agreement between the P&P and the ePRO assessment using MoPat is reasonably good for the aggregated scores. The only exception of poor agreement was found for the DPS. Even higher agreement has been observed for the reliability between repeated assessments using MoPat.
The computed Cronbach’s αs for the DLQI, the 4 subscales of the ItchyQoL (symptoms, functioning, feelings and self-perception) and the 2 HADS subscales (anxiety and depression) can be seen in Table I. Since the internal consistency of the DLQI has not been evaluated using Cronbach’s α, it is not possible to compare the results with the initial validation. However, Cronbach’s α was assessed in 22 international studies from 1994 to 2007 and ranged from 0.75 to 0.92 (19), while this study encountered similar α values for the P&P version and the 2 MoPat surveys. The ItchyQol was translated and adapted for German patients using the 4 subscales symptoms (α = 0.76), functioning (α = 0.85), feelings (α = 0.86) and self-perception (α = 0.86) (11). The version implemented within MoPat achieved similar α values. A review of validity of the HADS reported the mean Cronbach’s α for the 2 subscales anxiety (0.83) and depression (0.82) (17). The electronic version within MoPat is similarly consistent.
Table I. Cronbach’s α measurements for Dermatology Life Quality Index (DLQI), ItchyQoL, and Hospital Anxiety and Depression Scale (HADS) subscales
First, all 42 participants were asked if they got along well with data entry using the iPad. A total of 37 answered positively, while 3 answered negatively. Nearly the same 3 participants had problems using the touch-screen interface for data entry, but most participants (n = 39) stated that they liked answering questions one by one. Five participants, including 3 who were nearly 80 years of age, stated that they would not like to use MoPat in the routine care setting.
The validity of the MoPat version of key pruritus PRO measures was investigated with regard to internal consistency and reliability. Overall, the consistency and reliability is good and in line with other ePRO studies, with the exception of the DPS between P&P and MoPat. Other aspects of validity can be explored by comparing scores measuring similar concepts, and by modelling the dependency on external variables, such as age, sex, and diagnosis. Since all of the P&P tools had been validated previously, these aspects were not addressed in the current study.
Regarding the weighting in κw, another widely used scheme for ordinal categories is quadratic weights, which would better resemble the structure of the product-moment correlation r, and thus also of the concordance correlation rc (this would allow for even stronger agreement between deviating measurements; we chose the more conservative version). In case of DLQI items that contain a category “not relevant”, a weight of zero agree-ment was assigned to any misclassification. Missing values were ignored.
In their recommendations for the use and interpretation of κ (20) the authors recapitulate that the statistic can be affected by prevalence, bias, and non-independence of ratings. In our setting, prevalence can be considered irrelevant, as every patient is his/her own rater for all measurements. On the other hand, bias due to unbalanced marginal distribution is exactly what we are interested in, hypothesizing no difference between ascertainment via P&P and MoPat (and even more so between repeated measurements using MoPat). The only difficulty that arises is that answers might be considered non-independent because of memory carry-over effects from repeated measurements. This must be seen as a general, but hardly avoidable, weakness of the current study. Thus, any agreement measure might be greater than true agreement due to this kind of bias. Interestingly, the observed κ tended to be higher for MoPat–MoPat comparison, although the time-span between data collections was longer.
Coefficient α, as introduced by Cronbach, was intended as an index of equivalence (21). It has become very popular, but has also been criticized, mainly for making strong assumptions that are rarely met in practice, and of which practitioners seem to be unaware. Some alternatives have been proposed (e.g. 22). Nevertheless, internal consistency was assessed with coefficient α to enable comparison with the measures reported in the original evaluations (9, 10, 16–18).
Although the reliability of the PRO measures was mostly very high, the concordance correlation of the DPS was poor when transferring the measure from P&P to MoPat. The original score is a line ranging from strongly worsened (–100) to almost no further pruritus (100) with 7 marked steps in between (8). In the MoPat the score was mapped to a slider question with 201 steps, with text only at the beginning and the end, and without additional markings in-between. Fig. 1 shows that, in the paper version, the patients primarily chose the given markings, thus they mostly use it like a 9-point Likert scale. Without markings in MoPat, the answers were not so precise, which leads to a low agreement. This was recently shown in a study on the validation of an app for smartphones, which changed the DPS into multiple questions, resulting in a moderate Spearman correlation of 0.46 (23). As the paper version defines several anchors, which can be important to calculate the minimal important difference, or the clinically meaningful change in the symptom course, it is desirable that the DPS is used in its original version (8) on the MoPat or other devices, at least in clinical trials. Concerning the other outlier, particularly question 14 of the ItchyQoL, it is not possible to provide a sufficient explanation. All questions and answers on the ItchyQoL are syntactically similar and are displayed in the same manner in the MoPat and the P&P versions.
Although the validation of pruritus measures was assessed using only German questionnaires, MoPat supports multilingual surveys. The questions and answers may be displayed in different languages, but the graphical interface is unchanged. Although one might expect this would not affect the validity, reliability, usability and user acceptance, this should be examined further. In particular, user acceptance should be evaluated with a higher number of participants in order to analyse in more detail the effect of the age of the participants.
In conclusion, this study shows that most of the given PROs can be assessed with electronic systems, such as MoPat, without loss of reliability. Only the DPS has to be redesigned and revalidated to ensure valid assessment using MoPat. Although this study demonstrates that an ePRO system, such as MoPat, delivers reliable results compared with P&P, it is recommended that new questionnaires are validated for usage with ePRO systems in order to ensure the validity and reliability of the answers. MoPat will be developed further in order to improve the validity and reliability of P&P questionnaires to ePROs through better integration of P&P questionnaires in MoPat. Furthermore, user acceptance and usability will be evaluated taking multilingual surveys into special consideration.
The authors have no conflicts of interest to declare.


 Click to show fullsize
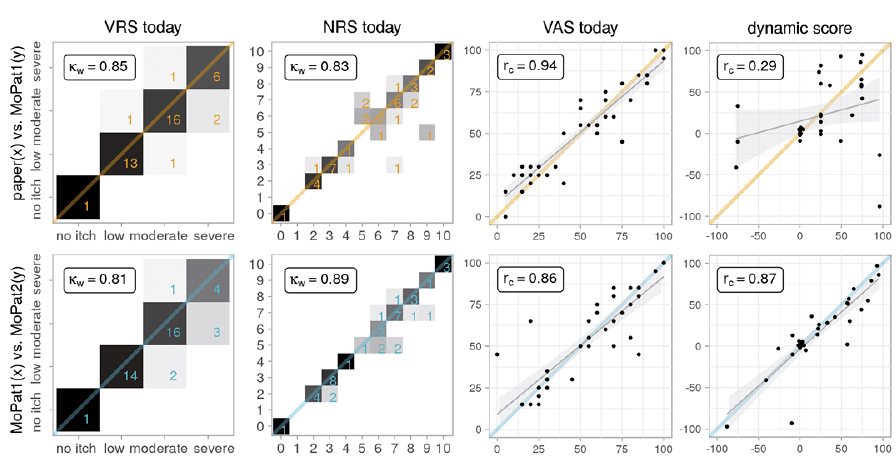 Click to show fullsize
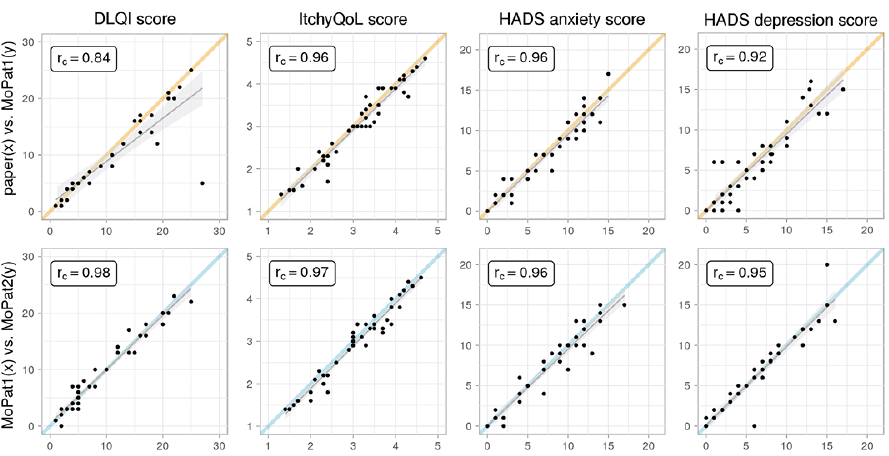 Click to show fullsize
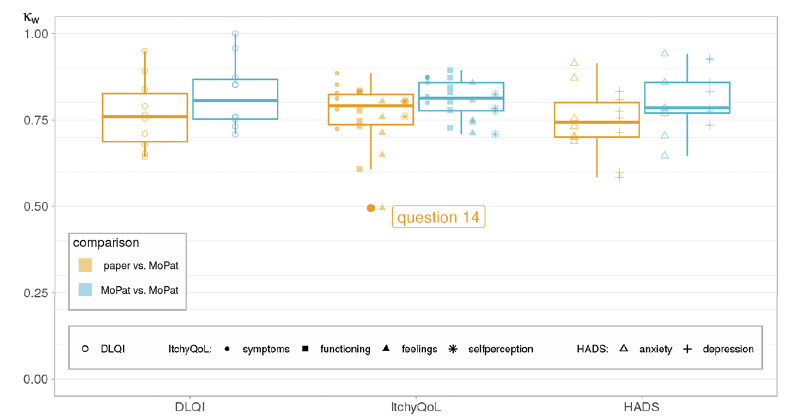 Click to show fullsize
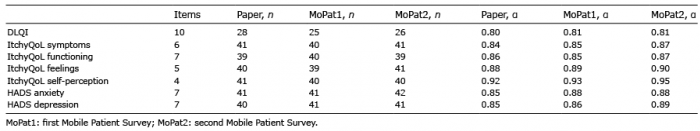 Click to show fullsize