


1Department of Dermatology, 2GROW, School for Oncology and Developmental Biology, Maastricht University Medical Centre, Maastricht, 3Department of Dermatology, Flevo Hospital, Almere, 4Department of Medical Microbiology and Infection Prevention, Groene Hart Ziekenhuis, Gouda, and 5Department of Epidemiology, Maastricht University, Maastricht, The Netherlands
To adequately identify patients at risk for surgical site infection in dermatological surgery and effectively prescribe antibiotic prophylaxis, a prediction model may be helpful. Such a model was developed using data from 1,407 patients who underwent dermatological surgery without antibiotic prophylaxis. The multivariable logistic regression model included type of closure, tumour location and defect size as risk factors. Bootstrapping was used for internal validation. The overall performance of the model was good, with an area under the curve of 84.1%. The decision curve analysis showed that the model is potentially useful if one is willing to treat more than 8 patients with antibiotic prophylaxis to avoid one infection. For those who prefer more restrictive use of antibiotic prophylaxis, a default strategy of treating no patients at all with prophylaxis would be the best choice. External validation of the model is required before it can be widely applied.
Key words: surgical site infection; antibiotic prophylaxis; dermatological surgery; prediction model.
Accepted Apr 12, 2018; Epub ahead of print Apr 12, 2018
Acta Derm Venereol 2018; XX: XX–XX.
Corr: Xiaomeng Liu, Department of Dermatology, Maastricht University Medical Centre, P. Debyelaan 25, NL-6229 HX Maastricht, The Netherlands. E-mail: xmxmliu@gmail.com
Surgical site infection is one of the complications of dermatological surgery and could be prevented by antibiotic prophylaxis. To limit the overuse of antibiotics, the correct identification of patients at risk for such an infection is very important. A prediction model was developed in the current study for this purpose. This model adequately predicts the risk of surgical site infection based on the type of wound closure, the anatomical location and the size of the wound. Application of the model can help dermatologists to predict the risk of surgical site infection and effectively prescribe antibiotic prophylaxis prior to surgery.
Surgical site infection (SSI) is a major concern in dermatological surgery. It impairs wound healing and could worsen cosmetic outcome. Although rare, systemic infection might also result from a SSI and is associated with substantial morbidity. Fortunately, the incidence rate of SSI is generally below 5% (1–8). Despite the low rate of SSI, however, many dermatological surgeons prescribe antibiotic prophylaxis on a regular basis (9–11). The over-use of antibiotics could lead to a range of adverse events, including allergic reactions. According to a recent study from the USA, adverse events due to systemic antibiotics accounted for 14.1% of visits to the emergency department (12). In addition, over-prescribing of antibiotics will result in increased antimicrobial resistance (13). Therefore, antibiotic prophylaxis should be considered only when there is a substantial risk of SSI.
In our previous study on SSI after dermatological surgery, specific risk factors that increase the risk of acquiring a SSI have been identified, including the location of the tumour, size of the defect and the method of closure (14). Other patient-, environment- and procedure-related factors have been studied with conflicting results (1–8). To adequately assess the risk of SSI in a clinical setting, the combination of different risk factors in each patient should be evaluated. Clinical prediction models could serve this purpose by risk estimation for individual patients based on combinations of multiple predictors. Currently, such a prediction model is not available for dermatological surgery.
Correctly identifying the patients at risk for SSI could minimize the overuse of antibiotic prophylaxis and reduce the rate of SSI. The aim of this study was to develop a clinical prediction model to facilitate the decision whether to give antibiotic prophylaxis, based on individual risk of SSI in patients undergoing dermatological surgery.
A retrospective cohort study was conducted at the Department of Dermatology, Maastricht University Medical Centre (14). All patients who received surgery under local anaesthesia from April 2014 to April 2015 were included. A waiver to obtain written informed consent was authorized by the local medical ethics committee because the study protocol did not involve deviations from standard care. Patients with biopsies, curettages, shave-excisions or laser procedures were excluded. Patients who received antibiotics in the perioperative period (1 month prior to or after the procedure) were also excluded. Data on patient-, operation- and lesion-related characteristics were retrospectively collected from the electronic patient charts. Further details of these characteristics are described in an earlier publication (14). For patients receiving multiple procedures in the study period, only the first procedure was included because observations in the same patients are likely to be correlated.
To verify whether patients experienced SSI, patients received follow-up at least until suture removal. Patients who had not returned for suture removal were contacted by phone 2–3 weeks post-surgery and were questioned about adverse events including SSI. Patients were additionally instructed to contact the department if any adverse events occurred after the phone call. In case of a SSI, patients were followed until the wound had healed (14). SSI was defined as the presence of local symptoms indicative of wound infection (purulent drainage, pain, swelling, erythema and/or heat) occurring within 30 days after the surgery verified by a positive culture.
In the previous study we identified type of closure, tumour location and defect size as significant risk factors (14). These factors were selected for incorporation in the prediction model.
The location of the tumour on the ears was associated with a significantly higher risk of SSI compared with the head and neck area as a reference group. Although not statistically significant, localization on the upper extremities and trunk was associated with lower risk of SSI compared with head and neck area, while slightly higher risk of SSI was found for lesions on the lower extremities. Therefore, tumour location was categorized into 4 categories: (i) head and neck area except ears, (ii) ears, (iii) trunk/upper extremities, and (iv) lower extremities. The defect size was categorized into 3 groups: < 2 cm2, 2–4 cm2 and 4 cm2. Flaps and closure by secondary intention were associated with significantly higher risk compared with primary closure as a reference category. Grafts and delayed closure were not associated with increased risk. For this reason, type of closure was categorized into primary closure, flaps, grafts/delayed closure and closure by secondary intention.
Multivariable logistic regression analysis was used for development of the prediction model. The dependent variable was SSI (yes vs. no) and type of closure, tumour location and defect size were entered as independent variables. Reference categories were: “primary closure” for type of closure, “head and neck except ears” for tumour location, and “size < 2 cm2 “for defect size. Regression coefficients and odds ratios (OR) with 95% confidence interval (CI) were calculated. A nomogram was constructed to facilitate clinical calculation of the risk score for each patient based on the individual combination of risk factors.
The area under the receiver operating characteristic curve (AUC) and the Brier score were used to evaluate the performance of the prediction model. The AUC indicates how well the model can discriminate between patients with and without SSI and ranges from 0.5 (no discriminative ability) to 1.0 (perfect discriminative ability). To evaluate goodness of fit of the model, a scaled Brier score, corrected for the prevalence of SSI in the studied population, was calculated. The Brier score quantifies the distance between predicted and actual outcomes and has a range between 0 (best score achievable) and 1 (worst score achievable) (15). To evaluate calibration, the predicted probabilities of SSI are plotted against observed probabilities in a calibration plot.
As an internal validation step, bootstrapping was performed. A total of 1000 bootstrap samples were drawn from the original sample to mimic drawing samples from the underlying population. The aim of bootstrapping is to estimate how well the prediction model will perform on a hypothetical set of new patients. The prediction model was fitted in each bootstrap sample and tested on the original sample. To adjust for overfitting, the original regression coefficients have to be multiplied by a shrinkage factor obtained by bootstrapping. Furthermore, bootstrapping allows correction for optimism in the performance measures (AUC and Brier score) (16).
A net benefit analysis is presented to evaluate whether the application of the prediction model does more good than harm. Correct identification of patients at risk for SSI (true positive rate) is beneficial, but unnecessary antibiotic prophylaxis in patients who would not develop a SSI (false positive rate) is harmful. Net benefit is a weighted sum of true positive minus false positive classifications (17). Net benefit of a prediction model should be higher when compared with alternative strategies: prescribing all patients antibiotic prophylaxis (treat all) or prescribing no prophylaxis at all (treat none).
The key concept in this analysis is the threshold probability, which depends on the relative weight that is given to false positive and true positive classifications. True positives are usually valued higher than false positives; missing a patient with SSI, who should have received antibiotics, is in general considered as a more serious error than unnecessary treatment with antibiotics. In net benefit analysis the relative weights of harms and benefits are set by the threshold probability. For example, a threshold probability of 0.05 corresponds to the willingness to treat 20 patients in order to prevent one infection. In other words, the false positive classifications are valued at 1/19th of true positive classifications. When the prediction model is applied, patients with a predicted probability exceeding the chosen threshold probability will receive antibiotics, while the remaining patients will not.
In practice, it is often difficult to define an optimal threshold probability, because relative weight of harms and benefits may differ for different doctors and patients. Decision curves are used to plot the net benefit of treating patients according to the prediction model relative to net benefits of the alternative strategies (treat all or treat none) over a range of plausible threshold probabilities.
Analyses were performed using STATA version 13 (StataCorp LP, TX, USA) and R version 3.3.2 (R Foundation for Statistical Computing, Vienna, Austria).
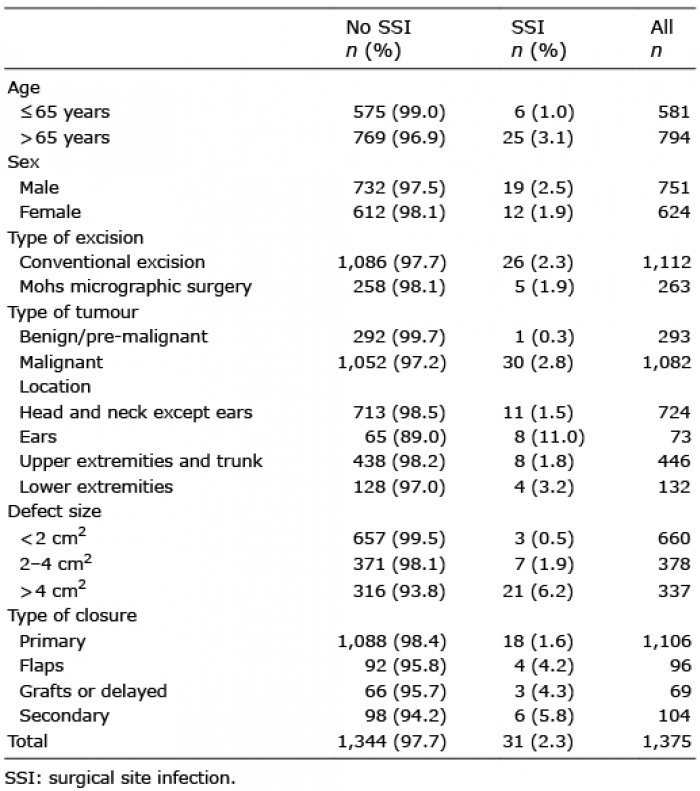
In total, 1,407 patients received surgery without antibiotics in the studied period. Thirty-six patients were excluded because they received antibiotics in the peri-operative period. There were no significant differences between this group and the study group in baseline characteristics. Wound culture was not available in 32 patients and therefore the outcome of SSI could not be verified. To enable valid comparison of patients with verified SSI and patients without SSI these 32 patients were excluded, leaving 1,375 patients (624 females and 751 males) for analysis. The mean age in the studied population was 65 years (range 6–97 years). Thirty-one patients had clinically suspected SSI that was confirmed by wound culture (2.3%). In most of these cases, wound culture confirmed presence of Staphylococcus aureus. Baseline characteristics are shown in Table I.
Table I. Baseline characteristics
Table II shows the results from the multivariable logistic regression analysis incorporating the pre-specified risk factors. Closure by flaps or secondary intention, location on the ears and larger defect size were associated with higher risk of SSI. Internal validation by bootstrapping (n = 1,000) resulted in a shrinkage factor of 0.83. The original regression coefficients were multiplied by this factor to calculate the final regression coefficients (Table II).
Table II. Regression coefficients and odds ratios before and after bootstrapping
The mathematical formula for the prediction model is calculated as follows:
The model calculates the predicted probability (p) of SSI for each patient in the dataset. To facilitate the computation of p clinically, a nomogram was constructed (Fig. 1). Each studied characteristic was given a 0–100 score according to the nomogram. The sum of the individual scores corresponds to a specific probability of SSI.
Fig. 1. Nomogram for the calculation of probability of surgical site infection with an example for a patient with a 3 cm2 defect on the ear closed by secondary intention. Step 1: Read the number of points corresponding to each individual risk factor: 67 for ears, 50 for 2–4 cm2, 40 for secondary closure (black arrows). Step 2: Add the numbers up: 67+50+40=157. Step 3: Draw a vertical line between “total points” and probability to read the probability of infection for this patient: 157 points corresponds to a predicted probability of 0.11 (white arrow).
For example, for a patient with a defect on the ear with size 3 cm2 that is closed by secondary intention, p can be inferred from the nomogram. Location on the ears receives 67 points. Size 2–4 cm2 receives 50 points. Closure by secondary intention receives 40 points. A total of 157 is calculated by summing-up these individual scores, which corresponds to a predicted probability of 0.11.
The calibration plot shows agreement between predicted probability and actually observed probability (Fig. 2). The Brier score is 0.023, with a scaled Brier score of 0.039. The ability of the model to discriminate between patients with and without SSI is visualized by the ROC curve, which shows the trade-off between sensitivity and specificity at various cut-off values of the predicted probability of SSI. The AUC is 84.1% (77.0–91.2%).
Fig. 2. Calibration plot showing agreement of the predicted probability with the observed rate of surgical site infection.
The values for predicted probability ranged from 0.4% to 30.2% for the study population with an incidence of 2.3%. Table III shows the combinations of sensitivity and specificity at various cut-off values of the predicted probability of SSI. At a cut-off value of > 0.01, sensitivity = 97% and specificity = 42%. At higher cut-off values, the sensitivity decreases and specificity increases. At a cut-off value > 0.05, sensitivity is 45% and specificity is 93%. Predictive values (PPV and NPV) depend on the prevalence of SSI.
Table III. Sensitivity, specificity, positive and negative predictive values (PPV and NPV) cut-off values of the predicted probability
The prediction of a model with an AUC of 84.1% is good, but not perfect. Therefore, a net benefit analysis was performed to evaluate under which conditions use of the model provides higher benefit than alternative strategies. A decision curve shows the relative net benefit over a range of threshold probabilities from 0.01 to 0.20 (Fig. 3) for 3 strategies: (i) always prescribe antibiotic prophylaxis for patients undergoing dermatological surgery (treat all), (ii) never prescribe antibiotic prophylaxis (treat none), and (iii) prescribe antibiotic prophylaxis only for patients with a predicted risk of SSI exceeding the threshold. It can be observed that the net benefit of treating according to the model is higher than the net benefit of the alternative strategies for thresholds between 0.01 and 0.125, but not for thresholds exceeding 0.125. This means that the model may be useful for patients and doctors who attach much higher value to preventing an infection than to unnecessary prophylactic treatment with antibiotics and are willing to treat at least 8 patients (1/0.125 = 8) to prevent one SSI. For those who advocate more restrictive use of antibiotic prophylaxis and are not willing to treat more than 8 patients to prevent one SSI, the default strategy of treating no patients at all is the better choice in a population with low incidence of SSI. The net benefit of the strategy of “treat all” has the lowest benefit over the entire range of plausible threshold probabilities in this study population with an incidence of SSI of 2.3%.
Fig. 3. Decision curves showing the highest net benefit of the strategy “treat according to the prediction model” when the threshold probability is below 0.125.
How can net benefit of the model be interpreted? As an example we have chosen a threshold probability of 0.05, corresponding with the willingness to treat 20 patients in order to prevent one SSI. At this point, use of the prediction model results in higher benefit than the “treat none” strategy. The net benefit of use of the prediction model is 0.0065 and implies that, for every 1,000 patients where we apply the prediction rule, 6.5 extra true positives are identified without increasing the false positive rate. Although the number seems low, it must be interpreted in the context of the prevalence. The maximum possible value of net benefit that can be achieved in this study equals the incidence of 0.023; we can never do better than intervening in all patients with SSI and in none of the patients without SSI. Therefore, a net benefit of 0.0065 means that 28% (0.0065/0.023*100%) of the maximal benefit is achieved at this threshold probability.
We have developed a prediction model to estimate the probability of developing SSI after dermatological surgery in order to select patients who might benefit from antibiotic prophylaxis. The overall performance of the model is good, with an AUC of 84.1%. Net benefit analyses show that at threshold probabilities below 0.125, when one is willing to treat 8 patients or more with antibiotics to prevent one SSI, the application of the prediction model is of added value compared with treating nobody with antibiotic prophylaxis. The strategy of prescribing antibiotic prophylaxis to all patients is inferior to treatment according to the prediction model over a range of plausible threshold probabilities.
A prediction model gives a predicted probability directly, but such probabilities must be compared against a threshold probability to aid clinical decision-making. This threshold is chosen prior to application of the prediction model. In terms of antibiotic prophylaxis, there is always a trade-off between harm due to not adequately preventing a SSI in patients who would develop SSI and harm due to unnecessary treatment with antibiotics in patients who would not develop SSI. According to the available literature, it is generally accepted that prophylaxis is not indicated when the risk of SSI is below 5% (18–20). It is also widely accepted that contaminated wounds with a risk of SSI above 20% should receive therapeutic antibiotics (18). This suggests that there is consensus that the range of plausible threshold probabilities lies between 5% and 20% corresponding to willingness to treat at least 5 and at most 20 patient to prevent one SSI. However, patients and doctors may differ as how they rate the possible side-effects of antibiotic treatment. While one doctor is willing to treat, for instance, 7 patients in order to prevent one SSI, the other might be willing to treat 15. This is also dependent on the clinical scenario. It is imaginable that one is willing to treat a lower number of patients, who had experienced lots of side-effects previously with antibiotic treatment, and a higher number of patients, who had a large reconstruction in the face where disturbance of wound healing would significantly impair the cosmetic outcome. The decision curves provide clinicians with an overview of the magnitude of the net benefit of acting according to the prediction model compared with other strategies at different threshold probabilities. The chosen threshold probability serves as a cut-off value of predicted probability at which one decides whether to use antibiotic prophylaxis. When a threshold probability of 0.05 is chosen, patients with a predicted probability of 5% (120 points according to the nomogram) or higher will be prescribed prophylaxis, whereas no prophylaxis will be given at predicted probabilities below 5%.
Net benefit analysis is a relatively simple decision analysis and is a method to assess the value of information provided by a prediction model expressing net benefit in units of true positive decisions. However, an accurately predicted SSI does not mean that the SSI will indeed be prevented by means of prophylaxis if the intervention is not 100% effective. Effectiveness of the intervention is not accounted for by net benefit analysis. There are 3 trials in the literature assessing the most effective method and optimal timing of antibiotic prophylaxis in dermatological surgery (21–23). The first study performed by Bencini et al. (21) randomized patients receiving skin surgery into 4 groups, with group A not receiving prophylaxis, group B receiving antibiotics for 3 days after surgery, group C receiving antibiotic powder during surgery, and group D receiving prophylaxis 2 days before and 2 days after surgery. The lowest percentage of SSI was seen in group D, leading to the conclusion that prophylaxis should be given prior to surgery. Two later studies confirmed this finding and have found that 1 single dose prior to incision (intramuscular cephazolin 1 g 120 min before surgery and oral cephalexin 2 g 30–60 min before surgery, respectively) is the most effective method of reducing the incidence of SSI (22, 23). This is in concordance with the recommendation in the most recent guideline on SSI prevention by the Centers for Disease Control and Prevention (CDC) (24). One recent Cochrane review studied the application of topical antibiotic after the wound has been closed once or several times until suture removal and concluded that it could possibly reduce the risk of SSI, although no recommendation could be made due to small sample sizes (25).
This study has some potential limitations. A very strict definition of SSI was used, because antibiotic prophylaxis will be beneficial only in patients with a true SSI, and not prevent the development of postoperative redness and oedema, which is sometimes mistaken for a SSI. Unfortunately, cultures were not available for all patients who had a clinical suspicion of a SSI. Therefore, the incidence of culture confirmed SSI of 2.3% might theoretically be an underestimation. However, the true figure is probably not much higher, as the range of incidence reported in other studies that have examined the occurrence of SSI in dermatological surgery without antibiotics prophylaxis is between 0.7% and 2.3% (1, 4, 5, 8, 26, 27).
In addition, 2 of the predictors applied in the current model (defect size and type of closure) are not always predictable prior to surgery. Finally, the relative low number of patients with SSI and the single-centre setting are a further limitation. External validation in other patient populations is necessary to validate the model.
In conclusion, the model for predicting the risk of SSI after dermatological surgery, that was developed and internally validated in this study, adequately identifies patients at risk for SSI prior to surgery. A decision curve analysis showed that the model is potentially useful when one is willing to treat more than 8 patients with prophylaxis to avoid one infection. For those who prefer more restrictive use of antibiotic prophylaxis, a default strategy of treating no patients at all is the best choice. External validation of the model is required before it can be widely applied in the clinical setting.


 Click to show fullsize
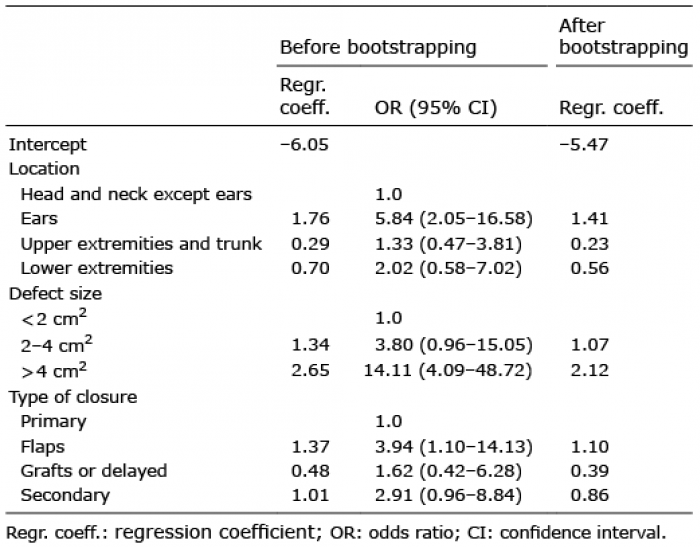 Click to show fullsize
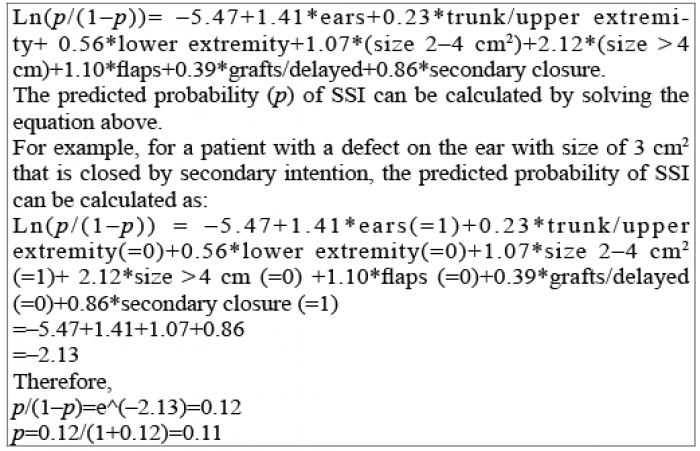 Click to show fullsize
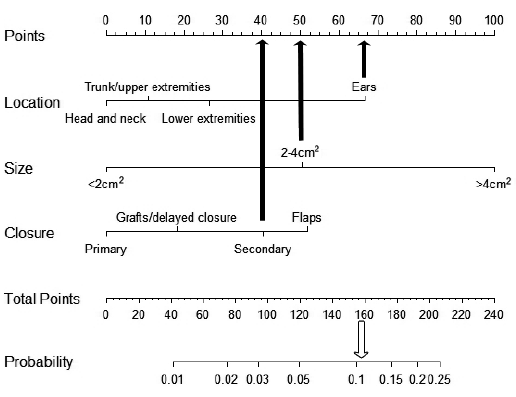 Click to show fullsize
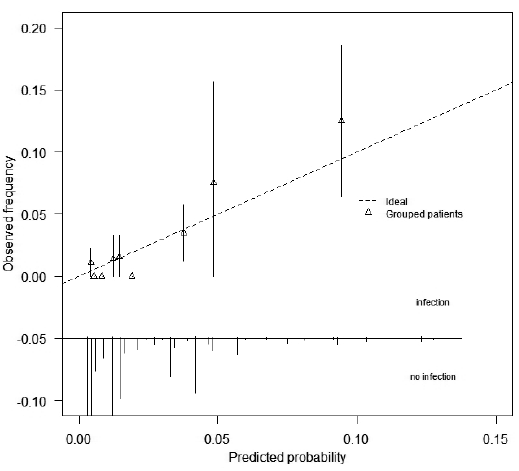 Click to show fullsize
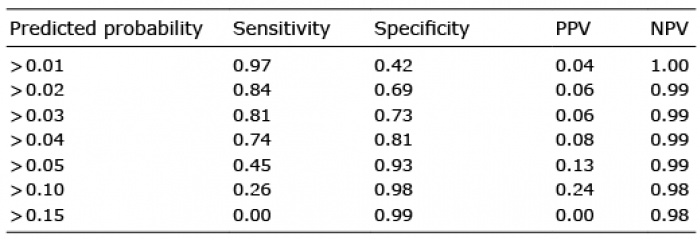 Click to show fullsize
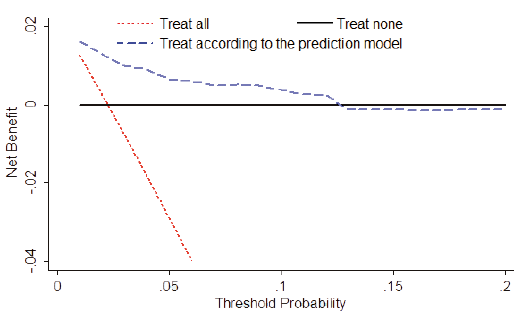 Click to show fullsize