


1Department of Dermatology, Maastricht University Medical Centre, 2GROW Research Institute for Oncology and Developmental Biology, Maastricht University, Maastricht, The Netherlands, 3Department of Dermatology and Allergology, University Hospital Augsburg, Augsburg, Germany and 4Department of Epidemiology, Maastricht University, Maastricht, The Netherlands
#These authors contributed equally to this work. *These authors share senior authorship.
The amount of training needed to correctly interpret optical coherence tomography scans of the skin is undefined. The aim of this study was to illustrate how cumulative sum charts can be used to determine how many optical coherence tomography scans novice assessors should evaluate in order to obtain competence in diagnosing basal cell carcinoma. Four hundred lesions suspected for non-melanoma skin cancer were evaluated by optical coherence tomography in combination with clinical photographs, using a 5-point confidence scale. The diagnostic error rate (sum of false-negative and false-positive optical coherence tomography results/total number of cases) was used to evaluate performance, with histopathological diagnosis as the reference standard. Acceptable and unacceptable error rates were set at 16% and 25%, respectively. Adequate performance was reached after assessing 183–311 scans, dependent on the cut-off for a positive test result. In conclusion, cumulative sum analysis is useful to monitor the progress of optical coherence tomography trainees. The caseload necessary for training is substantial.
Key words: optical coherence tomography; basal cell carcinoma; diagnostic; non-invasive; cumulative sum analysis; learning curve.
Accepted Nov 11, 2020; Epub ahead of print Nov 18, 2020
Acta Derm Venereol 2020; 100: adv00343.
doi: 10.2340/00015555-3696
Corr: Eva van Loo, Maastricht University Medical Centre+, Department of Dermatology, PO Box 5800, NL-6202 AZ Maastricht, The Netherlands. E-mail: eva.van.loo@mumc.nl
The amount of training needed to correctly interpret optical coherence tomography, a promising technique in diagnosing basal cell carcinoma, is not defined. This study used cumulative sum analysis to determine how many optical coherence tomography scans should be evaluated by novice assessors in order to obtain competence in diagnosing basal cell carcinoma. Four hundred lesions suspect for non- melanoma skin cancer were evaluated. Acceptable performance was reached after assessing 183–311 scans. However, the number of scans needed for training depends on the standards one sets to achieve. Cumulative sum analysis has proven to be a comprehensible method in monitoring a trainee’s performance.
The incidence of keratinocyte carcinoma has increased over the past decades, with basal cell carcinoma (BCC) being the most prevalent cancer in the Caucasian population worldwide (1–3). Diagnosis of BCC is often confirmed histopathologically by a biopsy, which also allows BCC subtyping and accommodates choice of the most appropriate treatment (4). Biopsies are invasive, may be painful, and can be complicated by, for example, bleeding (5). Moreover, histological assessment takes time, and treatment may only be started following a second consultation. In recent years, non-invasive diagnostic techniques have improved and interest in their application for skin cancer is comprehensively growing. Optical coherence tomography (OCT) was first described as a potential imaging method for dermatology in 1997 (6). It relies on the reflection of light to obtain cross-sectional images of tissue, with an axial resolution of approximately 15 μm and a detection depth of approximately 1.5 mm (7) Real-time, in vivo images of tissue microarchitecture are provided. For BCC, morphological features on OCT have been defined that show high concordance with regular histopathology slides (8–11). Several studies have explored the diagnostic value of OCT for discrimination between BCC and other diagnoses, and have reported high sensitivity (≥ 80%), with specificity ranging from 75% to 96% (12–15). Higher diagnostic accuracy has been described for more experienced observers (12, 16). However, data on learning curves for interpretation of OCT images is not available, whilst this is valuable information for physicians who are considering working with OCT. The learning curve for OCT-assisted diagnosis of BCC was studied using cumulative sum (CUSUM) analysis. The aim of this study was to illustrate how CUSUM charts can be used to determine how many OCT scans have to be evaluated by novice assessors in order to achieve an adequate level of competence in distinguishing BCC from other diagnoses.
The research database of a prospective observational cohort study, initiated at the outpatient clinic of the Dermatology Department of Maastricht University Medical Centre+ (MUMC+), Maastricht, the Netherlands, was used (17). The study was approved by the Medical Ethical Committee of MUMC+.
Patients, age 18 years or older, receiving a skin biopsy of a lesion clinically suspect for a keratinocyte carcinoma or pre-malignancy, were included between 15 February and 29 June 2017. Written informed consent was obtained. Exclusion criteria were: patients who were unable to sign informed consent. The physician marked the area for biopsy and clinical and (if ordered by the physician) dermoscopic pictures were taken by a medical photographer. The marked biopsy area was scanned with OCT (VivoSight OCT, Michelson Diagnostics, Maidstone, UK) and consecutively a 3-mm punch biopsy was taken. Histopathology was assessed by independent pathologists, who were unaware of the OCT diagnosis.
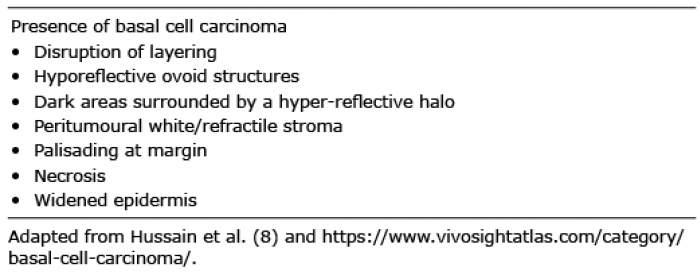
OCT images were coded and saved anonymously. OCT assessment was performed by 2 researchers who evaluated the clinical (and if available, dermoscopic) pictures in conjunction with the OCT images. Assessment of the OCT images on presence of BCC was based on the criteria described by Hussain et al. and the VivoSight online atlas (http://www.vivosightatlas.com/) (Table I) (8, 18). Level of confidence in the diagnosis of BCC was documented using a 5-point Likert-scale (range 0–4, Table II).
Table I. Criteria used for assessing optical coherence tomography (OCT) images on presence and subtyping of basal cell carcinoma
Table II. Level of confidence in diagnosis of basal cell carcinoma (BCC) on optical coherence tomography (OCT) and definition of positive and negative OCT test results according to 2 different cut-off values of the confidence score
The OCT assessors reached consensus on each OCT scan and were unaware of the histopathological results before making a final diagnosis. In order to accommodate the learning process, the assessors received immediate feedback of the histopathological outcome after each scan for the first 100 scans. For the remaining cases in the database, feedback on histopathological outcome was given after every 10–15 scans.
The diagnostic error rate, defined as the sum of false-negative and false-positive OCT results as a proportion of the total number of cases, was used as the criterion to assess diagnostic performance in this study, with histopathological diagnosis as reference standard.
Training prior to the study
Before the start of the study, the OCT assessors received instructions on BCC diagnosing and subtyping with OCT by a representative from the manufacturer. Also they studied literature on OCT in dermatology and attended a convention on OCT (19). Approximately 20 OCT scans were assessed purely for educational purposes and to become familiar with the OCT device (scans not included in this study).
One of the OCT assessors had several years of clinical experience with diagnosis and treatment of BCC (including Mohs surgery) as a dermatology resident, and one had two years of experience in clinical dermato-oncology as a research fellow.
Learning curve analysis
A cumulative sum (CUSUM) chart was used to track performance over time and was constructed using an Excel spreadsheet (20). CUSUM is an analysis technique typically used for sequential monitoring of cumulative performance and detection of change in performance over time. CUSUM charts were originally developed for industrial process monitoring and are based on the classification of a product’s quality into 1 of 2 categories: “defective” or “non-defective” (21). The purpose is to detect changes in the proportion (p) of items in the “defective” category. It is necessary to pre-specify an acceptable failure rate (p0) and an unacceptable failure rate (p1). In the same manner, a CUSUM chart can be applied to evaluate the learning process in medical interventional and diagnostic techniques (20, 22–25). The outcome of the diagnostic technique (in this case OCT) has to be classified into “success” or “failure”. For construction of the CUSUM chart, the cumulative sum after each case is plotted against the index number of that case. For each failure, a certain score (s, see formula in Appendix S1) is added and for each success, a score (1 – s) is subtracted. The CUSUM is the running sum of a mixture of increments (with each failure) and decrements (with each success). A continuing descending curve indicates that successes occur more frequently than failures.
When the running sum exceeds a certain threshold boundary, this signals a critical change. The upper and lower limits represent the boundary above which performance becomes unacceptable (h0) or below which performance becomes acceptable (h1), respectively. These boundaries depend on the setting of p0 and p1, but also on the setting of the false-positive or type I error (α, risk of falsely concluding that a trainee’s performance is unacceptable when it is not) and the false-negative or type II error (β, the risk of falsely concluding that a trainee’s performance is acceptable when it is not). The type I and type II error are conventionally set at 0.1, making h0 and h1 equal (22). For a detailed explanation see Appendix S1.
The primary endpoint in this study was the number of OCT assessments after which an adequate level of competence was achieved. A cut-off value of the confidence score in the OCT diagnosis has to be chosen to define positive and negative test results. CUSUM curves were made using 2 alternative cut-off values; ≥ 2 and ≥ 3 on the Likert scale (Table II). All diagnoses were compared with the histopathological diagnosis.
The acceptable diagnostic error rate was set at 16% and the unacceptable error rate at 25%.
A total of 400 OCT scans with corresponding clinical images of 400 lesions in 289 patients were included. All lesions were clinically suspicious for keratinocyte carcinoma or pre-malignancy. Of all 289 patients, 208 had 1 lesion, 63 patients had 2 lesions, 10 patients had 3 lesions, 6 patients had 4 lesions, and 2 patients had 6 lesions. Lesion characteristics are presented in Table III. Histopathology results revealed a total of 192 BCCs and 208 other diagnoses.
Table III. Characteristics of the 400 lesions included in the study
When using a cut-off value ≥ 2, high suspicion of BCC (score 2) as well as certainty of the presence of BCC (scores 3 and 4) are defined as a test-positive result of OCT. There were 23 false-negative diagnoses and 40 false-positive diagnoses, corresponding to an overall error rate of 15.8% (63/400). The CUSUM curve is presented in Fig. 1. From case 55 onwards the curve starts declining, and definitively crosses the acceptable boundary (h1) from above at case number 183. This crossing signals that the hypothesis, that acceptable performance at the pre-set error rate of 16% has been reached, can be accepted (with α=0.1 and β=0.1). The CUSUM curve continues to decline, indicating that performance remains acceptable.
When using a cut-off value ≥ 3, only certainty of BCC presence on OCT is defined as a positive test result. There were 48 false-negative and 26 false-positive OCT diagnoses corresponding to an overall error rate of 18.5% (74/400). The curve initially courses around and above the x-axis, indicating a “trial and error” state until case 52 (Fig. 1). It first crosses the acceptable boundary (h1) from above at case 202, but subsequently fluctuates around the critical h-line, giving it an overall horizontal course to definitely cross it from above at case 311. At this point, the hypothesis that the diagnostic error rate reached 16%, can be accepted.
Fig. 1. Cumulative sum (CUSUM) curve for optical coherence tomography (OCT)-assisted diagnosis of basal cell carcinoma (BCC) (n = 400), with p0 = 16% and p1 = 25% for cut-off value level of confidence ≥ 2 and ≥ 3.
This study illustrates how the CUSUM method can be used to create learning curves and estimate after how many OCT scans diagnostic performance meets pre-specified standards.
Learning curves graphically show the relationship between learning effort and achievement. The benefit of CUSUM is that it continuously assesses individual performance and progress in mastering a new technique (20). It also serves as a rapid detector of change and allows for early intervention, such as retraining or continued observation, which is especially useful in its application in trainee programmes (26, 27). It has become an accepted method for monitoring performance in medical therapeutic and diagnostic procedures (20, 24, 28, 29). The diagnostic error rate can be used as a measure for overall diagnostic performance in learning curves (20). This rate does not distinguish between sensitivity and specificity, which are discussed in another paper (17).
The OCT trainees reported their diagnosis on a 5-point confidence scale, which enabled us to monitor performance for different thresholds for a positive test result for OCT. Since a score of 3 or more on the Likert scale reflected the assessor being certain of the diagnosis BCC, we considered this as the most appropriate threshold. However, in a scenario in which the aim is not to miss a BCC, one may opt for a confidence level ≥ 2 as the cut-off point for a positive test result. For the latter, the number of cases (n = 183) that need to be evaluated before reaching acceptable performance was lower than the 311 required scans when the more strict threshold ≥ 3 was used. A possible explanation is that less experienced OCT users tend to exercise more caution in their judgement, represented by lower confidence scores, which is penalized when using a high confidence score as the cut-off value.
When the ultimate goal of OCT is to be able to omit punch biopsy, it becomes important to monitor the ability to make both accurate and confident diagnoses. However, such ability requires more and longer training.
The number of cases required to achieve acceptable performance depends strongly on the choice of the acceptable and unacceptable failure rates (p0 and p1). These parameters set the target that one wants to achieve and may differ between centres. However, the setting of realistic targets for our centre, where OCT has not yet been implemented in clinical practice, was challenging. Diagnostic error rates of 12% have been reported by 2 (industry-initiated) studies on diagnostic performance of OCT (13, 14). However, the prevalence of BCC was higher than in the current study, and thus the study populations may represent a different case mix. Moreover, the level of confidence in the OCT diagnosis used to define a positive test result with OCT was not explicitly reported in these studies (13, 14). Therefore, efforts were made to obtain an estimate of the failure rate of a competent, experienced operator. For this purpose, 2 OCT users with 23 and 8 years of experience (JW and SS) assessed a randomly chosen subset of 100 scans from our database. The error rates of these OCT users were 16%. The setting of the unacceptable error rate at 25% was more straightforward, since this was the error rate accomplished by clinical examination in this study and, in order to be of added value, we considered that OCT-assisted diagnosis should not exceed this rate (17).
This study gives an indication of the number of cases that, given our clinical, histopathological and OCT experience, need to be assessed with OCT before being able to discriminate BCC from other diagnoses. However, these results cannot be universally applied to other centres, because previous experience with OCT may differ, as well as targets considered feasible or acceptable. In former studies, OCT training programmes (if described) consisted of a 30-min instruction with 50 OCT images or a 20-min lecture on OCT (12, 16). In the current study, training was more extensive. We consider that a basic level of background knowledge is necessary in order to understand the structures visible on the scans and a similar 2-day course, consisting of general lectures and hands-on training by experienced users, is minimally required before starting to train with OCT in clinical practice.
In conclusion, currently, no recommendations or guidelines on training in OCT exist. This study illustrates our experience with how a learning curve can help to establish the number of cases that are required to achieve an adequate level of performance. At an acceptable and unacceptable diagnostic error rate of 16% and 25%, adequate performance in diagnosing BCC was reached after 183–311 scans. In conclusion, a substantial number of scans need to be evaluated to achieve adequate competence in diagnosing BCC with OCT.
Conflicts of interest: JW reports grants from European Union CIP-ICT PSP Programme, during the conduct of the study; NK-S reports personal fees from Galderma, personal fees from Janssen-Cilag, and personal fees from Abbvie, outside the submitted work. The other authors have no conflicts of interest to declare.


 Click to show fullsize
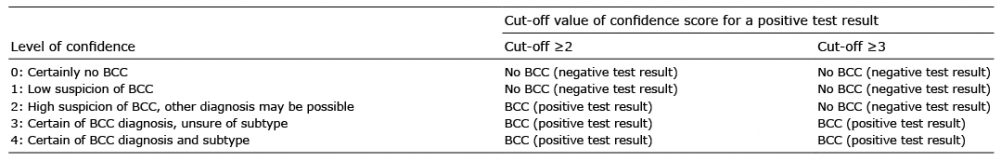 Click to show fullsize
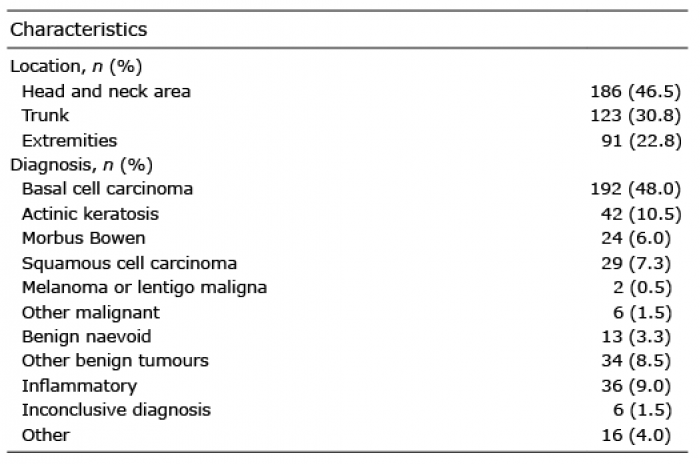 Click to show fullsize
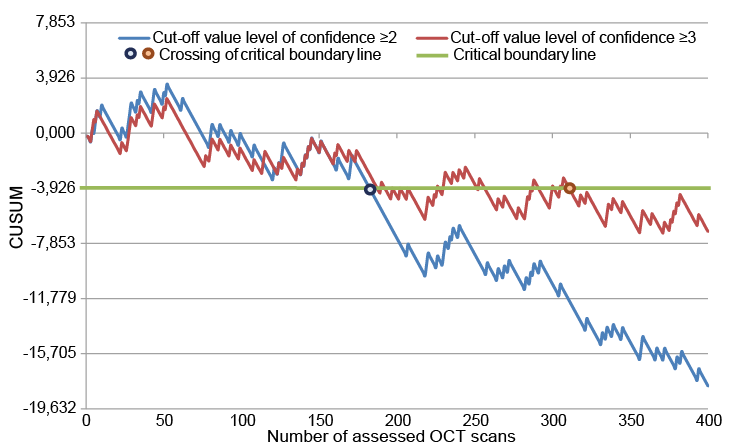 Click to show fullsize