


1Department of Dermatology and Venereology, 3Department of Biochemistry, Institute of Biomedicine and Translational Medicine, 4Centre of Excellence for Genomics and Translational Medicine, University of Tartu, 5Department of Cell Biology, Institute of Molecular and Cell Biology and 2Dermatology Clinic, Tartu University Hospital, Tartu, Estonia
The main objectives of this study were to characterize the metabolomic profile of lesional skin of patients with atopic dermatitis, and to compare it with non- lesional skin of patients with atopic dermatitis and skin of controls with no dermatological disease. Skin-punch biopsies were collected from 15 patients and 17 controls. Targeted analysis of 188 metabolites was conducted. A total of 77 metabolites and their ratios were found, which differed significantly between lesional skin of atopic dermatitis, non-lesional skin of atopic dermatitis and skin of controls. The metabolites were members of the following classes: amino acids, biogenic amines, acylcarnitines, sphingomyelins or phosphatidylcholines, and the most significant differences between the groups compared were in the concentrations of putrescine, SM.C26.0 and SM.C26.1. The alterations in metabolite levels indicate inflammation, impaired barrier function, and susceptibility to oxidative stress in atopic skin.
Key words: atopic dermatitis; dermatology; biomarkers; metabolomics.
Accepted Feb 10, 2021; Epub ahead of print Feb 15, 2021
Acta Derm Venereol 2021; 101: adv00407.
doi: 10.2340/00015555-3766
Corr: Liis Ilves, Department of Dermatology, University of Tartu, 31 Raja Street, EE-50417 Tartu, Estonia. E-mail: liis.ilves@ut.ee
Atopic dermatitis is a chronic inflammatory skin disease that has a significant impact on patients’ lives. Our research group is interested in finding biomarkers characteristic of atopic dermatitis, in order to gain new information about the pathophysiology of the disease, and to find novel and effective treatment options in the future. This study compared lesional and non-lesional skin of patients with atopic dermatitis and skin of controls, and conducted an analysis to find differences between the composition of metabolites in these groups. A total of 77 metabolites and their ratios were found, which differed statistically significantly between the 3 phenotypic groups.
Atopic dermatitis (AD) is a chronic inflammatory skin disease (CISD) that has a significant negative impact on the physical, emotional and psychosocial wellbeing of affected patients (1–3). AD affects approximately 10–20% of children and 1–3% of adults worldwide (4). The prevalence of AD is increasing, especially in the younger age groups (5). The risk factors and pathophysiological mechanisms of AD involve skin barrier dysfunction, alterations in immune response, such as prevalent Th2 response during the acute phase, which leads to increased IgE synthesis, genetic factors, of which mutations in the filaggrin gene are most widely known, and environmental factors, such as reduced humidity and presence of pollutants (6–10). Clinically, patients with AD have dry skin, typical appearance and distribution of itchy rash, which is dependent on age (6). Skin lesion is usually the first manifestation of the “atopic march”, which includes the appearance of asthma and allergic rhinitis at later stages. Patients with AD also have more frequent and severe skin infections, most often caused by Staphylococcus aureus and herpes simplex virus (1).
To date, only a few metabolomic studies on AD have been conducted. Ottas et al. investigated the blood serum metabolome of patients with AD and found differences in the levels and ratios of acylcarnitines, phosphatidylcholines, and in a cleavage product of fibrinogen A-α (11). Huang et al. compared the serum of children with AD and healthy children and found decreased concentrations of glycine, and taurine-conjugated bile acids, and increased levels of unsaturated fatty acids, leukotriene B4 (LTB4), prostaglandins including PGD2, PGB2, PGE2; 8-, 9-, 11-, 12-hydroxy eicosatetraenoic acid (HETE) as well as 13- and 9-hydroxy octadecadienoic acid (HODE) in an AD group. In addition, differences between metabolomic profiles of patients with AD with elevated and normal IgE levels were identified (12). An analysis of blood sera of adult patients with AD who responded to omalizumab treatment showed increased baseline phosphatidylcholine concentrations compared with sera from non-responders (13). Furthermore, levels of creatinine, creatine, citrate, formate, 2-hydroxybutyrate, dimethylglycine and lactate in the urine of infants with AD are increased, and the concentrations of betaine, glycine and alanine are decreased (14).
To our knowledge this study analysed, for the first time, the metabolomic profiles of the skin of patients with AD, compared with the metabolomes of non-lesional skin samples obtained from the same patients and from healthy controls.
Ethics approval
The study was approved by the Research Ethics Committee of the University of Tartu, (permission number 269/T-9). The Declaration of Helsinki protocols were followed and patients provided their informed, written consent.
Volunteer recruitment
Adult patients with AD were recruited from the Tartu University Hospital at the Clinic of Dermatology between 2013 and 2015. Controls were recruited either from the Clinic of Traumatology and Orthopaedics or from the Clinic of Dermatology. The exclusion criterion for participants was any other concomitant skin disease. Fifteen patients with AD (11 women, 4 men, ages 20–50 years) and 17 controls (7 women, 10 men, ages 23–75 years) were enrolled in the study. Fourteen of the patients with AD had one or more known allergies (food allergies: 9 patients; allergy to medication: 3 patients; to dust or hair: 11 patients; to pollen: 11 patients), 11 patients had other concomitant atopic diseases (allergic rhinoconjunctivitis, bronchial asthma) and 7 had a positive family history of AD. Four people in the control group had one or more known allergies (food allergies: 3 patients; allergy to medication: 2 patients; to dust or hair: 2 patients) and 2 patients (who had no known allergies) had a positive family history of AD. All participants were Caucasians of Eastern European descent and all provided written informed consent.
Skin biopsies
Three-millimetre punch biopsies were taken from the visually well-defined AD lesional skin and adjacent (1–2 cm from lesions) non-lesional skin from the upper arm and torso of patients with AD and from similar locations of non-sun-exposed skin of controls. The biopsies were collected before the first meal of the day. Skin samples were frozen immediately in liquid nitrogen and stored at –80°C until needed. The samples were collected over a period of 3 years, after which metabolites were extracted, and samples lyophilized. The lyophilized samples were stored at –80°C until analysis, as described previously (15). Prior to measurements, the skin samples were weighed and a mix of 12 ml/g methanol and chloroform and 6 ml/g water was added according to the skin sample weight. Twelve-mm steel balls were added to the tube and milled using BulletBlender (NextAdvance). The sample was incubated for 1 h on ice, the supernatant was transferred to a clean tube and centrifuged at 16,000 × g, and 4°C for 15 min. The methanol/water and chloroform phases were pipetted to separate tubes and lyophilized.
Metabolomic analysis
AbsoluteIDQ p180 kit (Biocrates Life Sciences AG, Innsbruck, Austria) was used for the targeted analysis of 188 metabolites and their ratios. An Agilent Zorbax Eclipse XDB C18, 3.0 × 100 mm, 3.5 µm with Pre-Column SecurityGuard, Phenomenex, C18, 4 × 3 mm was used on a 1260 series HPLC (Agilent, Santa Clara, CA, USA) in tandem with a QTRAP 4500 (ABSciex, Framingham, MA, USA) mass spectrometer. The protocol is set out in the user’s manual of the AbsoluteIDQ p180 kit. Briefly, lyophilized samples were thawed on ice, the 2 lyophilized phases were both dissolved in 85% methanol/15% water, according to their previous weight (15–25 μl added solvent) and both phases were added to the filter plate of the kit. Subsequently, 10 µl internal standards were added. The samples were derivatized using phenylisothiocyanate, dried, and metabolites extracted using 40% methanol in water. Acetonitrile, chloroform, formic acid (FA), methanol and water were all HPLC grade and purchased from Sigma-Aldrich (Darmstadt, Germany).
Data analysis
Data were analysed using R version 3.5.1 (16). The non-parametric Kruskal–Wallis rank-sum test and the Wilcoxon rank-sum test were used when looking for phenotype differentiating metabolites. Benjamini–Hochberg (false discovery rate; FDR 5%) corrected p-value < 0.05 was considered statistically significant.
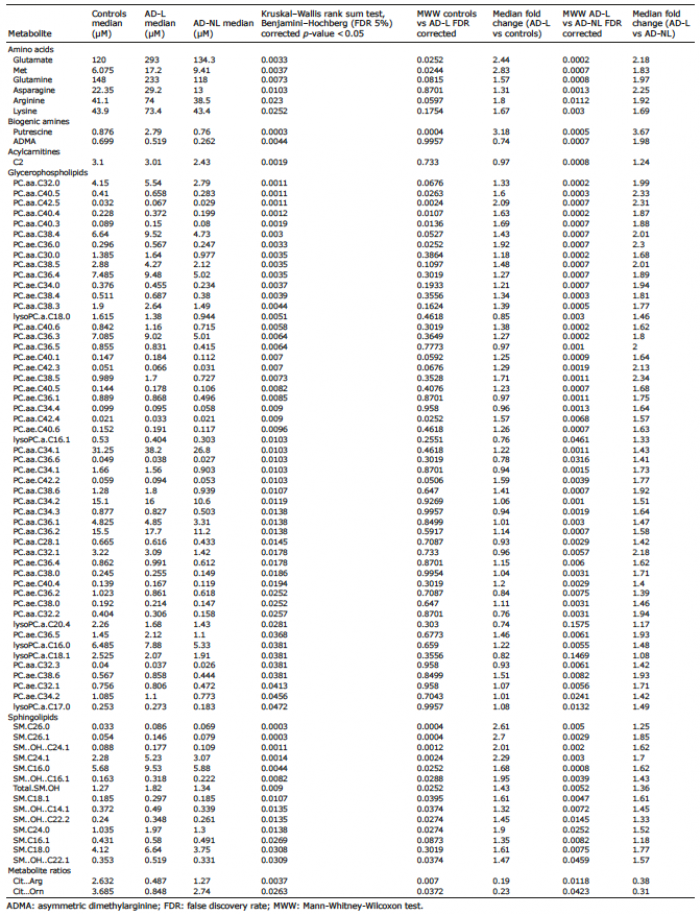
A total of 77 metabolites and their ratios were found, which differed significantly between lesional skin of atopic dermatitis (AD-L), non-lesional skin of atopic dermatitis (AD-NL) and skin of controls (C) in targeted analysis (Kruskal–Wallis rank-sum test, Benjamini–Hochberg (FDR 5%) corrected p-value < 0.05; Table I). These metabolites belonged to amino acids (AAs), biogenic amines, acylcarnitines, sphingomyelins and phosphatidylcholines groups. While comparing the metabolomic profile of AD-L skin with C skin there were 21 metabolites that had significantly higher concentrations in AD-L skin and 2 metabolite ratios (citrulline to arginine, and citrulline to ornithine) that had higher values in C skin (Fig. 1). When the profiles of AD-L and AD-NL skin were compared 73 metabolites were found that had elevated concentrations in AD-L skin (Fig. 2). As in the case of AD-L and C comparison, the ratios of citrulline to arginine and citrulline to ornithine had higher values in AD-NL skin. There were no statistically significant differences between the metabolite concentrations in AD-NL and C skin.
Table I. Statistically significantly different metabolites and their ratios between samples obtained from atopic dermatitis lesional (AD-L) and non-lesional (AD-NL) skin in addition to the skin of controls
Fig. 1. Boxplots of concentrations of 6 metabolites which were statistically significantly (Kruskal–Wallis rank sum test, Benjamini–Hochberg (false discovery rate; FDR 5%) corrected p-value < 0.05) different between atopic dermatitis lesional skin (AD-L), atopic dermatitis non-lesional skin (AD-NL) and the skin of controls (C). The levels are reported as micromolar (μM) concentrations. (A) Putrescine; (B) SM.C26.0, sphingomyeline C26:0; (C) SM.C26.1, sphingomyeline C26:1; (D) PC.aa.C32.0, phosphatidylcholine diacyl C32:0; (E) PC.aa.C40.5, phosphatidylcholine diacyl C40:5; (F) PC.aa.C42.5, phosphatidylcholine diacyl C42:5.
Fig. 2. Principal component analysis (PCA) plot based on the whole dataset from targeted analysis. Red circles: atopic dermatitis lesional skin (AD-L) skin samples; blue squares: atopic dermatitis non-lesional skin (AD-NL) skin samples; green triangles: C skin samples. X and Y axes represent percentage of variability. x axis: Principal Component 1: 41.1% explained variance; y axis: Principal Component 2: 11.4% explained variance.
The concentrations of putrescine were higher in AD-L skin compared with both AD-NL (p = 0.0005, 3.7 median fold change) and C skin (p = 0.0004, 3.2 median fold change). The levels of asymmetric dimethylarginine (ADMA) were higher in AD-L skin compared with AD-NL skin (p = 0.0007, 2 median fold change).
The only acylcarnitine that differed significantly between the groups was acetyl-L-carnitine (C2), the levels of which were elevated in AD-L skin compared with AD-NL skin (p = 0.0008, 1.2 median fold change).
Regarding AAs, 8 metabolites and their ratios were found, which had statistically significant differences between the 3 phenotypic groups. The concentrations of glutamate (Glu) were higher in AD-L skin compared with AD-NL (p = 0.0002, 2.2 median fold change) and C skin (p = 0.0252, 2.4 median fold change). Similarly, methionine (Met) level in AD-L skin was higher compared with both AD-NL (p = 0.0007, 1.8 median fold change) and C (p = 0.0244, 2.8 median fold change) skin. In AD-L skin there were also higher levels of glutamine (Gln) (p = 0.0008, 2 median fold change), asparagine (Asn) (p = 0.0013, 2.2 median fold change), arginine (Arg) (p = 0.0112, 1.9 median fold change) and lysine (Lys) (p = 0.003, 1.7 median fold change) compared with AD-NL skin, but no significant differences were found among the levels of named metabolites when C skin was compared with AD-L and AD-NL skin. The ratios of citrulline to Arg (Cit…Arg) and Cit to ornithine (Cit…Orn) were higher in C skin compared with AD-L skin (p = 0.007 and p = 0.0372, respectively) and higher in AD-NL skin compared with AD-L skin (p = 0.0119 and p = 0.0423, respectively).
Furthermore, 14 sphingolipids, 46 phosphatidylcholines (PC) and 6 lysophosphatidylcholines (lysoPC) were found that had significant differences between the 3 groups. All sphingolipids had the highest concentrations in AD-L skin and almost all of these (12 of 14) had significant differences between both AD-L and AD-NL skin and AD-L and C skin. Two sphingolipids had higher concentrations in AD-L skin only compared with AD-NL skin. Four lysoPCs had significantly higher levels in AD-L skin than in AD-NL skin, and the levels of lysoPC.a.C20.4 and lysoPC.a.C18.1 did not differ between the groups in pairwise comparison. There were 40 PCs that had elevated concentrations in AD-L skin compared with AD-NL skin, and 6 PCs that had higher levels in AD-L skin compared with both AD-NL and C skin.
To our knowledge, this study addressed, for the first time, the wide range of metabolomic differences between AD-L, AD-NL and C skin.
The levels of putrescine were elevated in AD-L skin compared with both AD-NL and C skin. Biogenic amines putrescine, spermidine and spermine have important roles in diverse cell functions, and they can be found in, and are produced by, all mammalian cell types. They take part in cell proliferation and growth, protect DNA from oxidative damage and regulate its conformational status, interact with ion channels, and participate in immune regulation (17–20). In neoplastic diseases the metabolism of polyamines is altered and, consequently, their levels are elevated in cancer cells. This has led to the search for cancer treatment options that target different aspects of biogenic amines metabolism, such as inhibiting their synthesis (e.g. inhibition of ornithine decarboxylase I (ODC1), which acts as a primary rate limiting enzyme for polyamine biosynthesis) or blocking their transport (17, 21, 22). In addition, polyamine levels are elevated during inflammation; however, their role in this process is not clear, as they seem to have both pro- and anti-inflammatory properties (23–25).
The de novo synthesis of these biogenic amines is accomplished via a dedicated pathway. The first step in this pathway is the production of putrescine by ODC1. Importantly, Orn is produced from Arg in a separate set of reactions. To convert putrescine into other biogenic amines the key reactions are as follows: activation of Met and subsequent production of S-adenosyl-L-methionine (AdoMet), its decarboxylation by AdoMet decarboxylase (AMD1) and utilization of propylamine groups from decarboxylated AdoMet for the synthesis of spermidine by spermidine synthase and spermine by spermine synthase (26, 27).
Increased putrescine levels were found in inflammatory AD-L skin compared with both AD-NL and C skin. However, the concentrations of spermidine and spermine were not significantly increased and, accordingly, Met concentration was significantly increased in AD-L skin. This can be explained by the continuous production of putrescine by ODC1 and potential downregulation of AMD1 in AD-L skin.
On the other hand, Lim et al. (27) found that AMD1 was upregulated at the wound edge cells after wounding human keratinocytes ex vivo and in scratch assays. As pruritus is one of the major symptoms in AD that leads to scratching, this study would have been expected to find higher levels of spermidine and spermine in AD-L samples.
Increased levels of ADMA were found in AD-L skin compared with AD-NL skin. ADMA and SDMA are related to Arg metabolism. ADMA inhibits nitric oxide synthase (NOS), and SDMA competes with L-arginine for transport into the cell via cationic amino acid transporter 2B, which results in decreased cellular L-arginine levels (28, 29). L-arginine is a substrate for NO synthesis, which facilitates normal endothelial function (30). SDMA and ADMA have been found to participate in inflammatory processes, and are increased in diseases, such as chronic kidney disease, atherosclerosis, rheumatoid arthritis and psoriasis (31–35). We have previously found elevated ADMA and total DMA levels in lesional skin of psoriatic patients (36). Thus, dimethylarginines may act as biomarkers for inflammation and metabolic imbalance.
The ratios of Cit to Arg and Cit to Orn were decreased in AD-L skin compared with AD-NL and C skin. A possible reason for this is that more Arg and Orn are needed to produce putrescine via previously described pathway by ODC1. Although the levels of Orn were higher in AD-L skin than in AD-NL and C skin, the differences were not statistically significant when comparing the 3 phenotypic groups. The level of Arg was elevated in AD-L skin compared with AD-NL skin, which is consistent with the findings of Dimitriades et al. (37), who also described decreased activity of arginase I and slightly higher levels of Arg in the plasma of paediatric patients with AD. In addition, as a result of increased ADMA levels in AD-L skin, NOS is inhibited and biosynthesis of Cit from Arg is diminished. We found similar changes in psoriatic skin, where the ratio of Cit to Orn was decreased in lesional skin compared with non-lesional and control skin, which could have been due to lower activity of Orn carbamoyltransferase (36, 38).
The concentration of a non-essential AA Asn was elevated in AD-L skin compared with AD-NL skin. Asn is required for development of the brain and has an important role in protein synthesis and cellular responses to AA homeostasis. Asn can be converted into aspartate (Asp), which is also needed for the urea cycle and is related to production of Arg. Asp can be converted to Asn. The biosynthesis of Asn and Glu requires Asp and Gln, which are metabolized by the enzyme Asn synthetase (39–41). Glu is another non-essential AA. In addition to its importance in protein synthesis, it is also a crucial neurotransmitter. It has been found that, in depressive patients, increased plasma inflammatory markers are linked to elevated Glu concentration in basal ganglia and administration of ketamine, a glutamate receptor antagonist, gives a rapid positive effect in otherwise treatment-resistant depression (42, 43). Increased levels of Glu have been found in the blood of patients with other diseases, such as rheumatoid arthritis, obesity and Alzheimer’s disease; the conditions which, similar to AD, have a strong inflammatory component (44–46). In addition, the Glu median level in AD-L samples was more than 2-fold higher than in AD-NL or in C samples. Nevertheless, as in lymphocytes, one of the major intermediate compounds in glutamine (Gln) metabolism is Glu. The elevated levels of Glu in AD-L skin might be connected to the increased need for Gln, which, in addition to its other functions, is an important energy source for immune cells (47, 48).
The concentrations of the essential AA Met were increased in AD-L skin compared with AD-NL and C skin. Met has important roles in protein biosynthesis and protection from oxidative stress. Met oxidation into methionine sulphoxide (Met.SO) and conversion via AdoMet into cysteine provide protective measures to neutralize oxygen radicals. Furthermore, cysteine, together with Glu, act as precursors for a potent cellular antioxidant glutathione (49, 50). Interestingly, the levels of Met.SO were undetectable in all the skin samples.
The increased levels of Met and Glu and undetectable Met.SO level in AD-L skin may be hallmarks of an impaired synthesis of anti-oxidative compounds, which, in turn, suggests the presence of increased oxidative stress in AD skin. This is substantiated by the notions that AD-L skin contains less glutathione than normal skin, and environmental stress factors induce oxidative stress in the skin of patients with AD (51, 52).
The concentrations of another AA, Lys, were increased in AD-L skin compared with AD-NL skin. In addition to their other functions, Lys and Met are needed in the synthesis of carnitine. Carnitine has an important role in fatty acid metabolism, as it transports long-chain fatty acids through the inner mitochondrial membrane, after which β-oxidation takes place (53, 54). Among acylcarnitine esters, the most significant is C2, which is formed after the acetyl moiety from acetyl-coenzyme A (acetyl-CoA) is transferred to carnitine. Thereby, C2 also regulates intracellular CoA homeostasis (55). Huang et al. compared the metabolites in patients with high and low serum IgE who had AD, and found elevated carnitine levels in the blood serum of patients with elevated levels of IgE. They concluded that the increased levels of fatty acids, carnitines, lactic acid and citric acid in children with high serum IgE AD point to impaired energy metabolism (12). Interestingly, lower levels of C2 were found in the serum of patients with AD (11). However, as in the current study, we have previously found elevated levels of C2 in psoriatic lesional skin compared with non-lesional skin, reflecting the metabolic and energetic status of the skin cells (36, 54).
The shift towards Th2-mediated immune responses might alter the lipid composition of AD skin (56). Ceramides are the precursors for sphingolipids, and facilitate preserving intact skin barrier and reducing water loss. In AD skin, reduced ceramide content with altered chain lengths have been found (57–59). In addition to glucosylceramide, sphingomyelins (the most frequent sphingolipids in mammalian cells) can also be metabolized to ceramides by sphingomyelinase. The activity of sphingomyelinase is decreased in AD-L as well as in AD-NL skin and, subsequently, smaller amounts of ceramides are produced (57, 60, 61). These data are in agreement with the results of the current study, in which the levels of 12 sphingomyelins were elevated in AD-L skin compared with AD-NL and C skin, and 2 sphingomyelins had higher concentrations in AD-L skin compared with AD-NL skin, suggesting deficient ceramide synthesis and, consequently, a reduced skin barrier.
In addition to being the main components of cell membranes SM and PC are sources of bioactive compounds that are involved in different signalling pathways (62). The current study found 40 PC-s that had elevated ratios in AD-L skin compared with AD-NL skin, and 6 PC-s that had higher concentrations in AD-L skin compared with both AD-NL and C skin. Peiser et al. (63) have suggested that a defective phosphatidylcholine-sphingomyelin transacylase might play a role in AD and could also be a reason why elevated PC levels were found in AD-L skin. As in psoriasis, the concentrations of 4 lysoPC-s, which are derived from PC-s, were increased in AD lesional skin compared with non-lesional skin, and similarly, the attraction of T-lymphocytes might be one of their roles in AD (64).
The number of reports on metabolome of patients with AD is still very limited, and only single reports describing the metabolome of blood and urine of patients with AD could be retrieved. When the metabolomic profile of AD skin was compared with that of blood samples obtained from patients with AD a few concomitant alterations in specific metabolite levels were found. Interestingly, the changes were mostly in opposite directions, suggesting a decrease in these metabolites in the bloodstream and concomitant increase in the skin tissue. For instance, the concentration of C2 was decreased in the blood samples of patients with AD compared with controls; however, in the current study, the level of C2 was significantly higher in AD-L skin compared with AD-NL skin (11). Similarly, the concentrations of 3 PCs were decreased and only one PC increased in the blood samples of patients with AD; however, the current study found that the concentrations of 40 PCs were increased in AD-L skin compared with AD-NL skin, and the concentrations of 6 PCs were higher in AD-L skin compared with AD-NL and C skin (11).
Data regarding the metabolomic profile of the urine of patients with AD are also scarce; we found only one study, analysing the urine of infants with AD (14). However, there were no similarities to the current study with regard to altered metabolite concentrations. The reasons may lie in the specific properties of renal filtration, as well as the differences in the ages of patients (infants vs adults).
Limitation
A limitation of this study was the relatively small number of enrolled patients.
Conclusion
A wide metabolomic analysis of AD and control skin samples were conducted, and notable alterations in the concentrations of amino acids, biogenic amines and lipids identified, which indicate ongoing inflammatory response, disruption of the barrier function, and susceptibility to oxidative stress. These findings are in concordance with the inflammatory nature of AD and dysregulation of the immune system.
The authors are grateful to all of the volunteers and Ingrid Liiman, Kadri Sikk, Aare Märtson, Katre Maasalu and Jelena Lüter for their efforts in recruiting volunteers and collecting samples.
This study was made possible by funding from grant IUT20-42 and grant PRG1189 from the Estonian Research Council, SP1GVARENG from the University of Tartu, personal research grants PUT1465 (Külli Kingo), PUTJD914 (Aigar Ottas) and PRG057 (Viljar Jaks) from Estonian Research Agency, and the European Union through the European Regional Development Fund (project number 2014-2020.4.01.15-0012).
The authors have no conflicts of interest to declare.


 Click to show fullsize
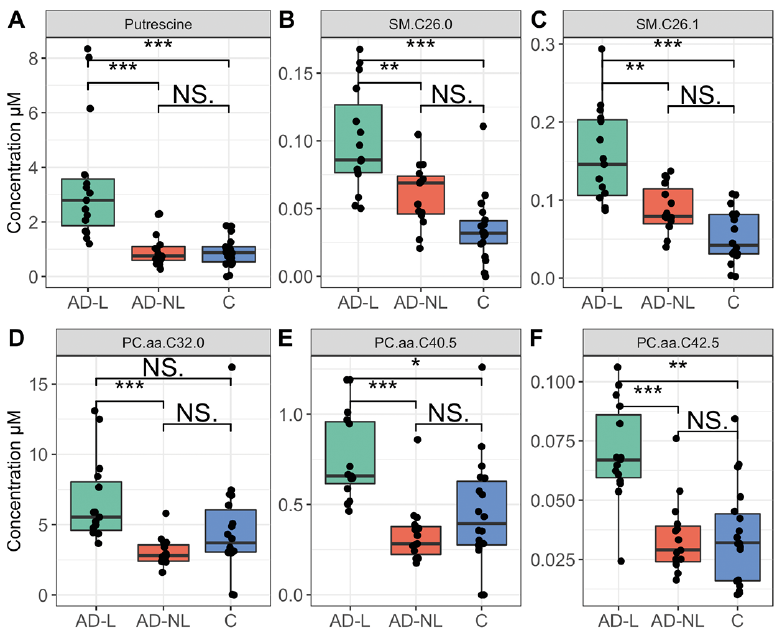 Click to show fullsize
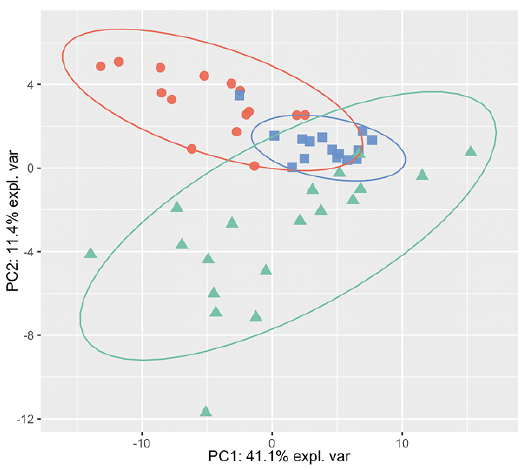 Click to show fullsize