OBJECTIVE: To develop and test the ability of a screening instrument to identify subgroups among primary healthcare patients with musculoskeletal pain. The Pain Belief Screening Instrument covers pain intensity, disability, self-efficacy, fear avoidance and catastrophizing.
DESIGN: Cross-sectional, correlational and comparative study.
SUBJECTS: Patients in primary healthcare (n1 = 215; n2 = 93) with a pain duration of 4 weeks or more were included.
METHODS: Items for the Pain Belief Screening Instrument were derived from principal component analyses of: the Self-efficacy Scale, the Tampa Scale of Kinesiophobia and the Catastrophizing subscale in the Coping Strategies Questionnaire. Cluster solutions of scores on the screening instrument and the original instruments were cross-tabulated. The reliability of items in the Pain Belief Screening Instrument was examined.
RESULTS: The screening instrument identified 2 groups: high- or low-risk profile for pain-related disability. Validity was in-between moderate and substantial (κ = 0.61, p < 0.001). The reliability of each item in the Pain Belief Screening Instrument in relation to the corresponding item in the original instruments was moderate to high (rs 0.50–0.80, p < 0.01).
CONCLUSION: The screening instrument fairly well replicated subgroups identified by the original instruments. The reliability of items in the screening instrument was acceptable. Further testing of predictive validity for a primary healthcare population is needed.
Key words: musculoskeletal pain, primary healthcare, self- efficacy, fear avoidance.
J Rehabil Med 2007; 39: 461–466.
Correspondence address: Maria Sandborgh, Department of Public Health and Caring Sciences, Section of Caring Sciences, Uppsala University, Uppsala Science Park, SE-751 83 Uppsala, Sweden. E-mail: maria.sandborgh@pubcare.uu.se
Submitted May 16, 2006; accepted January 22, 2007
INTRODUCTION
Disability related to persistent musculoskeletal pain (MSP) is a common health problem throughout the world (1, 2). In Sweden the Primary Health Care (PHC) institutions receive most of the patients with MSP (3) and face the problem of deciding who to treat and how to treat. The patients in PHC may either consult the physical therapist directly or be referred to physical therapy by a general practitioner. Hence, physical therapists deal with a large, unselected group of patients with MSP, and should therefore be able to screen for risk factors for pain-related disability and to address these factors in the assessment and treatment of patients.
Screening methods have been developed to identify subjects at risk for longstanding disability in pain clinic settings (4), in PHC settings (5, 6) and in occupational settings (7), but such screening has predominantly concerned patients with low back pain. Screening methods for the total group of patients with MSP, including patients with pain at other sites, e.g. neck and shoulder pain, remain to be investigated. Risk factors for disability in neck and back pain have been summarized in a review published by the Swedish Council on Technology Assessment in Healthcare (8) and are predominantly psychological, e.g. maladaptive coping strategies, distress, fear avoidance, but also social, such as relationships at work and job satisfaction (9). However, a recent survey (10) has revealed that physical therapists are unable to identify the most important of these risk factors. Physical therapists also need to identify risk factors that can be addressed and influenced by physical therapy. Some of the psychological factors, e.g. self-efficacy, fear of movement/(re)injury and catastrophic thinking, appear to be more directly linked to motor behaviour (11–13) and thus warrant special attention in physical therapy.
Self-efficacy, i.e. the individual’s confidence in carrying out a specific behaviour (14), influences the adjustment to a pain condition and to pain-related disability (15), predicts physical performance (11), pain behaviour and avoidance (16).
Fear of movement/(re)injury is a generalized pain-related fear in which movements are expected to cause pain or injury and hence are avoided (12, 17). Fear-avoidance of activity or movement is strongly related to observable physical performance and self-reported disability (18) and is considered a mediator of disability in chronic pain patients (12). Catastrophizing, i.e. a negative pattern of thought concerning experiences and outcome (19), is considered a potential precursor of fear avoidance (12).
The correlations between disability and fear of movement/(re)injury, self-efficacy, catastrophizing and pain intensity were explored in a study on patients in PHC physical therapy (20). Self-efficacy, fear of movement/(re)injury and catastrophizing explained 61% of the variance in disability scores. From a clinical perspective, these factors are of interest because they are amenable to change and possible to influence in treatment, as has been shown for fear of movement (21), catastrophizing (22) and self-efficacy (23, 24). Thus, the need to include these factors in the physical therapy assessment and treatment of patients with MSP appears to be justified.
Among patients with persistent MSP, subgroups have been identified, each demonstrating different degrees of pain-related risk factors for disability (6, 25, 26). Among PHC patients in physical therapy we identified distinct subgroups by measuring pain intensity, disability, self-efficacy, fear of movement/(re)injury and catastrophic thinking (27). These subgroups, who demonstrated different psychological profiles, were validated in a second sample. The profile patterns of the subgroups indicate that different management strategies may be relevant in each subgroup. However, in everyday clinical practice the assessment of psychological risk profiles for disability through the use of extensive questionnaires is likely to be inconvenient and too time-consuming. A more feasible method would be to use a self-administered, short screening questionnaire based on well-known and validated instruments. The objective of such a screening instrument would be to identify subjects with high or low risk for disability, but also to produce the individual risk profile of the patient. The purpose of the screening procedure would be to enable clinicians to allocate patients to the right type of treatment.
The overall aim of this study was to develop a short, clinically applicable screening instrument for use in primary healthcare physical therapy. Two secondary aims were: (i) to investigate the reproducibility of cluster subgroups identified with more extensive questionnaires by the use of the screening instrument; and (ii) to test the psychometric properties of the screening instrument.
METHODS
A cross-sectional, correlational and comparative study design was used.
Setting, sample and procedure
Two samples were included. Participants in sample 1 were recruited consecutively among persons seeking care at the physical therapy departments within the Swedish county council primary healthcare centres in a university town with 190,000 inhabitants and surrounding rural communities of 50,000 inhabitants. Participants in sample 2 were recruited consecutively among persons seeking care at the physical therapy department in the same university town as above, and 3 smaller towns of 50,000–100,000 inhabitants. Additional participants in sample 2 were recruited among persons seeking care at the physical therapy department of the occupational healthcare organization in a middle-sized industry in a fourth Swedish town with 100,000 inhabitants. The inclusion criteria for participation in both samples were: age range 18–65 years, MSP (neck/shoulder, low back), no signs of trauma, no malignant, infectious or systemic disease, ability to understand written and spoken Swedish, and duration of MSP at least 4 weeks. Thus, both sub-acute (4 weeks to 3 months) and chronic (> 3 months) patients with MSP were included. In sample 1, 280 subjects agreed to participate and 215 (77%) returned the questionnaires. In sample 2, 138 subjects agreed to participate and 93 (68%) returned the questionnaires. For further details of the 2 samples, see Table I.
| Table I. Background data for sample 1 and 2 in the present study. |
| Background data | Sample 1 (n = 215) | Sample 2 (n = 93) |
| Female/male, n (%) | 162/53 (71/29) | 56/37 (60/40) |
| Mean age, years (SD, range) | 45 (13, 19–65) | 48 (11, 21–64) |
| Median duration of pain, 25th and 75th, months (range) | 12 4 and 48 (1–288) | 19 4 and 72 (1–364) |
| Single pain site, n (%)a | 90 (42) | 32 (34) |
| Multiple pain sites, n (%)a | 102 (47) | 61 (66) |
| aWhen numbers do not add up to total number or 100% there are missing values in the background data. SD: standard deviation. |
Patients meeting the inclusion criteria were informed verbally about the study by the physical therapist at their first visit. After agreeing to participate, patients were given written information about the study, a brief form to obtain background and demographic data, and the questionnaires. Patients were asked to complete the questionnaires at home and to return them by post to the investigator.
Measurements
The following instruments were used in a cluster analysis to generate subgroups among patients in PHC (27) and therefore used in this study as the “gold standard” against which the new screening instrument was tested. The instruments focus on MSP in general, and can be used for assessments of patients with MSP, who demonstrate pain from various and multiple pain locations.
The Pain Disability Index (PDI) (28) measures the degree to which functional ability in the following 7 areas of life are disrupted by chronic pain: family/home responsibilities, recreation, social activity, occupation, sexual behaviour, self-care and life-supporting activities. The response format is a numerical rating scale where 0 = no disability and 10 = total disability. The time frame is not defined. The PDI was translated into Swedish by the third author, and the translation was checked by a bilingual person whose native language is English. Internal consistency of the Swedish version of PDI was good for sample 1 (α = 0.85) and for sample 2 (α = 0.85)
The Tampa Scale of Kinesiophobia (TSK) (17) measures fear of movement/(re)injury in individuals with pain. The TSK consists of 17 items scored on a 4-grade scale where 1 = strongly disagree and 4 = strongly agree. The time frame is not defined. The TSK was translated into Swedish by the third author, and the translation was checked by a bilingual person whose native language is English. Internal consistency for the Swedish version of TSK was fair (α = 0.74) for sample 1 and good for sample 2 (α = 0.80).
The Catastrophizing subscale (CAT) of the Coping Strategies Questionnaire (CSQ) (29) attempts to measure negative self-statements, catastrophizing thoughts and ideation in patients with chronic pain. The subscale consists of 6 items scored on a 6-grade scale, where 0 = never and 5 = always. Internal consistency of the Swedish version of the CSQ was fair to good in a study by Jensen & Linton (30). To ensure validity, the Swedish version of the CSQ was used in its entirety, but only the CAT subscale was used in the analyses. Internal consistency of the CAT subscale was good for sample 1 (α = 0.85) and sample 2 (α = 0.80).
The Self-Efficacy Scale (SES) (31) was initially designed to measure perceived self-efficacy in performing 20 common activities relevant to patients with chronic low back pain. In the Swedish version the introductory text was modified, substituting “back pain” with “pain”. The response format is 11-grade numerical rating scales, where 0 = not at all confident and 10 = very confident. The time frame is not defined. The SES was translated into Swedish by the third author, and the translation was checked by a bilingual person whose native language is English. Internal consistency of the SES was good for sample 1 (α = 0.93) and sample 2 (α = 0.94).
Development of the screening instrument and data analysis
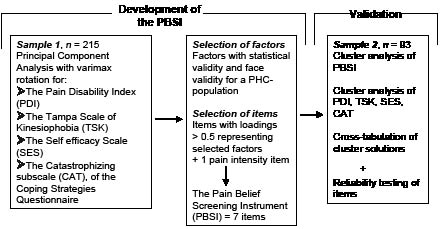
The methods used in relation to the 2 samples are outlined in Fig. 1.
For development of the Pain Belief Screening Instrument (PBSI), principal component analyses (PCA) with varimax rotation, were performed on the results for each of PDI, TSK, SES and CAT in sample 1. The purpose of a PCA is to extract a small number of components (hereafter named “factors”), from a large number of variables or items (32). Initially, factors with statistical validity and face validity for a PHC population were chosen from each of the instruments. Secondly, items with loadings > 0.5 in these factors were selected as singular questions in the PBSI. Thus, the items were considered operational representations (33) for each underlying factor. Finally, one item regarding pain intensity in the previous week was added.
Fig. 1. Methods used in relation to the 2 samples in the present study.
The response format for all items in the screening instrument was an 11-grade numerical rating scale (NRS). Pain intensity was represented by one item, where 0 = no pain and 10 = worst imaginable pain (34).
For validation of the PBSI, cluster analysis (35), based on the K-means algorithm, was performed on sample 2’s data from the screening instrument and the original instruments (PDI, TSK, CAT and SES). Subjects were classified into subsets containing similar characteristics, and subgroups were identified by minimizing within-group distances and maximizing between-group distances. Data were transformed into z-scores due to different response formats in the original instruments. Based on findings from an earlier study (27), a 3-cluster solution was chosen for cluster analyses. The ability of the screening instrument to detect subgroups consistent with those defined by the original instruments was examined by cross-tabulating the subgroups and calculating the kappa coefficients.
In order to obtain complete data-sets, occasional missing data in the original instruments were substituted by the individual’s scale median. This was done for about 20% of the subjects, i.e. 0.7% of all items were substituted by such individually derived raw scores. In the screening instrument no missing data were substituted (missing data < 1%)
The reliability of the items in the screening instrument was checked with Spearman rank correlation coefficient by examining the correlations between each item in the screening instrument and the corresponding item in the original instruments.
For statistical analyses the Statistical Packages for the Social Sciences (SPSS) was used.
The study was approved by the local ethics committee.
RESULTS
From the PCA of PDI, TSK, CAT and SES in total 11 factors were identified and, of these, 6 were chosen. One item from each of these factors was selected as singular questions in the PBSI, and one item covering pain intensity was added. This brought the number of items in PBSI to 7 (see Appendix).
Cluster analysis resulted in 3 subgroup profiles and these were compared through cross-tabulation with the original instruments cluster subgroups, with poor agreement. After collapsing 2 of the 3 cluster subgroups, the subsequent cross-tabulation showed moderate to substantial agreement between subgroups in PBSI and those in the original instruments. Reliability for items in the PBSI was acceptable.
Principal component analyses for PDI, TSK, CAT and SES
For PDI a 2-factor solution, including: (i) Voluntary activities and (ii) Basic personal activities, explained 69% of the total variance in scores.
In the PCA of TSK 5 factors were identified, cumulatively accounting for 55% of the explained variance of the total scores. One factor was excluded due to low communality. The remaining 4 factors were labelled consistent with a high loading item in each factor: (i) Fear; (ii) Avoidance; (iii) Confrontation of movement; and (iv) Confrontation of pain.
For SES, 3 factors were derived from the PCA: (i) Recreational and social activities; (ii) Heavy tasks; and (iii) Less heavy daily activities. These 3 factors explained 63% of the variance. Finally, PCA on the 6 items in the CAT subscale identified one single factor, catastrophic thinking, which explained 58% of the variance in the factor.
In the PBSI the following factors were represented by items as follows. The items derived from these factors demonstrated both face validity for a PHC population and had loadings above 0.50 in the factor.
The PDI-factor Voluntary activities was represented with one item. This factor was chosen as the most relevant for primary healthcare patients. In addition, this factor contained 5 of the 7 items and explained the major part, 54%, of the variance in the PDI. For TSK 2 factors, Fear and Avoidance, were represented with one item each. Thus, items focused on risk factors and not on confronting behaviour. The SES was represented by 2 items concerning activities in sitting positions (from the factor Recreational and social activities) and activities in standing positions (from the factor Less heavy, daily activities) (Table II).
| Table II. Items selected for inclusion in the screening instrument from factors derived from factor analyses of PDIa, SESb, TSKc, and the CAT subscale of CSQd, and item-loadings in each factor. |
| Instrument | Factors | Item/s in the original instrument (shortened version) | Item loading in the factor |
| PDI | Voluntary activities | 1. Responsibility for home and family | 0.81 |
| SES | Social activities | 15. Go to a movie | 0.76 |
| Light household activities | 3. Go shopping | 0.70 |
| TSK | Fear | 3. My body signals serious harm | 0.69 |
| Avoidance | 10. Avoiding movements is the safest to do | 0.53 |
| CAT subscale of CSQ | Catastrophic thinking | 12. Pain is overwhelming | 0.79 |
| PDI: Pain Disability Index; SES: Self-Efficacy Scale; TSK: Tampa Scale of Kinesiophia; CAT: Catastrophizing subscale; CSQ: Coping Strategies Questionnaire. |
Reproducibility of subgroups and reliability of items
Cluster analysis of the PBSI identified 3 different cluster subgroup profiles (Table III). One subgroup, labelled Fear-avoidant, displayed high scores on fear-avoidance and catastrophizing items, low on degree of functional ability, and moderate on self-efficacy (31% of the sample). A second subgroup, labelled Low Self-efficacy, displayed low scores on self-efficacy items, low scores on degree of functional ability, and low on fear-avoidance and catastrophizing items (16% of the sample). A third subgroup, labelled High Self-efficacy and Low Fear-avoidance, scored high on self-efficacy, high on degree of functional ability and low on fear-avoidance and catastrophizing items (54% of the sample).
| Table III. K-means cluster analysis for Pain Belief Screening Instrument (PBSI). Means and standard deviations (SD) of the 3-cluster solution in sample 2 (n = 93). Incomplete data; n = 2. |
| Item | Cluster subgroups |
| 1. Fear-avoidant n = 27 Mean (SD) | 2. Low Self-efficacy n = 15 Mean (SD) | 3. High self- efficacy and Low fear-avoidance n = 49 Mean (SD) |
| 2. Functional ability | 4.5 (2.5) | 4.2 (1.6) | 7.1 (2.4) |
| 3. Fear | 7.6 (3.1) | 2.2 (1.7) | 3.7 (3.0) |
| 4. Avoidance | 7.6 (2.2) | 2.5 (1.8) | 2.1 (2.1) |
| 5. Catastrophizing | 6.3 (2.2) | 3.8 (2.5) | 4.0 (3.0) |
| 6. Self-efficacy social activities | 6.1 (3.2) | 3.7 (3.3) | 9.5 (1.1) |
| 7. Self-efficacy light household activities | 6.7 (2.6) | 4.0 (2.7) | 9.1 (1.8) |
Cross-tabulation of the 2 separate 3-cluster solutions, from the PBSI and the original instruments, established that the PBSI could not sufficiently well allocate patients to cluster subgroups as determined by the original instruments (κ = 0.36, p < 0.001).
The cluster subgroups Fear-avoidant and Low Self- efficacy were then merged into one group for both the original instrument and the screening instrument cluster solutions. This resulted in 2 cluster subgroups for both the PBSI and the original instruments, instead of 3 (see Table IV). These cluster subgroups were then cross-tabulated demonstrating moderate to substantial agreement between the PBSI cluster subgroup classification and the original instruments cluster subgroup classification (κ = 0.61, p < 0.001).
| Table IV. The number of subjects in the cluster subgroups of the Pain Belief Screening Instrument (PBSI) and original instrumentsa respectively, with 2 of the 3 subgroups merged into one subgroup in sample 2 (n = 93). Incomplete data = 2. |
| Cluster subgroups | PBSI n | Original instrumentsa n |
| Low self-efficacy or high fear-avoidance | 42 | 52 |
| High self-efficacy and low fear-avoidance | 49 | 39 |
| Total | 91 | 91 |
| aPain Disability Index, Tampa Scale of Kinesiophobia, Catastrophizing subscale of Coping Strategies Questionnaire, and Self-Efficacy Scale. |
Pain intensity was the first item in the PBSI, but a non-existing item in the original instruments, and therefore not included in either the cluster analyses, or the cross-tabulations. Therefore, independent t-test was used for comparison of pain-intensity between the final 2 subgroups of the PBSI. The high self-efficacy and low fear-avoidance subgroup had lower pain intensity (mean 5.1, SD 1.8) than the low self-efficacy/high fear-avoidance subgroup (mean 6.5, SD 1.8) (t [89] = 3.76, p < 0.001), although the mean score difference can be presumed to be clinically insignificant.
Reliability was tested by correlating the individual score on an item in the PBSI with the individual score on the corresponding item in the original instruments. Correlations were moderate to high between items in the PBSI and the corresponding items in PDI, TSK, SES and subscale CAT in CSQ (rs 0.50–0.80, p < 0.01).
DISCUSSION
A short and clinically applicable screening instrument for use in primary healthcare physical therapy, on patients with long-term MSP, was developed. In the present study 2 subgroups of patients with persistent MSP in primary healthcare, i.e. high- or low-risk profiles for pain-related disability, were identified, and these 2 subgroups were replicated by the screening instrument. Boersma & Linton (5) also identified 2 main subgroups with high- or low-risk profiles in a group of PHC-patients with acute and sub acute neck- and back pain. The high-risk group contained 2 subgroups where patients had high disability, pain intensity and fear-avoidance or the same in combination with depressed mood (5). In the present study on patients with subacute or chronic MSP measures of catastrophizing and self-efficacy were included but not mood. Despite differences in objectives, patient characteristics and duration of pain in the 2 studies of screening instruments, the corresponding results suggest that screening is a method of identifying subgroups of patients among patients with MSP in PHC.
Two samples were recruited from different PHC settings and at different times. The characteristics of these 2 samples were similar to those in other PHC studies (1, 2, 36) and suggest that there are general patterns in the findings of this study. Consistent with an earlier study (6), the present subgroups did not score as high on pain interference and disability as pain clinic patients. Furthermore, the large dispersion around score means for each item in the PBSI cluster subgroups displayed the heterogeneity typical of an unselected PHC sample. Mean pain intensity differed between screening cluster subgroups, with a lower mean score in the low-risk group. However, the clinical importance of a mean difference of 1.4 in pain intensity rating could be questioned. The small differences in pain intensity ratings between patients scoring high or low on functional ability found in this study is consistent with earlier findings for patients with PHC (20), where pain intensity explained only a small proportion of the variance in disability scores and in only 1 of 2 samples.
The aim of the present study was to develop and validate a screening instrument for a particular patient population and it was therefore not within the scope of this study to examine the correlations between disability and pain duration or number of pain sites. However, pain duration appears not to relate to disability in patients with PHC (20). The relation between localized or generalized pain and disability in a PHC population needs to be studied further.
In the screening instrument only “key information” was of interest, and therefore some factors found in PCA of SES and TSK were excluded. Furthermore, the clinical relevance for a PHC population was considered when one factor in PDI, Basic personal activities, was excluded. Not covering all components in the original instruments identified in the initial PCA may have caused the PBSI to miss-classify some of the patients as non-risk patients. However, the screening procedure is a first-order sorting procedure targeting psychological key factors for motor behaviour, and should be followed up by a more thorough assessment and analysis of the patient’s problem profile.
The validity of the cluster solutions needs to be considered. Cluster analytical methods are statistical methods to define rather than to discover subgroups in heterogeneous samples, and cluster analysis invariably generates a classification solution (37). In the present study the initial choice of a 3-cluster solution was based on a cluster analysis on a PHC sample, which was validated through replication on a second PHC sample (27) and therefore also considered valid for this sample.
By cross-tabulating cluster solutions of the screening instrument and the original instruments, we examined the ability of the PBSI to replicate subgroups defined by the original instruments, PDI, TSK, SES and CAT. The findings of this study show that the PBSI could not separately define the subgroup with low self-efficacy and pain-related disability and the subgroup with high fear-avoidance and pain-related disability. However, the PBSI could define the mixed subgroup showing disability-related psychological risk factors and the subgroup showing a low degree of these factors, which speaks for its utility as a screening tool for clinical use. It is hoped that this initial screening will show the clinician the path forward in the management of the patient.
Correlations between PBSI items and the similar items in the original instruments were significant (p < 0.01), but low. As all instruments, including the PBSI, were to be filled in at the same time, inflated correlation coefficients were expected, due to subjects’ memory bias (38). One reason for low correlations could be that the context of each item in the original instruments is different from the context in the PBSI. More specifically, the items in PBSI covering activity level and catastrophizing displayed low correlations, possibly explained by different time frames and slight differences in wording. However, since the screening instrument is constructed for clinical use, assessor reliability is more important and will be the subject of a future study.
This was a cross-sectional study and the question of the predictive power of the PBSI, as well as cut-off points for a PHC population, will be addressed in future studies. Furthermore, the usefulness of the screening instrument as a tool for allocating patients to the most effective and cost-effective type of treatment will be investigated.
In conclusion, the screening instrument replicated the subgroup structure identified with its more extensive “parent” instruments fairly well. The reliability of items in the screening instrument was acceptable. Further testing of the instrument validity for a PHC population, in particular its predictive validity, is needed.
ACKNOWLEDGMENTS
Parts of this paper was presented as a poster on the 8th International Congress of Behavioral Medicine, August 2004, in Mainz, Germany.
This project was supported by The Swedish Research Council, grant number 46081435/22.
REFERENCES
1. Gureje O, Von Korff M, Simon G, Gater R. Persistent pain and well-being. A World Health Organisation study in primary care. JAMA 1998; 280: 147–151.
2. Gureje O, Simon G, Von Korff M. A cross-national study of the course of persistent pain in primary care. Pain 2001; 92: 195–200.
3. Andersson I, Ejlertsson G, Leden I, Scherstén B. Musculoskeletal chronic pain in general practice. Studies of health care utilisation in comparison with pain prevalence. Scand J Prim Health Care 1999; 17: 87–92.
4. Turk D, Rudy T. The robustness of an empirically derived taxonomy of chronic pain patients. Pain 1990; 43: 27–35.
5. Boersma K, Linton S. Screening to identify patients at risk. Profiles of psychological factors for early intervention. Clin J Pain 2005; 21: 38–43.
6. Johansson E, Lindberg P. Low back pain patients in primary care: subgroups based on the multidimensional pain inventory. Int J Behav Med 2000; 4: 340–352.
7. Schultz I, Crook J, Meloche G, Berkowitz J, Milner R, Zuberbier O, Meloche W. Psychosocial factors predictive of occupational low back disability: towards development of a return-to-work model. Pain 2004; 107: 77–85.
8. Nachemson A, Jonsson E, editors. Neck and back pain: the scientific evidence of causes, diagnosis, and treatment. Philadelphia: Lippincott Williams & Wilkins; 2000.
9. Linton S. Psychological risk factors for neck and back pain. In: Nachemsson A, Jonsson E, editors. Neck and back pain: the scientific evidence of causes, diagnosis, and treatment. Philadelphia: Lippincott Williams & Wilkins; 2000, p. 57–78.
10. Overmeer T, Linton S, Boersma K. Do physical therapists recognise established risk factors. Swedish physical therapists’ evaluation in comparison to guidelines. Physiother 2004; 90: 35–41.
11. Lackner J, Carosella A, Feuerstein M. Pain expectancies, pain, and functional self-efficacy expectancies as determinants of disability in patients with chronic low back disorders. J Consult Clin Psychol 1996; 64: 212–220.
12. Vlaeyen J, Linton S. Fear-avoidance and its consequences in chronic musculoskeletal pain: a state of the art. Pain 2000; 85: 317–332.
13. Picavet S, Vlayen J, Schouten J. Pain catastrophizing and kinesiophobia: predictors of chronic low back pain. Am J Epidemiol 2002; 156: 1028–1034.
14. Bandura A. Self-efficacy. The exercise of control. New York: WH Freeman and Co.; 1997
15. Jensen M, Turner J, Romano J. Self-efficacy and outcome expectancies: relationship to chronic pain coping strategies and adjustment. Pain 1991; 44: 263–269.
16. Asghari A, Nicholas M. Pain self-efficacy and pain behaviour. A prospective study. Pain 2001; 94: 85–100.
17. Kori S, Miller R, Todd D. Kinesiophobia: a new view of chronic pain behaviour. Pain Management 1990; 35–43.
18. Al-Oubadi S, Nelson R, Al-Awadhi S, Al-Shuwaie N. The role of anticipation and fear of pain in the persistence of avoidance behavior in patients with chronic low back pain. Spine 2000; 25: 1126–1131.
19. Turner J, Jensen M, Romano J. Do beliefs, coping, and catastrophizing independently predict functioning in patients with chronic pain? Pain 1999; 85: 115–125.
20. Denison E, Åsenlöf P, Lindberg P. Self-efficacy, fear-avoidance, and pain intensity as predictors of disability in subacute and chronic musculoskeletal pain patients in primary health care. Pain 2004; 111: 245–252.
21. Boersma K, Linton S, Overmeer T, Jansson M, Vlayen J, de Jong J. Lowering fear-avoidance and enhancing function through exposure in vivo. A multiple baseline study across six patients with back pain. Pain 2004; 108: 8–16.
22. Moseley G. Evidence for a direct relationship between cognitive and physical change during an education intervention in people with chronic low back pain. Eur J Pain 2004; 8: 39–45.
23. Lorig K, Sobel D, Ritter P, Laurent D, Hobbs M. Effect of a self-management program on patients with chronic disease. Effect Clin Prac 2001; 4: 256–262.
24. Åsenlöf P, Denison E, Lindberg P. Individually tailored treatment targeting activity, motor behaviour, and cognitions reduces pain-related disability: a randomized controlled trial in patients with musculoskeletal pain. J Pain 2005; 6: 588–603.
25. Bergström G, Jensen I, Bodin L, Linton S, Nygren Å. The impact of psychologically different patient groups on outcome after a vocational rehabilitation program for long-term spinal pain patients. Pain 2000; 93: 229–237.
26. Haldorsen E, Grasdal A, Skouen J, Risa A, Kronholm K, Ursin H. Is there a right treatment for a particular patient group? Comparison of ordinary treatment, light multidisciplinary treatment, and extensive multidisciplinary treatment for long-term sick-listed employees with musculoskeletal pain. Pain 2002; 95: 49–63.
27. Denison E, Åsenlöf P, Sandborgh M, Lindberg P. Musculoskeletal pain in primary health care: subgroups based on pain intensity, disability, self-efficacy, and fear-avoidance variables. J Pain 2007; 8: 67–74
28. Chibnall J, Tait R. The Pain Disability Index: Factor Structure and Normative Data. Arch Phys Med Rehabil 1994; 75: 1082–1086.
29. Rosenstiel A, Keefe F. The use of coping strategies in chronic low back pain patients: Relationship to patient characteristics and current adjustment. Pain 1983; 17: 33–44.
30. Jensen I, Linton S. Coping Strategies Questionnaire (CSQ): reliability of the Swedish version of the CSQ. Scand J Behav Ther 1993; 22:139–145.
31. Altmaier E, Russel D, Kao C, Lehmann T, Weinstein J. Role of self-efficacy in rehabilitation outcome among chronic low back pain patients. J Couns Psychol 1993; 40: 335–339.
32. Tabachnick B, Fidell L, editors. Using multivariate statistics. 4th edn. Boston: Allyn and Bacon; 2001.
33. Gorsuch R, editor. Factor analysis. New Jersey: Lawrence Erlbaum Associates; 1983.
34. Jensen M, Karoly P. Self-report scales and procedures for assessing pain in adults. In: Turk D, Melzack R, editors. Handbook of pain assessment. London: The Guilford Press; 1992, p. 135–151.
35. Aldenderfer M, Blashfield R, editors. Cluster analysis, 4th edn. Beverly Hills: Sage Publications; 1987.
36. Andersson H. The epidemiology of chronic pain in a Swedish rural area. Qual Life Res 1994; 3: 19–26.
37. Klapow J, Slater M, Patterson T, Doctor J, Atkinson J, Garfin S. An empirical evaluation of multidimensional clinical outcome in chronic low back pain patients. Pain 1993; 55: 107–118.
38. Carmines E, Zeller R. Reliability and validity assessment. In: Sullivan J, editor. Quantitative applications in the social sciences. Sage University Paper; 1980.
| APPENDIX. The Pain Belief Screening Instrument and Original Item-list. |
| Item in the PBSI | Original item-list from PDI, TSK, CAT, SES | Response format: 0–10, endpoints |
| 1. | Pain intensity, not in original instruments. | 0 = no pain | 10 = pain as bad as it could be |
| 2. | PDI, item 1. This category refers to activities related to the home or family. It includes chores or duties performed around the house (e.g. yard work) and errands or favours for other family members (e.g. driving the children to school). Note: Scores are reversed in the PBSI. | 0 = not at all | 10 = to a high degree |
| 3. | TSK, item 10. Simply being careful that I do not make any unnecessary movements is the safest thing I can do to prevent my pain from worsening. | 0 = do not agree at all | 10 = fully agree |
| 4. | TSK, item 3. My body is telling me I have something dangerously wrong. | 0 = do not agree at all | 10 = fully agree |
| 5. | CAT, item 12 in CSQ. It is awful and I feel it overwhelms me. | 0 = do not agree at all | 10 = fully agree |
| 6. | SES 15. How confident are you about your ability to go to a movie? | 0 = not at all confident | 10 = very confident |
| 7. | SES 3. How confident are you in your ability to go shopping? | 0 = not at all confident | 10 = very confident |
| PBSI: Pain Belief Screening Instrument; PDI: Pain Disability Index; TSK: Tampa Scale of Kinesiophia; SES: Self-efficacy Scale. |