OBJECTIVE: The aim of this study was to investigate the psychometric properties of the Norwegian version of the Tampa Scale of Kinesiophobia in patients with low back pain and in patients with more widespread pain distribution including low back pain.
SUBJECTS: A total of 120 subjects, 48 with isolated low back pain and 72 with more widespread pain distribution were included.
Design and METHODS: The Norwegian translation of the Tampa Scale of Kinesiophobia, Hopkins Symptom Check List 25 question version and Fear Avoidance Behaviour Questionnaire were completed. The properties of the Norwegian translation of the Tampa Scale of Kinesiophobia were explored by a Rasch analysis.
RESULTS: The Tampa Scale of Kinesiophobia fitted the Rasch model and passed the independent t-test for a unidimensional scale. The response categories for some of the items needed to be collapsed from 4 to 3 levels. Only the item “It’s not really safe for a person with a condition like mine to be physically active” was significantly different in men and women.
CONCLUSION: The Norwegian translation of Tampa Scale of Kinesiophobia seems to reflect a unidimensional construct of kinesiophobia. The scale seemed to be quite robust across age and gender, and the response patterns to the items were similar in patients with low back pain and widespread pain distribution including low back pain.
Key words: Tampa scale, kinesiophobia, pain, Rasch analysis, fear avoidance.
J Rehabil Med 2007; 39: 672–678
Correspondence address: Cecilie Røe, Department of Physical Medicine and Rehabilitation, Ulleval University Hospital, NO-0407 Oslo, Norway. E-mail: eller@medisin.uio.no
Submitted December 13, 2006; accepted July 4, 2007.
Introduction
The purpose of the present study was to assess the psychometric properties of the Tampa Scale of Kinesiophobia (TSK). The TSK questionnaire aims to assess fear of movement in patients with chronic musculoskeletal pain (1). Fear of movement is believed to be a significant factor in the development of chronic pain, and in some studies, kinesiophobia as evaluated by the TSK, has been shown to help predict pain disability (2–5).
Fear of movement may be regarded as one phenomenon within a framework of a Fear- Avoidance Theory (6, 7). The essence is that the experience of pain leads to fear, which leads to avoidance behaviour, such as avoiding movements connected with physical activity during daily life, exercise, or work activities. Central constructs in these theories are pain-related fear, fear of movement/fear of re-injury and fear-avoidance beliefs (1, 6–8).
Pain-related fear is based on an understanding of pain as a sign of harmful bodily processes, and makes any pain connected with physical activity interpretable as potentially dangerous. This interpretation leads to attention being focused on the source of the threat; in this case bodily sensations are interpreted as signs of serious health problems (9). Depending on the person’s individual history, personality and genetics, they will develop a fear, and therefore avoidance, of movement and physical activity (2, 7). The fear of physical activity and the subsequent avoidance behaviour has also been described as a phobic fear of movement, kinesiophobia, connected with chronic pain behaviour (1). Kinesiophobia refers to “an irrational and debilitating fear of physical movement resulting from a feeling of vulnerability to painful injury or re-injury” (1). The phenomenon has later also been described as fear of movement/re-injury, and refers to an idea of having a vulnerable, easily harmed body, and that movement may cause re-injury (2).
Two of the main instruments developed based on these theories are the Fear Avoidance Beliefs Questionnaire (FABQ) (7, 10) and the TSK, originally a 17-item instrument containing 4 reversed questions (1). The FABQ focuses on the relationship between pain and physical activity, and pain and work activity. The questionnaire has been found to be a valid instrument for the assessment of fear avoidance beliefs across patients with low back pain (LBP) (7) and has been validated in Norwegian. The TSK focuses on beliefs of pain and exercise, and it is not related to work situations. It has been translated into Dutch and Swedish (2, 11). Furthermore, it has been found to be a valid and reliable instrument for estimating the fear of movement and re-injury in patients with LBP as well as in patients diagnosed as having fibromyalgia (5, 12, 13). It was recently translated into Norwegian by Julsrud Haugen and Grøvle (Sarpsborg Hospital, Norwegian translation of TSK, unpublished), and not yet validated. Nor, to our knowledge, has it been tested on patient groups with LBP in association with more widespread pain, like the one presented in the present study. Most of the patients presenting at the clinic have more widespread pain, typically neck and shoulder pain in addition to LBP. It would thus be of interest to investigate the level of fear of movement/re-injury in this patient group too.
Studies of the TSK have revealed various factor structures, from 1 to 5 factors (2, 5, 11, 12, 14). However, agreement has been reached regarding a 13-item version with exclusion of the reversed items (12), and has been used in the present study. A 4-factor structure, including factors labelled harm, fear of re-injury, importance of exercise, and activity avoidance has been used in patients with LBP (12). However, in other studies, several other factor structures have also been identified in patients with LBP, with respect both to the number of factors and to the items included in the factors (5, 11, 12). The unstable factor structure may be caused by differences between populations, as well as translation bias and cultural differences. The factor structure presented in these studies was based both on the principal component and related parametric analysis, and on subsequent confirmatory analysis. As the TSK represents an ordinal, but not necessarily an interval, scale, and the variance in different groups with respect to fear of movement/re-injury may vary, other approaches for investigating the properties of this scale may be needed. More recently, models based on the Rasch measurement model (15), have been developed further for application to the multiple response categories of Andrich (16). This approach will help investigate the underlying constructs of measurements. Ideally a measurement should reflect a single construct, often termed unidimensional (17). The Rasch analysis also allows investigation of item and person responses and ordering the response categories (18). The ordering of the items in this context reflects the degree to which the items reflect the fear of movement trait. This type of evaluation of the items in measurements of fear avoidance and fear of movement has not been undertaken previously. However, the previous factor structure might indicate that the questions about exercise reflected more of the fear of movement/re-injury trait than the other questions. Hence, the other questions are often grouped in a somatic factor according to previous factor structures (5). As age and gender have been shown to influence measurements reflecting psychological traits and quality of life (19), these factors should be taken into consideration when evaluating a measurement. In addition, gender differences in pain are well known (20) and have been assumed to influence the item responses in TSK. The reported differences in factor structure in patients with LBP and fibromyalgia could indicate variance across subjects with LBP and more generalized pain (14).
Hence, the aims of the present study were to use Rasch analysis to examine:
• the fit of the items and their response categories
• the fit and distribution of the subjects
• whether the pain distribution, age, or gender influenced the response pattern to TSK
• whether the translated version of TSK reflects an unidimensional construct.
Material and methods
Subjects
Patients were recruited from subjects referred to The University Hospital of Northern Norway, Department of Physical Medicine and Rehabilitation in the period October 2005 to March 2006 inclusive. An invitation to participate in the study, information about the study and a consent form, along with the questionnaires were posted to the patients a few weeks before they entered the department. A total of 265 patients met the inclusion criteria and were invited to participate. The patients were asked to fill in the questionnaires and bring them with them to their first consultation. A total of 120 patients gave informed consent and had completed the questionnaires satisfactorily. All patients with pain including the low back, and complete registrations in TSK, FABQ and Hopkins Symptoms Checklist (HSCL-25), were included. The study was approved by the Norwegian Regional Committee for Medical Research Ethics.
Procedure
The distribution of pain during the last 2 weeks was marked in the Norwegian form of the McGill Pain Questionnaire (21). According to the pain drawings and pain ratings last week on a numeric scale, the patients were grouped as subjects with LBP (pain localized to the low back, and low back and leg), and as subjects with LBP in association with more widespread pain (WP) (i.e. low back/leg pain and pain in additional body areas). Patients with pain drawings covering more than one area were classified as WP if their scores on the numeric scale was higher than “2” in both the back/leg and the other areas. The questionnaires also comprised information about socio-demographic data, work-load and work satisfaction, physical activity, and previous treatment.
The Tampa scale of kinesiophobia (TSK). A 13-item questionnaire aimed at the assessment of fear of movement/re-injury. Each item is provided with a 4-points Likert scale with scoring alternatives ranging from “strongly disagree” [0] to “strongly agree” [4] (12). This gives a possible total raw score range from 0 to 52. With their permission, we used a version translated by Julsrud Haugen and Grøvle. This translation was based on a bilingual forward and backward translation followed by a consensus conference as recommended by Beaton et al. (22).
The fear avoidance beliefs questionnaire (FABQ). The FABQ consists of 2 scales: 5 items focus on fear avoidance beliefs of physical activity and 11 items focus on fear avoidance beliefs of work. The scoring options were on a 6-level Likert scale ranging from “totally disagree” [0] to “totally agree” [6]. Four items are used for the FABQ “physical activity” using a raw score from 0–24.
Hopkins symptoms check list (HSCL-25). The HSCL-25 (23), Norwegian version (24), contains 25 questions comprising the dimensions of somatization (items 3, 8, 11, 14, 15, 16 and 24). It is scored on a 4-level Likert scale, ranging from not at all [0] to very much [4]. This gives a possible total raw score range for HSCL-25 from 25 to 100 and for the dimension of somatization from 7 to 28.
Pain. Pain intensity during rest and activity were reported on a numeric scale, ranging from 0 (no pain) to 10 (worst imaginable pain). Pain was reported for low back, leg, neck/shoulder/arm, both during rest and activity.
Statistics
Gender differences between the LBP and WP groups were investigated by Fischer’s exact test. The group differences with respect to TSK and HSCL-25 scores were examined by the t-test for independent samples.
Rasch analysis. Internal construct validity of the TSK was explored by a Rasch analysis. This model assumes that the probability of a patient affirming a trait, for example fear of movement/re-injury, in an item of a questionnaire depends on the patient’s level of that trait (θ) and the level of fear of movement/re-injury expressed by the item (b). In a model where there are several response categories the model is expressed as (16):
ln (Pni/1-Pni) = θn-bi-τi
where Pni is the probability that a person n will affirm the item, θn is the person’s level of the trait, and bi is the level of the trait expressed by the item, and τi represents the 0.5 probability point (threshold) between adjacent response categories for that item. The responses are distributed along a logit scale. The partial credit variant was applied as this model is valid without assumption of equidistance between thresholds across items (25).
The overall summary fit was evaluated by the χ2 item trait interaction statistics. This represents the added χ2values for the individual scale items, and the probability value (p) is determined according to the summated degrees of freedom (25). A non-significant probability value indicates no substantial deviation from the model, and a hierarchical ordering of the scale items across all levels of the underlying trait. Two subsets of items were created, representing the items with the most positive and most negative residuals according to a Principal Component Analysis. Person estimates for each of the 2 subsets were calculated, and independent t-tests comparing the 2 estimates in each person were performed. Number of t-tests with p-values below 0.05 and the corresponding confidence interval (CI) were reported.
The individual persons and items were reported as mean and standard deviation (SD), and a mean of 0 and SD of 1 represent optimal fit. The fit of the items was statistically evaluated by residuals and χ2 statistics. Item residuals ± 2.5 and a non-significant χ2 probability value were considered to indicate adequate fit to the Rasch model (26). The person separation index is reported, providing an indication of the power of the measure to discriminate among persons with different levels of the trait. A value above 0.8 was deemed to differentiate across at least 3 patient groups.
Differential item function (DIF) was based on analysis of variance for each item, comparing scores across each level of age, gender and pain distribution (27). DIF for age was analysed, grouping the subjects below and above the median age of 42 years. Both significant main effects of age, gender and pain distribution (uniform DIF), and interaction (non-uniform DIF) between age, gender and pain distribution and subgroups of the patients (class interval) were evaluated. F ratio (F) for the group difference and probability (p) were given. A significance level of 0.05 was adopted, adjusted for testing of 13 items for the fit, and 13 items and 2 groups for the DIF analysis (28). The Rasch analysis was performed in RUMM 2020 (RUMM laboratory, Perth, Australia). Other analysis was performed by SPSS for windows version 13.0.
Results
A total of 120 patients participated, 48 with LBP and 72 with WP. The mean age was 42 (SD 10) years in both groups. In the LBP group, 42% were females, 58% males. In the WP group, the gender distribution was 58% female and 42% males (p = 0.09). Slightly more than one-third of the subjects were single in both groups. Pain characteristics of these groups are given in Table I. FABQ scores for the “Physical activity” – dimension of the questionnaire were 13 (SD 6) for LBP and 14 (SD 5) for WP patients (p = 0.10). The HSCL-25 scores for somatization were 14 (SD 4) and 17 (SD 4) for LBP and WP, respectively (p = 0.92). The TSK scores were 31 (SD 6), and 31 (SD 7), for the LBP and WP groups, respectively (p = 0.17).
| Table I. Self-reported pain on a numeric scale, ranging from 0 = no pain to 10 = worst imaginable pain, during rest and activity |
| Activity/rest | Low back pain (n = 48) Median (range) | Widespread pain (n = 72) Median (range) |
| Low back pain during rest during activity | 5 (0–10) 7 (2–10) | 2 (1–10) 3 (0–10) |
| Leg pain during rest during activity | 3 (0–10) 5 (0–10) | 2 (1–10) 6 (0–10) |
| Neck/shoulder/arm pain during rest during activity | 0 (0–8) 0 (0–9) | 2 (2–10) 3 (2–10) |
The fit of the items and their thresholds
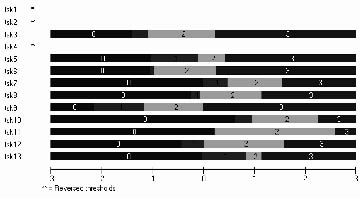
In general, the items were found to fit the model (mean item fit = 0.26 (SD 0.86). None of the items were outside the range of fit residual value of ± 2.5 (Table II). Positive locations of items 4 and 7–13, indicate that these items express above average of the trait captured by the TSK total score. However, items 1, 2 and 4 had reversed thresholds (Fig. 1). The probability threshold of these items was lower for Likert score 2 compared with 1. Hence, these items were re-scored according to a pattern of 0, 1, 1, 3. Meaning that response at level 1 and 2 are treated as the same category.
| Table II. Fit of the items of the Tampa Scale of Kinesiophobia (TSK) to the Rasch model |
| Item | Location | SE | Residual | χ2 | Probability |
| TSK 1. People aren’t taking my medical condition seriously enough | –0.52 | 0.12 | 1.36 | 4.47 | 0.11 |
| TSK 2. My body is telling me I have something dangerously wrong | –1.25 | 0.13 | 1.13 | 1.00 | 0.61 |
| TSK 3. My accident has put my body at risk for the rest of my life | –0.75 | 0.12 | 0.22 | 0.26 | 0.88 |
| TSK 4. I am afraid I might injure myself accidentally | 0.16 | 0.10 | 0.02 | 4.96 | 0.08 |
| TSK 5. If I were to try to overcome it, my pain would increase | –0.24 | 0.11 | 0.52 | 0.70 | 0.71 |
| TSK 6. Simply being careful that I do not make any unnecessary movements is the safest thing I can do to prevent my pain from worsening | –0.59 | 0.11 | –0.37 | 0.44 | 0.80 |
| TSK 7. I wouldn’t have this much pain if there weren’t something potentially dangerous going on in my body | 0.67 | 0.12 | 0.67 | 0.99 | 0.61 |
| TSK 8. Pain always means I have injured my body | 0.28 | 0.11 | –0.35 | 0.16 | 0.92 |
| TSK 9. Pain lets me know when to stop exercising so that I don’t injure myself | –1.03 | 0.12 | 1.17 | 5.91 | 0.05 |
| TSK 10. It’s not really safe for a person with a condition like mine to be physically active | 1.28 | 0.13 | –1.54 | 5.17 | 0.08 |
| TSK 11. I’m afraid that I might injure myself if I exercise | 1.01 | 0.12 | –0.17 | 0.85 | 0.66 |
| TSK 12. I can’t do all the things normal people do because it’s too easy for me to get injured | 0.39 | 0.11 | –0.52 | 2.15 | 0.34 |
| TSK 13. No-one should have to exercise when he/she is in pain | 0.65 | 0.12 | 1.28 | 0.21 | 0.90 |
| SE: standard error. | | | | | |
Fig 1. Threshold map showing the ordering of the scale levels of items (TSK 1–13) in the Tampa scale. The x-axis representing the logits, and the Likert score levels from 0 to 3 given for each item. Item TSK 1, 2 and 4 not visualized according to reversed threshold. For these items the probability threshold was lower for Likert score 2 compared with 1. The questions that the TSK items refer to are shown in Table II.
Fit of the subjects
The mean person fit was –0.17 (SD 1.15). The Person Separation Reliability was 0.87. Only 2 subjects were extremes and scored no fear of movement/re-injury at all. Both were males above 42 years of age with LBP.
Targeting
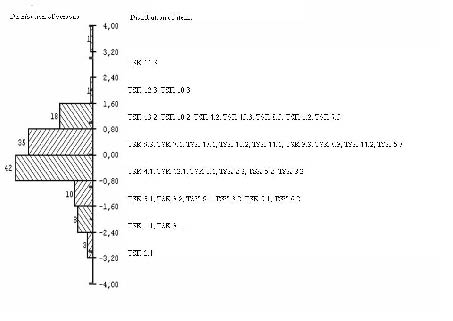
The items had a logit distributions from –3.2 to 3.2 (Fig. 2). The mean location for the persons was –0.208 (SD 1.12), indicating that the subjects have a slightly lower level of fear of movement/(re)-injury than the average scale items (expected to be 0 logits).
The items including physical activity and exercise were located in the upper hierarchy among the items. The threshold from some agreement to strongly agree for item 11 “I’m afraid that I might injure myself if I exercise” reflects the highest level of fear of movement/(re)injury, (Fig. 2). Hence, this item was difficult to endorse for almost all patients with LBP. The thresholds between strongly disagree and some disagreement for item 2: “My body is telling me I have something dangerously wrong” reflect the lowest level of fear of movement/re-injury. There is a gap in the upper level of the scale for the subjects, and none of the items expressed the absolute minimal or maximal (of the) trait of fear of movement/re-injury. However, the items and subjects are well distributed along the logit distribution with item and subject mean values close to each other. Hence, the targeting of the scale is quite good.
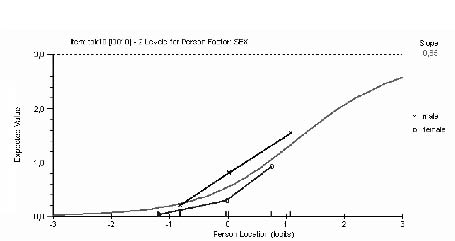
Fig. 2. Differential item functioning across gender for item 10: “It’s not really safe for a person with a condition like mine to be physically active”.
Invariance across age, gender and pain distribution
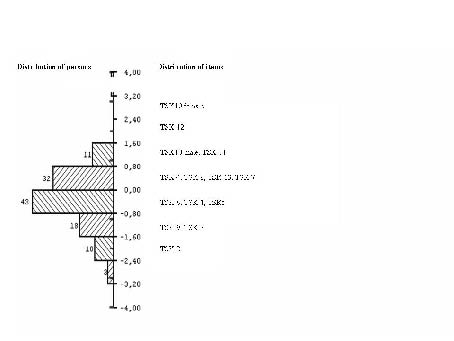
A uniform DIF of the item responses according to age, gender or pain distribution was not found, except for item 10, which varied according to gender. Assuming equal underlying levels of fear of movement/re-injury, men were more likely than women to think that it was not safe to be physically active with a condition like theirs (F = 12, p = 0.0006) (Fig. 3). The level mean for this item was 0.91 for men and 0.32 for women, and the location 0.81 (SE 0.17) for men and 2.64 (SE 0.23) for women (Fig. 4). Non-uniform DIF was not found for any item or person characteristics.
Fig. 3. Distribution of the threshold for the items and the subjects (n = 118, 2 extreme subjects excluded) along Rasch calibrated metric scale of the attribute being measured as kinesiophobia. The right-hand panel shows the location of the items and their thresholds are indicated by the decimal. The left-hand panel shows the distribution of persons. Item 2 in Tampa Scale of Kinesiophobia (TSK) (TSK 2) capturing least and item 11 (TSK 11) capturing most of the trait of fear of movement/re-injury. The questions which the TSK items refer to are shown in Table II.
Fig. 4. Distribution of the items and the subjects (n = 118, 2 extreme subjects excluded) along the Rasch calibrated metric scale of the attribute being measured as fear of movement/re-injury. The right-hand panel shows the location of the items. The left-hand panel shows the distribution of persons. The location of item 10 is given separately for men and women. The questions to which the Tampa Scale of Kinesiophobia (TSK) items refer are shown in Table II.
Construct unidimensionality
After re-scoring items 1, 2 and 4 as described above, the overall fit of the TSK to the Rasch model was evaluated. The χ2 item trait interaction statistics was 27.27, p = 0.40 and indicated a fit to the Rasch model. The overall fit indicates a unidimensional underlying construct of fear of movement/re-injury. However, the evaluation of unidimensionality was also based on analysis of the residual patterns of the Principal Component Analysis. Two subsets of items (2, 3, 5, 7 and 8) and (6, 10, 11, 12, 13) represented the items with the most positive and most negative residuals respectively. Person estimates for these 2-item sets were calculated and compared by independent t-tests. Although 9.1% of the tests were outside the range of ±1.96, the CI for this probability was 0.05 to 0.13 according to the binominal test, hence deemed as the acceptable border for unidimensionality of the scale as a whole.
Discussion
The present study clearly indicates that the Norwegian version of TSK represents a unidimensional construct capturing fear of movement/re-injury.
Validating a questionnaire means testing to what degree the questionnaire measures what it is meant to measure. In addition to the theoretical framework on which TSK is based (1), several aspects of the validity of this scale have been explored earlier (14). The scale has been tested and found reliable and its predictive value has been assessed (2). However, concern has been related to the construct validity of this instrument, that is; the underlying attribute(s) that is (are) captured (29). The construct validity of the TSK has been explored through factor analysis as well as through the known groups method (9, 11). Studies have revealed a factor structure from 1 to 5 factors (2, 5, 11, 12, 14). Also the loading of items in different factors varies (30). These results may indicate that the TSK does not represent a unidimensional underlying construct. However, methodological issues related to the TSK do not meet the strict requirements of a linear interval scale on which factor analysis is based (31). Hence, in the present study, a Rasch approach exploring the construct and properties of the TSK was used.
First of all, the Rasch approach offers a linear transformation of the ordinal raw score of the TSK (15, 16). Secondly, several other methodological aspects of the scale related to the fitting of single items, ordering of the response categories and the differential function across subgroups of subjects or patients can be evaluated. There is an ongoing discussion about the choice between the rating scale and the partial credit model in Rasch measurement. The rating scale model specifies that a set of items share the same rating scale structure, whereas the partial credit model specifies that each item has its own rating scale structure (32). As the TSK did not meet the requirements of the same rating scale structure across items, we chose the partial credit model.
The present translation of the TSK shows a reasonable fit to the Rasch model, and seems to represent a unidimensional underlying construct. We suggest that Rasch analysis represents a more valid analysis strategy for this type of measurements (33), and the discrepancy between the studies indicating multidimensionality is related to the factor analysis method, and not a translation bias. Our results agree with the conclusions reached by Houben et al. (34), even though this study did not apply a Rasch approach. Furthermore, it is the use of TSK without factorizing that has proved to predict disability (2, 35), and the internal consistency of all 13 items in the TSK was quite high.
The items 1:”People aren’t taking my medical condition seriously enough”, item 2:”My body is telling me I have something dangerously wrong” and item 4: “I am afraid I might injure myself accidentally”, had a problem with the threshold for scoring some disagreement.
This problem was solved by combining the responses “some disagreement” and “some agreement”. None of the items misfitted the model, whereas 2 male subjects did, scoring no fear of movement/re-injury at all. These subjects also reported no fear of avoidance on the FABQ physical dimension, supporting the relationship between fear of movement/re-injury and fear avoidance (2).
The TSK also seems to be well targeted. The scale also showed acceptable invariance, showing that the items responded consistently across age, gender and pain distribution. The number of subjects in the LBP group was only 48. However, based on the calculations of Elasoff (36), differences of 0.1 logits could be detected in DIF analysis in groups down to 25 subjects, given a power of 80%. It was only in the responses to the question “It’s not really safe for a person with a condition like mine to be physically active” that we observed a uniform difference between men and women. This item was the most difficult to endorse for women, whereas item 12 “I can’t do all the things normal people do because it’s too easy for me to get injured” was most difficult for the men, and item 10 the second most difficult to endorse. Thus, item 10 is in the upper hierarchy of the items for both sexes. The different order of item 10 between men and women could reflect gender differences regarding opinions on “things normal people do.” Hence, across gender fear of injury was reflected to a larger extent in the questions related to physical activity and exercise, than in the questions related to more general thoughts about what is going wrong in the body and provoking pain.
The invariance of a scale is important both because it confirms that the scale is measuring a consistent underlying construct, and because it can be applied to different patient populations. We did, however, find a uniform DIF for the question: “It’s not really safe for a person with a condition like mine to be physically active”. This result could indicate that the estimates should be performed separately for men and women, but we would recommend that this difference should be investigated in additional studies before strong recommendations are given. Furthermore, it is a matter of discussion of how different the present 2 patient groups really are, considering that both groups have LBP, and whether DIF might be found to a larger extent in patient populations with more differences. In agreement with the present results, previous studies using factor analysis have found acceptable internal consistency of TSK subjects both with acute and chronic LBP and with more widespread pain (12, 37). Furthermore, in a modified TSK version, a unidimensional construct is documented in subjects without pain (34), giving support to the results of invariance in the present study. However, the level of fear of movement/re-injury was similar in LBP and WP in the present study, and no DIF were found. Hence, it may be appropriate to use Rasch analysis applied to TSK in diagnostic groups with more differences than in the present study.
The Rasch analysis providing evidence for the measurement of a unidimensional construct does not provide any information about the nature of this construct. Previous studies have suggested different constructs measured by the TSK. “Somatic focus” (12), “Activity Avoidance factor” and “Fear of harm” (38) are constructs suggested to be reflected by the TSK. Burwinkle et al. (14) argues that the items in the TSK appear to reflect beliefs that do not necessarily relate to fear of movement, but assess a general sense of vulnerability.
Approximately half of the invited patients volunteered to participate in the present study. The inclusion based on only written information may give rise to a lower attendance rate and possibly a selection of subjects with higher level of education. However, the regional ethics committee had suggested this procedure to be preferable to the persuasion, which may be a problem when the patients are invited in the clinical situation. The HSCL-25 scores on the somatization dimension and the FABQ scores indicated that this group had higher levels of somatization and fear avoidance than the general population, which has been shown to be predictive to persistence of pain. With respect to gender and age distribution, there were no significant differences between participants and non-participants.
The response to TSK was explored in a population with dominating LBP or more WP pain. Leg pain in patients with LBP is assumed to have its origin from the back, either as a sign of nerve root affection or referred pain from the back muscles, and does not represent a more widespread pain pattern. A tendency was found towards there being more women in the WP group, which is in accordance with the gender distribution of more generalized pain in the Norwegian population (39). Otherwise the groups showed a similar level of fear of movement/re-injury and fear avoidance to that evaluated by the TSK and the FABQ scores. As the 2 patient groups turned out to be fairly similar regarding level of fear of movement/re-injury, and the LBP group was rather small, further analysis of invariance of the TSK may be warranted.
In conclusion, the Norwegian translation of TSK seems to reflect a unidimensional construct of fear of movement/re-injury. The internal consistency and criterion validity was acceptable, and the scale seemed to be quite robust across age and gender, and also for patients with LBP and WP.
AcknowledgementS
The authors wish to thank the Health and Rehabilitation Organisation for funding this study and Susan Schancke for help with the English language.
REFERENCES
1. Kori SH, Miller RP, Todd DD. Kinesiophobia: a new view of chronic pain behaviour. Pain Management 1990; 3: 35–42.
2. Vlaeyen JW, Kole-Snijders AM, Boeren RG, van EH. Fear of movement/(re)injury in chronic low back pain and its relation to behavioral performance. Pain 1995; 62: 363–372.
3. Vlaeyen JWS, Kole-Snijders AMJ, Rotteveel AM, Ruesink R, Heuts PHTG. The role of fear of movement/(re)injury in pain disability. J Occup Rehabil 1995; 5: 235–252.
4. Crombez G, Eccleston C, Baeyens F, van HB, van den BA. Attention to chronic pain is dependent upon pain-related fear. J Psychosom Res 1999; 47: 403–410.
5. Roelofs J, Goubert L, Peters ML, Vlaeyen JW, Crombez G. The Tampa Scale for Kinesiophobia: further examination of psychometric properties in patients with chronic low back pain and fibromyalgia. Eur J Pain 2004; 8: 495–502.
6. Lethem J, Slade PD, Troup JD, Bentley G. Outline of a Fear-Avoidance Model of exaggerated pain perception-I. Behav Res Ther 1983; 21: 401–408.
7. Waddell G, Newton M, Henderson I, Somerville D, Main CJ. A Fear-Avoidance Beliefs Questionnaire (FABQ) and the role of fear-avoidance beliefs in chronic low back pain and disability. Pain 1993; 52: 157–168.
8. Swinkels-Meewisse EJ, Swinkels RA, Verbeek AL, Vlaeyen JW, Oostendorp RA. Psychometric properties of the Tampa Scale for Kinesiophobia and the fear-avoidance beliefs questionnaire in acute low back pain. Man Ther 2003; 8: 29–36.
9. Vlaeyen JW, Linton SJ. Fear-avoidance and its consequences in chronic musculoskeletal pain: a state of the art. Pain 2000; 85: 317–332.
10. Grotle M, Brox JI, Vollestad NK. Cross-cultural adaptation of the Norwegian versions of the Roland-Morris Disability Questionnaire and the Oswestry Disability Index. J Rehabil Med 2003; 35: 241–247.
11. Lundberg MKE, Styf J, Carlsson SG. A psychometric evaluation of the Tampa Scale for Kinesiophobia-from a physiotherapeutic perspective. Physiother Theory Pract 2004; 20: 121–133.
12. Goubert L, Crombez G, Van DS, Vlaeyen JW, Bijttebier P, Roelofs J. Confirmatory factor analysis of the Tampa Scale for Kinesiophobia: invariant two-factor model across low back pain patients and fibromyalgia patients. Clin J Pain 2004; 20: 103–110.
13. Nijs J, De MK, Duquet W. Kinesiophobia in chronic fatigue syndrome: assessment and associations with disability. Arch Phys Med Rehabil 2004; 85: 1586–1592.
14. Burwinkle T, Robinson JP, Turk DC. Fear of movement: factor structure of the Tampa scale of kinesiophobia in patients with fibromyalgia syndrome. J Pain 2005; 6: 384–391.
15. Rasch G, editor. Probabilistic models for some intelligence and attainment tests. Chicago: University of Chicago Press; 1960.
16. Andrich D. Relationship between the Thurstone and Rash approaches to item scaling. Appl Psychologic Meas 1978; 2: 449–460.
17. Wilson M, editor. Constructing measures: An item response modeling approach. 1st edn. London: Lawrence Erlbaum Associates; 2005.
18. Svensson E. Guidelines to statistical evaluation of data from rating scales and questionnaires. J Rehabil Med 2001; 33: 47–48.
19. Kopec JA, Sayre EC, Davis AM, Badley EM, Abrahamowicz M, Sherlock L, et al. Assessment of health-related quality of life in arthritis: conceptualization and development of five item banks using item response theory. Health Qual Life Outcomes 2006; 4: 33.
20. Riley JL III, Robinson ME, Wise EA, Price DD. A meta-analytic review of pain perception across the menstrual cycle. Pain 1999; 81: 225–235.
21. Strand LI, Wisnes AR. Development of Norwegian Questionnaire for pain. [Utvikling av norsk spørreskjema for smertemåling.] Tidsskr Nor Laegeforen 1990; 1: 45–49 (in Norwegian).
22. Beaton DE, Bombardier C, Guillemin F, Ferraz MB. Guidelines for the process of cross-cultural adaptation of self-report measures. Spine 2000; 25: 3186–3191.
23. Derogatis LR, Lipman RS, Rickels K, Uhlenhuth EH, Covi L. The Hopkins symptom Checklist a self-report symptom inventory. Behavioral Science 1974; 19: 1–15.
24. Sandanger I, Moum T, Ingebrigtsen G, Dalgard OS, Sorensen T, Bruusgaard D. Concordance between symptom screening and diagnostic procedure: the Hopkins Symptom Checklist-25 and the Composite International Diagnostic Interview I. Pain Forum 1998; 5: 51–66.
25. Masters G. A Rasch model for partial credit scoring. Psychometrika 1982; 47: 149–174.
26. Andrich D, editor. Rasch models for measurements. Quantitative Application in Social Sciences 68. London: Sage; 1988.
27. Angoff WH. Perspectives on differential item functioning methodology. In: Holland PW, Weiner H, editors. Differential item functioning. Hillsdale, New Jersey: Lawrence Erlbaum; 1993. p. 3–23.
28. Bland JM, Altman DG. Multiple significance tests: the Bonferroni method. BMJ 1995; 310: 170.
29. Polit DF, Hunger BP, editors. Assessing data quality. Nursing Research. Principles and Methods. Philadelphia: Lippincott; 1999, p. 407–436.
30. Burwinkle T, Robinson JP, Turk DC. Fear of movement: factor structure of the Tampa scale of kinesiophobia in patients with fibromyalgia syndrome. J Pain 2005; 6: 384–391.
31. Kleinbaum DG, Kupper LL, Muller KE, editors. Applied regression analysis and other multivariate methods. 2nd edn. Boston: PWS-Kent Publishing Co.; 1987.
32. Wright B.D. Model selection: rating scale or partial credit? Rasch Measurement Transactions 1999; 12: 641–642.
33. Tennant A. Measuring outcome. Br Med Bull 2000; 56: 287–295.
34. Houben RM, Leeuw M, Vlaeyen JW, Goubert L, Picavet HS. Fear of movement/injury in the general population: factor structure and psychometric properties of an adapted version of the Tampa Scale for Kinesiophobia. J Behav Med 2005; 28: 415–424.
35. Crombez G, Vlaeyen JWS, Heuts PHTG, Lysens R. Pain-related fear is more disabling than pain itself: evidence on the role of pain-related fear in chronic back pain disability. Pain 1999; 80: 329–339.
36. Elashoff JD, editor. NQuery Advisor, user’s guide. 4th edn. Boston: Statistical solutions 2000.
37. Swinkels-Meewisse IE, Roelofs J, Verbeek AL, Oostendorp RA, Vlaeyen JW. Fear of movement/(re)injury, disability and participation in acute low back pain. Pain 2003; 105: 371–379.
38. Clark ME, Cori SH, Brockel J. Kinesiophobia and chronic pain: Psychometric properties and factor analysis of the Tampa scale. Am Pain Soc Abstr 15, 77. 1996.
39. Forseth KO, Forre O, Gran JT. A 5.5 year prospective study of self-reported musculoskeletal pain and of fibromyalgia in a female population: significance and natural history. Clin Rheumatol 1999; 18: 114–121.