OBJECTIVE: To evaluate the measurement properties of the Upper Extremity Functional Status module of the Orthotics and Prosthetics User Survey (OPUS).
DESIGN: Methodological research on an outcome measure administered by clinical interview.
Patients: A convenience sample of 61 adults who had unilateral upper limb amputations and completed rehabilitation at the Institute for Rehabilitation in Ljubljana, Slovenia, at least one year prior to interview. Thirty-four patients had undergone amputation of the dominant hand. Four patients did not use a prosthesis.
METHODS: Rating scale analysis (Rasch model) was used to evaluate functioning of the rating scale categories, the validity of the measure by examining fit of items to the latent trait, and the hierarchy of item difficulties compared with expectations of the construct.
RESULTS: Rasch analysis allowed us to improve the Upper Extremity Functional Status by rescoring to reduce the response categories from 5 to 4, and identifying 19 of 23 items that are useful to measure upper extremity function. The results allow us to have high confidence in the consistency of both person-ability and item-difficulty estimates.
CONCLUSION: This revised Upper Extremity Functional Status is a promising instrument to measure the degree of manual functioning after a unilateral upper limb amputation.
Key words: amputation, artificial limbs, outcome assessment, psychometrics.
J Rehabil Med 2008; 40: 393–399
Correspondence address: Helena Burger, Institute for Rehabilitation, Linhartova 51, SI-1000 Ljubljana, Slovenia. E-mail: helena.burger@ir-rs.si
Submitted September 23, 2007; accepted January 9, 2008
Introduction
Outcome measurement is a topic of growing concern for clinicians providing care to patients using upper limb prostheses, just as it has been in other arenas of healthcare (1–3). Patients and clinicians would benefit from a standardized method to measure important and relevant outcomes accurately and efficiently. Such an instrument could provide several benefits, including promotion of evidence-based practice, clinical pathways, enhancing programme outcomes, and serve as the basis for research-based, quality improvement initiatives.
Heinemann et al. (4) completed a comprehensive literature search to identify generic and orthotic- and prosthetic-specific outcome instruments. This search yielded several dozen instruments, but an informal survey revealed little use of any outcome measure by clinicians. In most studies, authors use patient acceptance and wearing time as the main rehabilitation outcome (2–3, 5–13). Other approaches are to use clinical evaluations or self-report questionnaires. The disadvantages of clinical evaluations are the amount of time required and the often weak relationship between a patient’s task performance in the clinic and actual use of the prosthesis in real-world situations (14). Questionnaires evaluate a greater number and diversity of tasks than is normally possible in an observational functional assessment (14). Unfortunately, there is a dearth of valid, reliable, sensitive and reasonably short measures for assessing rehabilitation outcome after upper limb amputation, assessing functional status from the patient’s perspective, and evaluating the benefits of various prosthetic components (15–16).
One attempt to remedy this shortcoming was the work of Heinemann et al. (4). They developed the Orthotics and Prosthetics User Survey (OPUS) with input from an advisory committee that included clients, orthotists, prosthetists, physical therapists, occupational therapists and physiatrists. They focused OPUS on upper extremity and lower extremity functional status, health-related quality of life and client satisfaction. While they developed a promising item-set, their sample of patients with upper extremity limb loss was small, thus limiting evaluation of the psychometric properties of the upper extremity functional status (UEFS) module.
The purpose of this study was to evaluate the measurement properties of the UEFS module of OPUS using Rasch analysis. Such an analysis could serve to evaluate a promising item-set for clinical application.
Material and methods
Participants
Participants were a convenience sample of 61 adults (45 men, 73.8%), who had unilateral upper limb amputations and who had completed rehabilitation at the Institute for Rehabilitation in Ljubljana, Slovenia, at least one year prior to the study. The demographic and clinical characteristics of the study population are reported in Table I. Thirty-four of the 61 patients (55.7%) had undergone amputation of the dominant hand. Two patients (3.3%) had never received a prosthesis, 32 (52.5%) had tried only one type of prosthesis, 21 (34.4%) had tried 2 types and 6 (9.8%) had tried 3 types of prosthesis.
Local ethics committee approval of the study was obtained. The participants were informed of the experimental protocol, and provided their written consent prior to participation.
Assessment
The UEFS asks patients to evaluate the ease of performing 23 self-care and instrumental activity of daily living items. The framing question was “Please indicate how easily you perform the following activities.” Subjects responded on a 5-point rating scale: 0 = cannot perform activity; 1 = very difficult; 2 = slightly difficult; 3 = easy; 4 = very easy. An additional question asked if each activity is performed using or not using the prosthesis. Unlike other functional status instruments, assistance from another person was not assessed. UEFS was developed by reviewing item content from a variety of published instruments, developing, revising and field-testing items pertaining to functional status. Field testing consisted of telephone interviews with a sample of past recipients of orthotic and prosthetic services at the Rehabilitation Institute of Chicago. The sample of 37 included primarily adult and child orthotics and prosthetics users with upper limb loss and dysfunction. Unpublished results of the upper extremity functional item-set were promising, with excellent reliability (person and item separation reliability = 0.91). Only one item (don and doff a shirt) misfitted the Rasch model.
In the current study, all patients were assessed by the same occupational therapist who read the questions and scored the responses.
Statistical analysis
In recent years, there has been a growing trend to use the Rasch model to facilitate the development and validation of outcome instruments (16). Rasch analysis provides psychometric information that is not obtainable through classical test theory (17–18), including: (i) the functioning of rating scale categories; (ii) the validity of a measure by evaluating the fit of items to the latent trait; and (iii) the consistency of item difficulties with the expectations of the construct (and hence a description of the range and hierarchical relationship of the variable). Indeed, Rasch analysis has been recommended as a method for assessing scale properties in addition to classical psychometric criteria for reviewing and assessing surveys and questionnaires for disability outcomes research (19). WINSTEPS software (20) implements the Rasch model. The matrix of single raw scores for each subject underwent a Rasch analysis (rating scale model).
We began by investigating the rating scale properties of OPUS UEFS. We evaluated the response categories using criteria suggested by Linacre (21): (i) at least 10 cases per category; (ii) even distribution of category use; and (iii) monotonic increase in both average measures of persons with a given score/category, and thresholds. Thresholds (or step calibrations) are the ability levels at which the response to either of 2 adjacent categories is equally likely. Additional criteria are: (iv) category outfit mean square values less than 2 (see below); and, (v) threshold differences larger than 1.4 log-odd units and lower than 5. We collapsed categories following these guidelines, and compared different solutions, examining not only the category diagnostics listed above, but also reliability indices. We were guided by a desire to select a solution that maximized statistical performances and clinical meaningfulness.
Next, we evaluated internal consistency by evaluating the fit of individual items to the latent trait (unidimensionality) and validity by comparing the item difficulties with the model expectation. Information-weighted (infit) and outlier-sensitive (outfit) mean-square statistics (MnSq) for each item were calculated (similar to a χ2 analysis) to test if items fit the model expectations. In accordance with the literature (16, 18), we defined acceptable fit as mean-square values in the range of 0.6 to 1.4. Items with larger values were considered misfitting, while items with smaller values were considered over fitting.
Reliability was evaluated in terms of “separation” (G), defined as the ratio of the true spread of the measures with their measurement error (17–18). The item separation index gives an estimate (in standard error units) of the spread or “separation” of items along the measurement construct; the person separation index gives an estimate of the spread or separation of persons along the measurement construct. This index reflects the number of “strata” of measures that are statistically discernible. A separation of 2.0 is considered good and enables the distinction of 3 strata, defined as segments whose centres are separated by distances greater than can be accounted for by measurement error alone (17). A related index is the reliability of these separation indices, providing the degree of confidence that can be placed in the consistency of the estimates (range 0–1; coefficients > 0.80 are considered as good, and > 0.90 excellent) (18).
Finally, principal component analysis of the standardized residuals was performed as a further confirmation of the unidimensionality of each scale (proportion of variance attributable to the first residual factor compared with that attributable to Rasch measures) and of the local independence of each item (i.e. the independence of item measures from extraneous variables, once their belonging to the shared construct has been ascertained) (20, 22).
We evaluated the construct validity of the UEFS by comparing the Rasch-derived measure of patients with different levels of amputation (using Kruskal-Wallis one-way analysis of variance), and for patients with trans-radial amputations also dominant (n = 21) vs non-dominant side (n = 19; using the Mann-Whitney U test).
Descriptive statistics (frequency distribution, mean values, percentage of patients performing each activity with prosthesis) are calculated for each of the 23 UEFS items.
Results
Table I shows the demographic, clinical and functional characteristics of the sample. The UEFS median raw score (25th–75th percentile) was 53 (46–59); only 1 patient obtained a maximum score.
| Table I. Demographic and clinical characteristics (n = 61) |
| Characteristics | |
| Age, years, mean (SD) Range | 56 (17.1) 19–85 |
| Time since amputation, years, mean (SD) Range | 32 (17.7) 1–62 |
| Lag between amputation and first prosthesis, years, mean (SD) Range | 2.2 (2.8) 0.1–14 |
| Cause of amputation, n (%) |
| Congenital | 9 (14.8) |
| Injury | 51 (83.6) |
| Embolic | 1 (1.6) |
| Level of amputation, n (%) |
| Partial hand | 3 (4.9) |
| Wrist disarticulation | 4 (6.6) |
| Trans-radial | 40 (65.6) |
| Trans-humeral | 11 (18.0) |
| Shoulder disarticulation | 3 (4.9) |
| Type of prosthesis used (at the time of testing), n (%) |
| None | 4 (6.6) |
| Aesthetic | 44 (72.1) |
| Passive with terminal device for work | 4 (6.6) |
| Body-powered | 7 (11.4) |
| Electric | 2 (3.3) |
| SD: standard deviation. | |
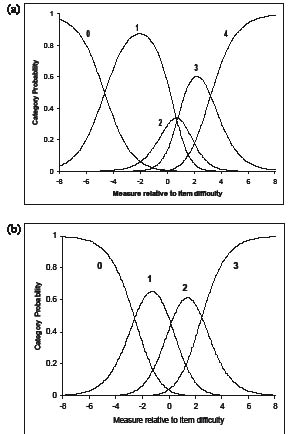
The rating scale diagnostics showed that level one of the 5 rating categories did not comply with the criteria for category functioning (Fig. 1a). The criteria were met by combining levels 1 (“very difficult”) and 2 (“slightly difficult”) of UEFS into a single category, obtaining a new 4-level rating scale (0–3 points) (Fig. 1b). After combining these rating scale categories, 21 of the 23 UEFS items fit the underlying construct (MnSq between 0.6 and 1.4) (Table II). Item 11 “Cut meat with knife and fork” and 19 “Use a hammer and nail” misfit the model (Infit MnSq > 1.4), while no item over fit.
Fig. 1. Category probability curves for: (a) the original scale with 5 categories (0–4); and (b) the revised scale after collapsing categories 3 and 4 (0–3). The y-axis represents the probability of responding to 1 of the rating categories and the x-axis represents the different performance values [subject ability minus the item-difficulty] in logits. The “0” curve declines as the subject’s ability increases; the crossing point (where 0 and 1 are equally probable) is the first “threshold”. The same applies for the other curves. (a) This graph shows that the probability of using category 2 is never higher than that of adjacent ratings. (b) This graph shows that the probability of selecting each of the 4 revised rating categories (0–3) is a clear function of the level of ability shown by the subject in the x-axis. Correspondingly, the “thresholds” are ordered (e.g. a greater ability is required when the most likely response is 1 rather than 0, 2 rather than 1, etc.).
| Table II. Upper extremity functional status item calibration information |
| Item | Measure | SE | Infit MnSq | Outfit MnSq |
| 11. Cut meat with knife and fork | 4.18 | 0.27 | 2.16 | 2.11 |
| 8. Tie shoe laces | 2.90 | 0.24 | 1.18 | 1.14 |
| 19. Use a hammer and nail | 2.86 | 0.24 | 1.85 | 1.86 |
| 6. Attach end of zipper and zip jacket | 2.30 | 0.22 | 1.21 | 1.21 |
| 17. Carry laundry basket | 0.95 | 0.22 | 0.99 | 0.95 |
| 21. Open an envelope | 0.90 | 0.22 | 1.17 | 1.12 |
| 22. Stir a bowl | 0.86 | 0.23 | 1.08 | 1.05 |
| 14. Use scissors | 0.66 | 0.23 | 0.99 | 0.93 |
| 20. Fold a bath towel | 0.36 | 0.23 | 0.85 | 0.83 |
| 5. Button shirt with front buttons | 0.12 | 0.23 | 0.79 | 0.78 |
| 7. Put on socks | –0.25 | 0.25 | 1.13 | 1.13 |
| 4. Put on and remove T-shirt | –0.37 | 0.24 | 0.69 | 0.64 |
| 2. Put toothpaste on brush and brush teeth | –0.55 | 0.26 | 0.85 | 0.86 |
| 23. Put on and take off prosthesis | –0.83 | 0.27 | 0.90 | 1.03 |
| 12. Pour from a 12 oz can (340 ml) | –0.89 | 0.27 | 0.74 | 0.74 |
| 13. Write name legibly | –1.14 | 0.27 | 1.03 | 0.79 |
| 16. Use a key in a lock | –1.53 | 0.29 | 0.70 | 0.70 |
| 1. Wash face | –1.53 | 0.29 | 0.93 | 0.92 |
| 10. Use fork or spoon | –1.62 | 0.29 | 0.87 | 0.75 |
| 15. Open door with knob | –1.67 | 0.31 | 0.73 | 0.54 |
| 3. Brush/comb hair | –1.89 | 0.31 | 0.85 | 0.56 |
| 18. Dial a touch tone phone | –1.91 | 0.32 | 0.68 | 0.56 |
| 9. Drink from a paper cup | –1.91 | 0.32 | 0.74 | 0.57 |
| Item calibrations (measure, increasing bottom-up) with standard errors (SE), and infit and outfit mean-square statistics (MnSq) for the 23 items of UEFS. Misfitting values are in bold. The difficulty estimate for the item as a whole is the mean value of the difficulty measures of the thresholds along that item. The higher the item estimate, the less likely it is (for any subject) to gain a high score. |
Fig. 2 shows the map of patient ability and item-difficulty. Ability levels (non-extreme scores) spanned more than 6 logits (from –0.91 to 5.55) and the average measure was 2.09. The mean error estimate for the subject ability levels was 0.42; in the near-maximum scores the error was higher but acceptable (0.81). Item-difficulty estimates spanned a range from –1.91 to +4.18 logits (Table II and Fig. 2).
Principal component analysis of the standardized residuals revealed that only 3.1% of the unexplained variance was accounted for by the first factor, whereas the variance explained by the Rasch-derived measure was 80.1%. The correlation between the item residuals suggested acceptable (< 0.5) local independence across most items (i.e. the value of 1 item has no influence on the value of another, once the underlying variable has been accounted for). The largest item residual correlations were between item 9 (drink from a cup paper) and item 15 (open door with knob, 0.62) and item 16 (use a key in a lock, 0.55), and between item 16 and item 12 (pour from a 12 oz can, 0.51).
After rescoring to a 0–3 rating scale, the item separation index of the 23-item UEFS was 6.04 and the corresponding item separation reliability was 0.97; person separation was 2.78 and the corresponding person separation reliability was 0.89.
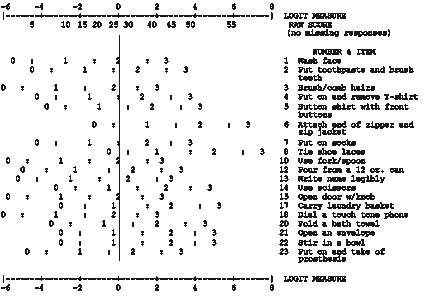
We re-calibrated the UEFS after deleting the 2 misfitting items (11, 19) and 2 items with high residual correlations (9 and 16). The 19-item UEFS had an item separation index of 5.20 with a corresponding item separation reliability of 0.96; person separation was 2.68 and the corresponding person separation reliability was 0.88. The people distinguish 7 strata of items, and the items were able to distinguish more than 3 levels of subject ability. Fig. 3 provides a key form for clinical use. Therapists can circle the responses to each item that is evaluated and estimate a measure by drawing a line that best fits the responses. For example, a patient obtaining a raw score of 25 from the 19 items retained in UEFS is illustrated by a vertical line in Fig. 3. A patient with a total score of 25 would be most likely to receive a score of 2 on washing face item (1), brushing hair (3), and using a fork and spoon (10), a score of 1 on putting on and removing a T-shirt (4), using scissors (14), and folding a bath towel (20), and a score of 0 on attaching end of zipper and zipping a jacket (6). Unexpected departures from this response pattern, such as a score of 3 on opening an envelope (item 21), will be evident by visual inspection.
Fig. 3. Self-Scoring Key for the 19-Item upper extremity functional status (UEFS). Distance between points is equal-interval. Logit measure at top and bottom of key, centered at the mean item-difficulty. The rating scale is collapsed from 5 to 4 categories and renumbered 0 (cannot perform), 1 (difficult), 2 (easy), and 3 (very easy). The threshold between adjacent categories is marked by “:”. For a given patient, clinicians can circle responses to the 19 items and then mark a vertical line that passes through the mid-point of the ratings; the point where this line intersects the horizontal axis is the estimated measure for that person. If this line intersects the horizontal line at zero, the patient has a moderate level of upper extremity function – these activities are not very difficult or very easy. Negative values reflect a lower level of functional ability, while positive values reflect a higher level of functional ability.
Approximately half of the subjects used their prosthesis for 7 of 22 activities, less than 5% used their prosthesis for 5 activities, and 5–10% used their prosthesis for 4 activities (Table III). The UEFS measure was not related to number of activities with which a prosthesis was used. Similarly, the UEFS measure did not distinguish persons not using a prosthesis for any activities from those who used a prosthesis for at least one activity.
| Table III. Frequency distribution and mean values for the score of the 23 upper extremity functional status items |
| Item | 0 | 1 | 2 | 3 | Missing | Raw score Mean (SD) | Using prosthesis (%) |
| 1. Wash face | 0 | 2 | 17 | 42 | 0 | 2.66 (0.54) | 1.6 |
| 2. Put toothpaste on brush and brush teeth | 0 | 5 | 22 | 31 | 3 | 2.45 (0.65) | 20.7 |
| 3. Brush/comb hair | 0 | 2 | 13 | 46 | 0 | 2.72 (0.52) | 1.6 |
| 4. Put on and remove T-shirt | 0 | 5 | 28 | 28 | 0 | 2.34 (0.64) | 11.5 |
| 5. Button shirt with front buttons | 0 | 8 | 30 | 22 | 1 | 2.23 (0.67) | 16.7 |
| 6. Attach end zipper and zip jacket | 5 | 28 | 19 | 8 | 1 | 1.50 (0.83) | 63.6 |
| 7. Put on socks | 0 | 9 | 19 | 30 | 3 | 2.36 (0.74) | 3.4 |
| 8. Tie shoe laces | 10 | 23 | 10 | 9 | 9 | 1.35 (0.99) | 50.0 |
| 9. Drink from a paper cup | 0 | 2 | 12 | 45 | 2 | 2.73 (0.52) | 5.1 |
| 10. Use fork or spoon | 0 | 4 | 12 | 45 | 0 | 2.67 (0.60) | 6.6 |
| 11. Cut meat with knife and fork | 21 | 12 | 8 | 4 | 16 | 0.89 (1.01) | 54.2 |
| 12. Pour from a 12 oz can | 0 | 4 | 19 | 36 | 2 | 2.54 (0.62) | 11.9 |
| 13. Write name legibly | 0 | 7 | 12 | 42 | 0 | 2.57 (0.69) | 6.6 |
| 14. Use scissors | 0 | 17 | 21 | 22 | 1 | 2.08 (0.81) | 35.0 |
| 15. Open door with knob | 0 | 1 | 15 | 42 | 3 | 2.71 (0.50) | 3.4 |
| 16. Use a key in a lock | 0 | 3 | 15 | 43 | 0 | 2.66 (0.57) | 4.9 |
| 17. Carry laundry basket | 2 | 18 | 19 | 20 | 2 | 1.97 (0.89) | 49.1 |
| 18. Dial a touch-tone phone | 0 | 0 | 16 | 43 | 2 | 2.73 (0.45) | 6.8 |
| 19. Use a hammer and nail | 5 | 28 | 11 | 6 | 11 | 1.36 (0.83) | 42.2 |
| 20. Fold a bath towel | 0 | 10 | 27 | 21 | 3 | 2.19 (0.71) | 43.1 |
| 21. Open an envelope | 0 | 18 | 25 | 18 | 0 | 2.00 (0.77) | 54.1 |
| 22. Stir a bowl | 2 | 12 | 29 | 15 | 3 | 1.98 (0.78) | 33.9 |
| 23. Put on and take off prosthesis | 0 | 4 | 21 | 30 | 6 | 2.47 (0.63) | – |
| 0 = not able, 1 = difficult, 2 = easy, 3 = very easy. Percentage performing activity with prosthesis is computed by excluding missing and ”not able” responses. SD: standard deviation. |
Patients with different levels of amputation did not differ significantly on the UEFS measure. Patients with trans-radial amputation who sustained amputations on their non-dominant side (n = 19) had significantly higher UEFS scores than those with amputations on the dominant side (n = 21, z = –2.11; p = 0.034).
Discussion
The purpose of this study was to evaluate the measurement properties of the UEFS in patients with unilateral upper limb amputation. Rating scale diagnostics provide evidence that respondents were not able to discern 2 of the original categories (1, “very difficult” and 2, “slightly difficult”). Combining the 2 categories improved the measure. Difficulties discerning the categories may reflect problems with expressing “slightly” in Slovene, a concept not used in this language. Most patients wanted to select “difficult,” which was not an option, so they selected instead “slightly” or “very difficult.” The 4 resulting categories represent the following levels: 0 = not able, 1 = difficult, 2 = easy and 3 = very easy. This modification eliminated redundancy of underutilized rating categories and ensured that each rating category is distinct from the others (18).
Collapsing 2 rating-scale categories enhanced fit of the items to the Rasch model. Twenty-one of the 23 UEFS items fit the underlying construct according to Rasch model requirements. Two items misfit the model and thus were deleted. “Cut meat with knife and fork” is a bimanual activity. It cannot be performed with one hand only, but can be performed in various ways. Persons with trans-radial or distal amputations can perform the task with a hand and a prosthesis, or instead of a prosthesis, they can use a fixed fork with the stump. Subjects with elbow disarticulation or more proximal amputation can perform this task only with a hand and a prosthesis. Difficulty also depends on the type of prosthesis and patients’ skill. “Use a hammer and nail” is also a bimanual activity, but some persons learn to do it with one hand if the wood is not too hard. It cannot be done with a prosthesis with a hand as a terminal device, because the hand conceals the nail. It can be done only if subjects use a hook as a terminal device. In addition, subjects with elbow disarticulation or more proximal amputation may have problems hammering a nail higher than shoulder level. Both tasks depend on personal and environmental factors that could result in some subjects responding idiosyncratically, and thus inducing the misfitting.
Four items showed high (> 0.50) residual correlations, “drink from a paper cup,” “open door with knob,” “use a key in a lock” and “pour from a 12 oz can.” They are candidates for deletion, because their lack of local independence degrades the measurement process and increases standard errors (22). Moreover, these items share the same span of (very low) difficulty as other items (Fig. 2), which indicates potential item redundancy (16, 18). All are monomanual activities rarely performed using a prosthesis (Table III). From our clinical experience, “drink from a paper cup” and “use key in a lock” provide little additional information; thus, we decided to delete them to form the 19-item UEFS version.
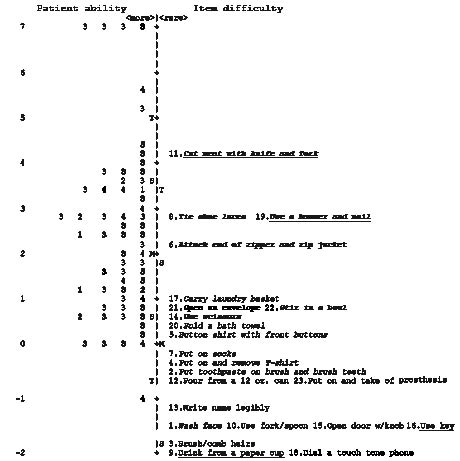
Fig. 2. Subject ability and item difficulty maps of the upper extremity functional status (UEFS). The vertical line represents the measure of the variable in log-odd units. The left-hand column locates the individual’s ability along the variable: each person is indicated by a number related to amputation level [1 = partial hand; 2 = wrist disarticulation; 3 = trans-radial; 4 = trans-humeral; 5 = shoulder disarticulation. In bold: amputation of dominant hand (n = 34)]. The right-hand column locates the 23-item difficulty measures along the variable (for each item, the difficulty estimate represents the mean calibration of the threshold parameters). Each item is also indicated by its number in the original questionnaire: italics + bold = bimanual activity (and very difficult to do with only one hand); italics = bimanual activity, but can be done with only one hand; normal = monomanual activity. Items misfitting or deleted in the 19-item version are underlined. From bottom to top, measures indicate greater ability (for patients) and greater difficulty (for items), respectively. By convention, the average difficulty of items in the test is set at 0 logits (and indicated with “M”). The higher the difference between the patient’s and the item’s measure, the higher the score expected.
The manual ability levels of this sample are not well targeted by the current version of UEFS, as shown in Fig. 2. Compared with the mean value of 0 logits routinely assigned for items, the average ability of this sample was considerably higher than the difficulty levels of these items. Moreover, the tail of the person distribution is considerably above the highest mean item calibration, and this item (#11) misfits. Consequently, persons at high function levels are estimated imprecisely with this questionnaire. This finding reflects the sampling strategy: all patients had sustained limb loss at least one year prior to study participation. Mistargeting of the items is less likely to be a problem in a sample of patients with more recent limb loss. Items that might target the item set on the sample’s ability level include “open a bag of chips” (from ABILHAND, UNB and PUFI) (23 – 25), “peel potatoes or fruits” (PUFI) (25), “peel onions” (ABILHAND) (23), “peel orange or banana,” “twist a lid off a small drink bottle” (PUFI) (25) or “sharpen a pencil” (UNB, PUFI) (24, 25). If subjects with high manual dexterity were the target group for this test, UEFS would need to have at least one new item representing a higher difficulty, to estimate more precisely the abilities of the most able subjects and raise the ceiling.
The item hierarchy supports the UEFS construct validity. UEFS contains 14 bimanual and 9 monomanual activities. Some of the bimanual activities can be performed with one hand (“wash face,” “put toothpaste on brush and brush teeth,” “put on and remove T-shirt,” “button shirt with front buttons,” “put on socks,” “carry laundry basket” and “fold a bath towel”). These tasks should be easier for subjects with amputations on their non-dominant side. The second set of items consists of activities that are more difficult or impossible to perform with one hand only (“attach end of zipper and zip jacket,” “tie shoe laces,” “cut meat with knife and fork,” “use scissors,” “use hammer and nail,” “open an envelope” and “stir in a bowl”). We expected these to be the most difficult items and that subjects would more frequently use their prosthesis to do them. Fig. 2 and Table III show that the results support our expectations about task difficulty. For both misfitting items (“cut meat with knife and fork,” “use a hammer and nail”) fewer subjects than expected used a prosthesis. These activities had the first and the second highest number of missing values, which includes subjects who do not perform the activity. These tasks can be performed in a variety of ways. Subjects used their prosthesis more than 30% of the time for all other items that we thought would be difficult to perform with one hand and for 2 tasks that can be easily performed with one hand (“carry laundry basket,” “fold a bath towel”). These findings are consistent with our clinical experience.
The high item separation reliability indicates that great confidence can be placed in the replicability of item placement in other samples. The targeting and spread of item-difficulty (see Fig. 2) and the quite high person separation reliability show that the scale is appropriate for measuring with satisfactory precision persons with a wide variety of functional ability. The precision of ability estimates for high-functioning subjects (greater than 6–7 logits) is lower but still acceptable: the error is about 15% of the corresponding measure. However, the item-difficulty span decreases when the misfitting item “cut meat with knife and fork” is removed.
We found that patients with trans-radial amputation who sustained amputations on their non-dominant side had significantly higher function than those with amputations on the dominant side. Opinions on the importance of manual dexterity and loss of the dominant hand differ considerably. Stürup et al. (6) reported that a prosthesis is more widely used by persons with amputation of the dominant hand; in contrast, Roeschlein & Domholdt (3) reported that the loss of the dominant hand had no influence upon the successful use of a body-powered prosthesis. Burger et al. (8) reported that all prostheses and particularly those with functional uses are worn mostly by subjects with non-dominant amputations.
Care should be taken in generalizing these results because the study sample represented a single facility with a high prevalence of traumatic trans-radial amputations. Subjects’ rating scale use may also reflect features of the Slovene language. Nevertheless, the results of this study provide a useful starting point for further refinements, including: (i) analysis of the revised, 4-category rating scale; (ii) a study of differential item functioning (i.e. the stability of item hierarchy across sub-samples defined according to relevant clinical criteria such as age, type of prosthesis, amputation level and side); and (iii) the testing of new items with greater difficulty (e.g. “open a bag of chips by hand,” “peel potatoes” (or fruits), “twist a lid off a small drink bottle,” or “sharpen a pencil”). We recommend evaluating the UEFS with different samples (e.g. subjects after bilateral amputation, using myoelectric prosthesis) and with subjects with varied amputations, including trans-radial amputation, shoulder disarticulation and partial hand amputation, and subjects with amputations due to tumour, and patients during rehabilitation and training of prosthetic use.
In conclusion, Rasch analysis allowed us to improve the measurement properties of UEFS by adopting a 4-category solution and identifying 19 items that are most useful to measure a construct that is unidimensional and demonstrates internal construct validity. The high reliability allows one to place great confidence in the consistency of both person-ability and item-difficulty estimates. This new instrument (UEFS 2.0) is a promising measure of manual functioning after unilateral upper limb amputation.
AcknowledgEments
Funding for development of OPUS was provided by the National Institute on Disability and Rehabilitation Research through a Rehabilitation Engineering Research Center on Prosthetics and Orthotics awarded to Northwestern University (H133E980023 and H133E030030), Feinberg School of Medicine. Dr Dudley Childress was the Principal Investigator of the earlier award and Dr Steven Gard is the Principal Investigator of the second award. Funding for data collection was provided by the Slovenian Research Agency for the project haptic interface as a tool for assessment of rehabilitation outcome; Dr Helena Burger was the Principal Investigator.
References
1. Light CM, Chappell PH, Kyberd PJ. Establishing a standardized clinical assessment tool of pathologic and prosthetic hand function: normative data, reliability, and validity. Arch Phys Med Rehabil 2002; 83: 776–782.
2. Millstein SG, Heger H, Hunter GA. Prosthetic use in adult upper limb amputees: a comparison of the body powered and electrically powered prostheses. Prosthet Orthot Int 1986; 10: 27–34.
3. Roeschlein RA, Domholdt E. Factors related to successful upper extremity prosthetic use. Prosthet Orthot Int 1989; 13: 14–18.
4. Heinemann AW, Bode R, O’Reilly C. Development and measurement properties of the orthotics and prosthetics users’ survey (OPUS): a comprehensive set of clinical outcome instruments. Prosthet Orthot Int 2003; 27: 191–206.
5. Stein RB, Walley M. Functional comparison of upper extremity amputees using myoelectric and conventional prostheses. Arch Phys Med Rehabil 1983; 64: 243–248.
6. Stürup J, Thyregod HC, Jensen JS, Retpen JB, Boberg G, Rasmussen E, Jensen S. Traumatic amputation of the upper limb: the use of body-powered prostheses and employment consequences. Prosthet Orthot Int 1988; 12: 50–52.
7. Silcox DH, Rooks MD, Vogel RR, Fleming LL. Myoelectric prostheses. A long-term follow-up and a study of the use of alternate prostheses. J Bone Joint Surg 1993; 75: 1781–1789.
8. Burger H, Marinček Č. Upper limb prosthetic use in Slovenia. Prosthet Orthot Int 1994; 18: 25–33.
9. Jones LE, Davidson JH. The long-term outcome of upper limb amputees treated at a rehabilitation centre in Sydney, Australia. Disabil Rehabil 1995; 17: 437–442.
10. Wright TW, Hagen AD, Wood MB. Prosthetic usage in major upper extremity amputations. J Hand Surg 1995; 20: 619–622.
11. Hacking HGA, van den Berg JP, Dahmen KT, Post MWM. Long-term outcome of upper limb prosthetic use in the Netherlands. Eur J Phys Med Rehabil 1997; 7: 179–181.
12. Kyberd PJ, Beard DJ, Morrison JD. The population of users of upper limb prostheses attending the Oxford Limb Fitting Service. Prosthet Orthot Int 1997; 21: 85–91.
13. Dudkiewicz I, Gabrielov R, Seiv-Ner I, Zelig G, Heim M. Evaluation of prosthetic usage in upper limb amputees. Disabil Rehabil 2004; 26: 60–63.
14. Wright FW, Hubbard S, Jutai J, Naumann S. The prosthetic upper extremity functional index: development and reliability testing of a new functional status questionnaire for children who use upper extremity prosthesis. J Hand Ther 2001; 14: 91–104.
15. Heinemann AW, Fisher W, Gershon R. Improving healthcare quality with outcomes management. J Prosthetics Orthotics 2006; 18: S46–S50.
16. Tesio L. Measuring behaviours and perceptions: Rasch analysis as a tool for rehabilitation. J Rehabil Med 2003; 35: 105–115.
17. Wright BD, Masters GN, editors. Rating scale analysis. Chicago: Mesa Press; 1982.
18. Bond TG, Fox CM, editors. Applying the Rasch model: fundamental measurement in the human sciences. Mahwah: Lawrence Erlbaum Associates; 2001.
19. Andresen EM. Criteria for assessing the tools of disability outcomes research. Arch Phys Med Rehabil 2000; 81: S15–S20.
20. Linacre JM. A user’s guide to Winsteps. Rasch-model computer programs. Chicago, IL: Winsteps.com; 2004. [Retrieved March 10, 2007]. Available from: http://www.winsteps.com/winsteps.htm
21. Linacre JM. Investigating rating scale category utility. J Outcome Meas 1999; 3: 103–122.
22. Wright BD. Local dependency, correlations and principal components. Rasch Measurement Transactions 1996; 10: 509–511.
23. Penta M, Thonnard JL, Tesio L. ABILHAND: a Rasch-built measure of manual ability. Arch Phys Med Rehabil 1998; 79: 1038–1042.
24. Sanderson ER, Scott RN, editors. UNB test of prosthetic function: a test for unilateral amputees [test manual]. Fredricton, New Brunswick, Canada: Bio-Engineering Institute; University New Brunswick; 1985.
25. Wright FV, Hubbard S, Naumann S, Jutai J. Evaluation of the validity of the prosthetic upper extremity functional index for children. Arch Phys Med Rehabil 2003; 83: 518–527.