OBJECTIVE: To assess the reliability of knee extensor and flexor muscle strength measurements in persons with late effects of polio.
DESIGN: A test-retest reliability study.
SUBJECTS: Thirty men and women (mean age 63 (standard deviation 6.4) years) with verified late effects of polio.
METHODS: Knee extensor and flexor muscle strength in both lower limbs were measured twice 7 days apart using a Biodex dynamometer (isokinetic concentric contractions at 60°/s and isometric contractions with knee flexion angle 90º) and a Leg Extension/Curl Rehab exercise machine with pneumatic resistance (HUR) (isotonic contractions). Reliability was assessed with the intraclass correlation coefficient (ICC1,1), the mean difference between the test sessions (đ) together with the 95% confidence intervals for đ, the standard error of measurement (SEM and SEM%), the smallest real difference (SRD and SRD%) and Bland-Altman graphs.
RESULTS: Test-retest agreements were high, (ICC1,1 0.93–0.99) and measurement errors generally small. The SEM% was 4–14% and the SRD% 11–39%, with the highest values for the isokinetic measurements.
CONCLUSION: Knee muscle strength can be measured reliably and can be used to detect real changes after an intervention for a group of persons with late effects of polio, whereas the values may be too high for single individuals or to detect smaller short-term changes over time for a group of individuals.
Key words: postpoliomyelitis syndrome; muscle, skeletal; outcome assessment; rehabilitation; reproducibility of results; research design.
J Rehabil Med 2010; 42: 588–592
Correspondence address: Ulla-Britt Flansbjer, Department of Rehabilitation Medicine, Skåne University Hospital, Orupssjukhuset, SE-221 85 Lund, Sweden. E-mail: ulla-britt.flansbjer@skane.se
Submitted November 11, 2009; accepted March 3, 2010
Introduction
After an acute paralytic poliomyelitis infection, many individuals recover fully or are left with mild residual symptoms (1). After a stable period of at least 15–20 years, new symptoms, usually muscle weakness, joint and muscle pain, and atrophy, are experienced (2–5). These symptoms are referred to as “late effects of polio” or “post-polio syndrome” (PPS). As the muscle weakness often affects the lower limbs, ambulation difficulties are common and this can impact on the performance of everyday activities and restrict participation (6–11). Measurements of lower limb muscle strength and interventions aiming at improving strength are therefore 2 common components in the management of individuals with late effects of polio (12).
To evaluate muscle strength we need reliable measurement tools (13) and to fully assess the reliability of these measurements, several statistical methods and indices are required. These should cover agreements between measurements, systematic changes in the mean and measurement errors (14). Such a comprehensive reliability analysis can also be used to define limits for the smallest change that indicates improvements following an intervention or a decline over time, both for a group of individuals or a single individual.
Muscle strength in both health and disease can be assessed isokinetically, isometrically and isotonically, using different dynamometers (15, 16). Despite its importance for the evaluation of interventions and longitudinal studies, very few studies have evaluated the reliability of lower limb muscle strength measurements in persons with late effects of polio. One study evaluated the reliability of isokinetic knee muscle strength measurements in 8 individuals (17), whereas another study with 65 individuals evaluated the reliability of isometric knee extensor strength measurements (18). Even though both studies showed that the test-retest reliability was high, only the study assessing reliability of isometric knee extensor strength measurements covered all aspects of reliability (18).
The aim of this study was therefore to assess the test-retest reliability of isokinetic, isometric and isotonic knee extensor and flexor muscle strength measurements in persons with late effects of polio, using several statistical methods and indices, and to define limits for the smallest change that indicates a real change in muscle strength, both for a group of individuals and a single individual.
Material and Methods
Individuals
Thirty community-dwelling individuals (19 men and 11 women; mean age 63 years (standard deviation (SD) 6.4), 51–77 years; mean time since onset of new physical symptoms 14 years SD 5.5, 3–25 years; able to walk at least 300 m with or without an assistive and/or orthotic device) were recruited from a post-polio rehabilitation clinic in a university hospital in the south of Sweden. All individuals met the criteria of late effects of polio, as defined by Halstead & Rossi (19). They all had a confirmed history of acute poliomyelitis affecting the lower limbs, new symptoms after a period of functional stability, and no other diseases that could explain their reduced muscle strength. An electromyogram had been recorded in the lower limbs (vastus lateralis and tibialis anterior muscles) as part of the initial routine clinical examination and verification of prior polio. Following the National Rehabilitation Hospital (NRH) Post-Polio Limb Classification (2) and the individuals’ own perception of their post-polio, one lower limb was defined as the “less affected” limb and the other as the “more affected”. All individuals had post-polio NRH class II–IV (indicating sub-clinical, clinically stable or clinically unstable polio) in their knee extensor and flexor muscles. No individual had post-polio class V (indicating severely atrophic polio) in their knee extensor and flexor muscles. Prior to inclusion, information about the purpose of the study was provided and each individual gave their written informed consent to participate. All individuals also participated in a study addressing reliability of gait performance tests (20).
Procedure
Each individual was tested on 2 occasions at the same time of the day, 7 days apart. All individuals were provided transport free of charge to and from the test site. The same person (UBF) performed all measurements. All measurements started with the less affected lower limb followed by the more affected lower limb. First, the isokinetic and isometric strength measurements were performed. After a 15 min rest, the isotonic strength was measured. The total time for a test session was approximately 1 h.
Isokinetic concentric and isometric muscle strength measurements
Isokinetic concentric knee extension and knee flexion muscle strength and isometric knee extension strength was measured with a Biodex® Multi-Joint System 3 PRO dynamometer using a standard protocol, applied previously in our research group (16). The individuals were seated in the adjustable chair of the dynamometer, without shoes or orthotic device, and were stabilized with straps across the shoulders, waist and thighs throughout the test. Before each measurement the full range of motion (ROM) was set and the Biodex software applied the gravity correction. The details of the position were recorded and used in the second test session. Consistent verbal encouragement was given throughout. After a structured warm-up the individuals performed 3 maximal isokinetic extensor and flexor contractions at 60°/s and the highest peak torques were recorded (Nm). Following a 2-min rest, they performed 2 maximal isometric knee extensor muscle contractions with a knee flexion angle at 90º, and the highest maximal voluntary contraction (MVC) was recorded (Nm).
Isotonic muscle strength measurements
Isotonic knee extension and knee flexion muscle strength was measured in a Leg Extension/Curl Rehab exercise machine with pneumatic resistance (pressure resistance 10 bar) (HUR Ltd, Kokkola, Finland), using a standard protocol also applied previously in our research group (21). For each individual a comfortable ROM was tested. Measurements of the isometric strength of the knee extensors and flexors were obtained and used to set a load (Nm) that the individual could lift 6 times (6 repetition maximum; 6RM). This procedure was repeated in the second test session, and the load from each test session was recorded and used in the statistical analyses.
Data and statistical analysis
All 30 individuals completed the measurements, giving a total of 10 strength measurements from the 2 test sessions. Descriptive statistics (means and SD) were calculated for the characteristics of the 30 individuals. The relationships between the strength measurements were analysed using Pearson’s correlation coefficient. The difference between men and women for each variable was assessed with the 2-sided t-test; as there were no discernible systematic differences between the sexes, data for men and women were combined throughout.
To determine the test-retest reliability several statistical methods were applied; a detailed account of the analyses, a rationale for their use, and all equations have been presented previously (14). Agreement between measurements was evaluated by the intra-class correlation coefficient (ICC1,1) and the mean difference between the test sessions (đ) together with the 95% confidence intervals for đ (95% CI). Measurement errors were assessed by the standard error of measurement (SEM) and the SEM%. The SEM gives the measurement errors in absolute values and represents the limit for the smallest change that indicates a real change for a group of individuals. The SEM% is independent of the units of measurement and therefore more easily interpreted. The smallest real difference (SRD), representing the limits for the smallest change that indicates a real change for a single individual, was calculated together with an “error band” around the mean difference of the 2 measurements (đ). From the SRD, the SRD% was calculated, representing the change in relative terms. The Bland-Altman graphs were formed to give a visual interpretation of the data as well as to determine reproducibility bias. A significance level smaller than 0.05 represented statistical significance. All calculations were performed using SPSS 16.0 Software for Windows (SPSS Inc., Chicago, IL, USA).
RESULTS
Data for the isokinetic concentric, isometric and isotonic knee muscle strength measurements for the “less affected lower limb” and the “more affected lower limb” are presented in Table I.
| Table I. Isokinetic, isometric and isotonic knee muscle strength for the 30 individuals with late effects of polio |
| | Less affected lower limb Mean (SD) | More affected lower limb Mean (SD) |
| Isokinetic knee extension (PT; Nm) | | |
| Test session 1 | 115.9 (43.7) | 79.0 (45.8) |
| Test session 2 | 118.7 (44.0) | 80.8 (44.5) |
| Isokinetic knee flexion (PT; Nm) | | |
| Test session 1 | 63.7 (24.7) | 42.6 (23.9) |
| Test session 2 | 66.8 (25.6) | 44.1 (22.5) |
| Isometric knee extension (MVC; Nm) | | |
| Test session 1 | 138.1 (59.7) | 81.2 (49.7) |
| Test session 2 | 137.3 (58.5) | 82.8 (52.5) |
| Isotonic knee extension (6RM; Nm) | | |
| Test session 1 | 59.2 (24.2) | 39.4 (23.3) |
| Test session 2 | 61.2 (25.0) | 40.8 (24.2) |
| Isotonic knee flexion (6RM; Nm) | | |
| Test session 1 | 89.0 (28.3) | 67.8 (27.9) |
| Test session 2 | 91.3 (29.5) | 68.6 (28.7) |
| PT: peak torque; MVC: maximal voluntary contraction; 6RM: 6 repetition maximum; SD: standard deviation. There are corrections for gravidity in the Biodex dynamometer but not in the HUR Rehab model. |
The reliability of knee muscle strength measurements are presented in Table II. For all measurements, the ICC1,1 values were high and ranged from 0.93 to 0.99, and the 95% confidence intervals for ICC1,1 were narrow. All đ values were low and the widths of the 95% CI for đ were also narrow. The positive values for đ for 9 of the 10 measurements indicated that the performance in the second test session was generally better than in the first. For all isokinetic and isometric measurements, the 95% CI of đ included zero, indicating that the better performance at the second test session was not significant; for 3 of the 4 isotonic measurements, the 95% CI of đ did not include zero, indicating a significant learning effect (p < 0.05).
| Table II. Reliability of isokinetic concentric, isometric and isotonic knee strength measurements for the 30 individuals with late effects of polio |
| | ICC1.1 | 95% CI for ICC | đ | 95% CI for đ | SEM | SEM% | 95% SRD | SRD% |
| Isokinetic extension (60º/s) |
| Less affected limb | 0.94 | 0.87–0.97 | 2.81 | –3.04–8.66 | 11.1 | 13.9 | –27.97–33.59 | 38.5 |
| More affected limb | 0.98 | 0.96–0.99 | 1.74 | –1.78–5.26 | 6.7 | 10.2 | –16.77–20.25 | 28.4 |
| Isokinetic flexion (60º/s) |
| Less affected limb | 0.93 | 0.88–0.97 | 3.06 | –0.37–6.49 | 6.8 | 10.4 | –15.68–21.80 | 28.7 |
| More affected limb | 0.95 | 0.90–0.98 | 1.57 | –1.12–4.26 | 5.1 | 11.8 | –12.67–15.81 | 32.8 |
| Isometric extension (MVC) |
| Less affected limb | 0.98 | 0.95–0.99 | –0.79 | –5.51–3.93 | 8.8 | 6.4 | –25.28–23.70 | 17.8 |
| More affected limb | 0.98 | 0.96–0.99 | 1.59 | –2.31–5.49 | 7.4 | 9.0 | –18.81–21.99 | 24.9 |
| Isotonic extension (6RM) |
| Less affected limb | 0.99 | 0.97–0.99 | 2.00 | 0.70–3.30 | 2.8 | 4.7 | –5.80–9.80 | 13.0 |
| More affected limb | 0.99 | 0.98–1.00 | 1.44 | 0.37–2.51 | 2.2 | 5.6 | –4.76–7.64 | 15.5 |
| Isotonic flexion (6RM) |
| Less affected limb | 0.98 | 0.97–0.99 | 2.33 | 0.60–4.06 | 3.6 | 4.0 | –7.71–12.37 | 11.1 |
| More affected limb | 0.99 | 0.98–1.00 | 0.84 | –1.61–2.29 | 2.8 | 4.1 | –6.85–8.53 | 11.3 |
| ICC1.1: intra–class correlation coefficient; CI: confidence interval; SEM: standard error of measurement; SRD: smallest real difference; MVC: maximal voluntary contraction; 6RM: 6 repetition maximum. |
The SEM gives the measurement errors in absolute values and represents the limit for the smallest change that indicates a real change for a group of individuals. The relative values of SEM (SEM%) ranged from 4.0% to 13.9%. The 95% SRD represents the limits for the smallest change that indicates a real change for a single individual. The SRD%, ranged from 11.1% to 38.5%. Both the SEM% and SRD% were generally smaller for the isotonic and isometric measurements compared with the isokinetic measurements.
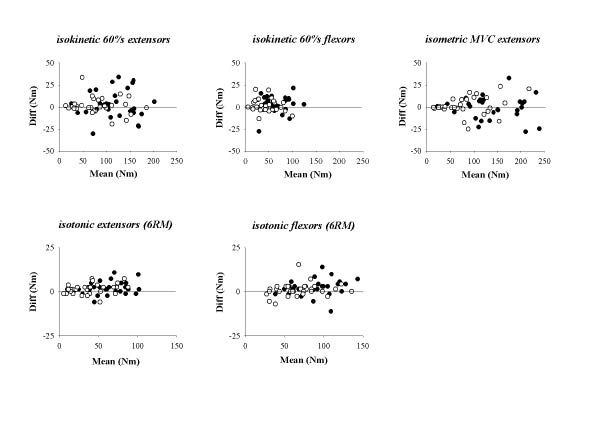
From the Bland-Altman graphs (Fig. 1), there were generally more values above the zero line than below (in line with the 9 out of 10 positive values of đ), illustrating the better performance at the second test session.
Fig. 1. The Bland-Altman graphs with the differences between test sessions 2 and 1 (test 2 minus test 1) plotted against the means of the 2 test sessions for the knee extensor and flexor muscle measurements in the less affected limbs (filled circles) and more affected limbs (open circles).
In both test sessions there was a strong correlation between the isokinetic, isometric and isotonic knee extensor strength measurements (r = 0.81–0.98; p < 0.01). There was also a strong correlation between the isokinetic and isotonic knee flexor strength measurements (r = 0.82–0.95; p < 0.01) in both test sessions.
Discussion
As muscle weakness is a prominent symptom in persons with late effects of polio (19, 22), reliable measurement tools are needed to allow the assessment of strength, the progression over time and changes following an intervention. In this study, we have assessed the test-retest reliability of isokinetic concentric, isometric and isotonic knee extensor and flexor muscle strength measurements in a group of persons with a confirmed history of acute poliomyelitis and new symptoms indicating late effects of polio. The main findings were that test-retest agreements were high, and both the measurement errors and the limits for the smallest change that indicates a real change was generally small, and comparable with reliability analysis of other groups of neurological conditions and healthy individuals.
Over the past decade, the assessment of reliability has developed from using only correlation coefficients to more comprehensive sets of statistical methods. It is now generally agreed that several statistical methods and indices are required to fully evaluate reliability (14). Moreover, the concept of reliability has been expanded and the data from the analyses can be used to define limits for the smallest change that indicates a real improvement, both for a group of individuals and for a single individual (14, 23). Thus, by applying a comprehensive set of statistical methods the reliability of measurement tools can be evaluated fully.
Several factors can influence reliability, and in the present study, 2 factors were identified: the sample size and the test protocol. The sample size should be sufficiently large and therefore 30 persons were tested (24, 25). As the test protocol is known to affect reliability, great care was taken to standardize the tests and to carefully to follow the protocol. Thus, the same number of days between test sessions and the same commands were used. With all conditions as stable as possible, any variability between the 2 test sessions represents the variability in the measurement parameters within and between the individuals. This is an inherent and normal expression of human motor behaviour, and a normal phenomenon characterizing any measurement process (15).
The ICC is the most common method to evaluate reliability. For all measurements, the ICC values in the present study were high and comparable to values after stroke and in healthy individuals (16, 26). In 2 previous studies, the test-retest reliability of isokinetic and isometric knee muscle strength measurements in individuals with late effects of polio were evaluated and similar ICC values (0.80–0.96) were reported (17, 18). However, using only the ICC can give a false impression about the reliability of a measurement (14). ICC assesses the agreement between repeated measurements and thereby only the variance between individuals. By using additional analyses, such as the Bland-Altman analyses and the Bland-Altman graphs, we can detect a variance also within individuals. For example, a better performance during the second test session was found, which suggests a learning effect that was significant for 3 of 4 isotonic measurements. Similar learning effects have also been seen after stroke (16). Even though this learning effect was small – the mean differences between the 2 sessions (đ) was close to zero and the confidence intervals were narrow (cf. Table II) – it may still have to be taken into account in future studies.
A high ICC value does not directly imply that a method is suitable for clinical use. Measurement errors should also be small and the method sufficiently sensitive to detect real changes both for groups of individuals and single individuals. Several indices have been suggested for the evaluation of measurement errors. In this study, we used the SEM and the SEM%, which give the measurement errors in absolute and relative values, the latter being more easily interpreted. The SEM% values in the present study were low, between 2% and 14%. From a clinical standpoint, these values seem reasonable, are in agreement with those from other patients, e.g. stroke (15), and indicate that measurements of both knee extension and flexion can be made reliably for a group of individuals with late effects of polio. However, these values should also be compared with longitudinal changes in muscles strength and changes following interventions. A review of studies of the course of functional status and muscle strength over time showed that the decline in strength is slow, approximately 1–2% per year (27). A SEM% value (which represents the limit for the smallest change that indicates a real change for a group of individuals) of 4–14% implies that it would normally take several years to detect a real change for a group with late effects of polio. On the other hand, studies assessing the effects of strength training (28–30) have shown improvements of 15–61%. Compared with the SEM% values, this would in most cases indicate a real change. Consequently, intervention studies with improvements less than approximately 10% does, in most cases, not indicate a real change.
To detect a real change for a single individual, we calculated the smallest real difference (SRD) (23). The SRD% is independent of the unit of measurement and, like the SEM%, is more easily interpreted (14). For the measurements in the present study, the size of the relative change (SRD%) for the more affected lower limb should exceed 11% (isotonic flexion) up to 33% (isokinetic flexion), to indicate a real change for a single individual. In our opinion, the SRD% values are not suitable to detect changes over time (at least a reasonable length of time). The isotonic, and to some extent isometric, measurements could, on the other hand, be used to detect real changes for a single individual following an intervention for which the intended outcome is at least 15–20%.
Dynamometers are frequently used to assess isokinetic and isometric muscle strength (15). There are suggestions that isotonic strength measurements could be equally appropriate to measure strength, as the load is constant throughout the range of motion and the velocity of the contraction is variable (31). Isotonic strength is often tested by using the 1RM. In individuals with reduced motor function and muscle weakness, due to ageing or a neuromuscular disease, 3RM to 6RM may be more useful (21). With regard to the reliability, a learning effect in 3 of the 4 isotonic measurements was noted, but this effect was small. In addition, the SEM% was lower than for the isokinetic and isometric measurements, indicating that the isotonic measurements may more easily detect a real change than an isometric or isokinetic measurement. As all 3 measurements were strongly correlated, this also indicates that isotonic as well as isokinetic and isometric measurements can be used to assess muscle strength in persons with late effects of polio. There are advantages and disadvantages with all 3 methods, so the choice of method and/or dynamometer depends on more than just their reliability. Further studies are needed to explore differences between the modes of measurements and their suitability for assessing muscle strength in persons with late effects of polio.
A limitation is that the individuals tested were moderately affected, with an ability to walk at least 300 metres and moderate muscle weakness. Even though the results may be generalized to individuals with late effects of polio with a different degree of disability in their lower limbs, further studies are needed to verify this.
In conclusion, knee muscle strength can be measured reliably and can be used to detect real changes after an intervention for a group of persons with late effects of polio, whereas the values may be too high for single individuals or to detect smaller short-term changes over time for a group of individuals. As all the measurements are highly related, the choice depends on what aspect of muscle strength is being evaluated and what equipment is available.
Acknowledgements
The study was completed within the context of the Centre for Ageing and Supportive Environments (CASE) at Lund University, funded by the Swedish Council for Working Life and Social Research. Financial support was also received from Stiftelsen för bistånd åt rörelsehindrade i Skåne, the Swedish Association of Survivors of Traffic Accidents and Polio (RTP), the Alfred Österlunds Stiftelse, and Skane county council’s research and development foundation.
REFERENCES