OBJECTIVE: To examine the psychometric qualities and develop the clinical utility of the Sydney Psychosocial Reintegration Scale (SPRS) as a measure of participation in people with traumatic brain injury.
DESIGN: Data generated from previous prospective studies.
SUBJECTS/PATIENTS: Convenience samples of healthy community-based volunteers (n = 105) and people with severe brain injury (n = 510).
METHODS: (i) The equivalence of a new 5-point version of the SPRS was determined vs the original 7-point version; (ii) construct validity was tested using Rasch analyses; (iii) normative and comparative data tables were produced, and data examined for floor/ceiling effects; (iv) a reliable change index score was generated.
RESULTS: Patterns of psychometric properties for the 5- and 7-point versions were almost identical (e.g. total scores rs = 0.98). Rasch analyses on Forms A and B found good fit to the model, for person (3.36 and 3.03, respectively) and item (7.78 and 7.25, respectively) separation; reliability coefficients were high (all ≥ 0.90). Mean infit statistics met standard criteria (between 0.7 and 1.3). No floor/ceiling effects were detected. The reliable change index value was calculated for the total score for Form A using logit scores, and a conversion table provided.
CONCLUSION: The 5-point version of the SPRS demonstrates strong psychometric qualities as a measure of participation after traumatic brain injury.
Key words: brain injuries; participation; community integration; assessment; psychometric properties.
J Rehabil Med 2011; 43: 609–618
Correspondence address: Robyn Tate, Rehabilitation Studies Unit, PO Box 6, RYDE NSW 1680, Australia. E-mail: rtate@med.usyd.edu.au
Submitted July 6, 2010; accepted April 18, 2011
Introduction
The growing importance of participation in rehabilitation practice is reflected in the move beyond treating impairment and function to “helping a person to reach their fullest physical, psychological, social, vocational, avocational and educational potential” (1, p. 3). Many elements of this expanded focus are captured within the construct of participation, as used in the International Classification of Functioning, Disability and Health (ICF) (2), and defined as “involvement in a life situation” (p. 10). Its importance can be seen in: (i) the high value that people with disability and their families place on participation outcomes; (ii) its usefulness (along with activities) in providing a benchmark for evaluating the efficacy of rehabilitation programmes; and (iii) the relevance of participation domains (e.g. return to work) for health planners and policymakers (3, 4).
Monitoring and measuring participation requires accurate and valid instruments. Generic scales that evaluate participation in all health conditions have been systematically reviewed (3, 5, 6). In their systematic review of participation instruments validated for traumatic brain injury (TBI), Reistetter & Abreu (7) identified 6 scales, including the Community Integration Questionnaire (CIQ; 8), the Craig Handicap Assessment and Reporting Technique (CHART; 9) and the Sydney Psychosocial Rehabilitation Scale (SPRS; 10). Although the content of many of these instruments cover similar areas, they differ with respect to conceptual perspectives, response format, comparison standard and scoring procedures.
The need for the continued refinement of scales measuring participation has been highlighted. Andresen (11) published a set of 11 clinical and psychometric criteria regarding important characteristics for rehabilitation outcome measures, along with 3 grades or levels of achievement (A to C). These criteria and their grades serve as a checklist against which the calibre of an instrument can be evaluated.
In the present report, we further examine the psychometric qualities and develop the clinical utility of the SPRS. Information on the conceptual underpinnings and process of development of the SPRS is described elsewhere (10, 12). In brief, the SPRS is a 12-item scale that measures psychosocial functioning in 3 domains of participation: occupational activity (i.e. work and leisure), interpersonal relationships, and independent living skills. There are 3 versions: Informant, Self and Clinician. In addition, for each version there are two forms: Form A (10) measures “change since the injury” and Form B (13) measures “current status”. Each of the versions and the forms has identical items, with variants in phrasing as appropriate. Behavioural descriptors, specific to each of the 12 items, are attached to the 4 lower response categories (corresponding to scores 0–3). The total score ranges from 0 to 48 (0–16 for the domains), with higher scores reflecting better functioning.
The original SPRS fulfilled a number of Andresen’s (11) criteria at the A grade. Psychometric studies, both by our group (10, 13) and independent researchers (14, 15), have demonstrated strong inter-rater reliability (intra-class correlation; ICC = 0.95; 10) and temporal stability (ICC = 0.90; 10, 13), concurrent, construct and divergent validity (10), as well as responsiveness with a large effect size (d = 0.93; 16). Results of multidimensional scaling suggested 2 dimensions: Productivity/Personal Life and Independent/Dependent (15). Although these 2 statistically-derived dimensions differ from the 3 clinical domains of the scale structure, clinicians and clients readily relate to the clinical domains and therefore they are retained for scale administration purposes.
To further strengthen the SPRS, the areas of administrative and respondent burden, scale structure and clinical utility were targeted. The original versions of Form A (change since injury) and Form B (current status) of the SPRS used a 7-point rating scale, but following user-feedback a 5-point scale was introduced to improve the ease of administration and completion. The revised scale is referred to as the SPRS-2 (see Appendix I for item description and re-coding rules). This change recognized the preference of the respondents while maintaining the number of rating categories within the recommended range for scales (namely, 5–7 categories) (17).
In terms of scale structure, Rasch analysis has been used increasingly to evaluate the measurement qualities of instruments employed in rehabilitation (18). An advantage of logit scores produced from a Rasch analysis is that they provide interval-level measurement, as opposed to a Likert rating scale used by the SPRS (and the majority of participation scales) which produces scores at the ordinal level. Yet, few scales measuring the construct of participation have been examined against the Rasch model; the CHART (9) and Mayo-Portland Adaptability Inventory (MPAI; 19) being notable exceptions. Finally, the clinical utility of the SPRS was improved. Normative and comparative data tables were devised to aid interpretation of the SPRS-2 scores, and reliable change index data were calculated to assist in determining whether differences in an individual patient’s scores represent significant change (improvement or deterioration).
The aims of this report were: (i) to examine the equivalence of the 7-point vs 5-point versions of the SPRS and compare their psychometric properties; (ii) to further investigate the construct validity of the SPRS by examining the fit of the SPRS-2 to a Rasch model; (iii) to present data pooled from previous research in order to provide tables of normative and TBI comparison data; and (iv) to derive reliable change index data for the SPRS-2 to assist in interpretation of score changes at the individual patient/client level.
MethodS
Participants
To examine the equivalence of the 7-point vs 5-point versions of the SPRS and compare their psychometric properties (aim (i)) participants were the two samples described in the initial psychometric report on the SPRS (10), which, in this paper, are referred to as Sample A and Sample B in order to distinguish them from the multiple samples used for aims (ii) to (iv) below. Sample A (n = 40) had been used to examine reliability and validity of the SPRS and Sample B (n = 20) to examine responsiveness. In brief, Sample A was a convenience sample of people with TBI who were living in the community. A subset of that sample (n = 34) was used to examine the 1-month temporal stability and validity of the SPRS. Sample B was a consecutive series of people with recent TBI who were admitted to an inpatient rehabilitation unit and recruited over a 2-month period. They were clinically evaluated with the SPRS on admission to rehabilitation and again at discharge (or 3 months later if still hospitalized). Mean ages at injury for the 2 samples were 35 and 33 years, respectively, with 83% and 80% being males, and road traffic crashes being the most common cause of injury (70% and 50%, respectively). Duration of post-traumatic amnesia (PTA) was in excess of 1 week in 97% and 100% of the respective samples. Initial evaluation with the SPRS was conducted at 23 months and 1 month post-trauma, respectively.
For aims (ii) to (iv), the two broad groups of participants were healthy volunteers living in the community (control group; n = 105) and people with TBI (n = 510), all resident in New South Wales, Australia. The healthy volunteers were a convenience sample recruited by advertisement, originally for the purpose of providing normative data in the development of the extended version of the Rivermead Behavioural Memory Test (20). The sample, comprising 51 males and 54 females, was designed to provide a broad range of ages and intelligence levels. Mean age was 39.7 years (standard deviation (SD) = 16.68, range 16–76 years) and mean years of education was 13.52 years (SD = 2.80; range 6–22 years). Mean IQ, as measured by the National Adult Reading Test, was 106.31 (SD = 11.74; range 76–127): 12 participants had IQ less than 90, 46 had IQ between 90 and 109, and 47 had IQ greater than 110.
Data for the TBI group (n = 510) comprised participants from 5 published studies (10, 13, 16, 21, 22), along with unpublished data from the Liverpool Brain Injury Rehabilitation Unit (n = 222; n = 72 on Form A and n = 150 on Form B). The data were combined to form 4 groups. The 2 groups of participants with data on Form A (change since injury) comprised those assessed at the point of discharge from inpatient rehabilitation (n = 104) and participants more than 12 months post-trauma who were (mostly) living in the community (n = 201). Similarly, participants with data on Form B (current status) were grouped into those assessed at the point of discharge from inpatient rehabilitation (n = 55) and participants more than 12 months post-trauma who were living in the community (n = 150). Table I provides stratification of the TBI samples on age, sex, duration of PTA and time since injury, and the healthy volunteers on age and sex. In general, the TBI group sustained very severe injuries, with the median durations of PTA of 35 days and 40 days for participants completing Form A and Form B, respectively (although the range was large; 1–231 days). Data for racial background were not consistently collected in all the studies and are therefore not reported here. A uniform criterion for all samples was that participants had sufficient fluency in English to complete the measure reliably, thereby reducing the representation of participants from culturally and linguistically diverse groups with lower levels of acculturation to Australian society.
| Table I. Sample sizes for stratified subgroups |
| | Form A: rehabilitation discharge | Form A: community | Form B: rehabilitation discharge | Form B: community | Healthy volunteers |
| Total, n | 104 | 201 | 55 | 150 | 105 |
| Age, n 15–25 26–50 51–75 | 28 60 16 | 53 108 40 | 13 32 10 | 41 72 37 | 29 44 32 |
| Sex Males Females | 76 28 | 163 38 | 37 18 | 116 34 | 51 54 |
| PTA (n = 469), n < 30 days 31–90 days > 90 days | (n = 81) 30 39 12 | (n = 199) 90 62 47 | (n = 39) 14 21 4 | (n = 150) 60 56 34 | NA |
| Time post-trauma, n < 2 years 2–10 years > 10 years | 104 0 0 | 133 58 10 | 55 0 0 | 54 76 20 | NA |
| PTA: post-traumatic amnesia. |
Procedure
All data (published and unpublished, healthy controls and people with TBI) were collected in studies that had received approval from the relevant Area Health Service Human Research Ethics Committees. With the exception of one sample (n = 150 for Form B Community), all other samples had been administered the original 7-point version of the SPRS. The SPRS-2 now uses a 5-point scale; therefore the descriptive data and group comparisons in this report used data re-coded for a 5-point version. The administration format of the SPRS for the TBI comparison data used in the tables had always been a clinician-rated SPRS. The procedure of using a clinician-rated SPRS for the present report was adopted in order that the pooled data for the tables were collected in a uniform manner. Data for the healthy controls were, however, self-report.
For the healthy controls, Form B (current status) was administered and for those SPRS items that contain two or more components (items 1, 4, 6, 7, 9, and 10), each component was administered separately. For example, item 4 asks “how good are your organising abilities for work and leisure?” Thus, a separate item asked about organizing work and another about organizing leisure. The mean of such items was calculated for the purposes of obtaining comparability with a 12-item SPRS.
Statistical analysis
For aim (i) (the equivalence of the 7-point and 5-point versions of the SPRS), statistical analyses were conducted on data previously collected for the original psychometric study on Form A (10) using the 7-point version, but re-coded for a 5-point version. First, Spearman correlations were conducted between the original and re-coded versions to assess the relationship between the total and domain scores of the two versions, as well as the individual items. Second, analyses that had been reported previously for the original version (10) were repeated on the re-coded version; specifically, (i) intraclass correlations on inter-rater and test-retest reliability data for total and domain scores; (ii) Wilcoxon Signed Ranks tests on the responsiveness data (rehabilitation admission vs discharge) for the total score, along with calculation of effect size; (iii) calculation of Cronbach’s alpha coefficients to examine internal consistency of the total and domain scores; (iv) Spearman’s correlations to evaluate concurrent validity with other similar scales, and convergent and divergent validity with hypothesized patterns of correlation with dimensions of the Sickness Impact Profile; and (v) Kruskal-Wallis analyses of variance to examine discriminant validity with the Glasgow Outcome Scale, along with post-hoc Mann–Whitney U tests for sub-group comparisons.
For aim (ii) (construct validity), rating scale analysis was conducted using the WINSTEPS computer program (version 3.63.0). A series of analyses was conducted to examine the fit of the SPRS-2 to a Rasch model, for each of Form A (n = 201) and Form B (n = 150) from the TBI community samples. The common characteristics were examined and standard criteria applied (18, 23): reliability of the SPRS-2 was examined by determining the extent to which it distinguished among persons with different levels of participation (person separation, with the criterion set at ≥ 2.0, and reliability at ≥ 0.80), and the degree to which the item response categories reflected increasing levels of participation (item separation, with the criterion set at ≥ 2.0, and reliability at ≥ 0.80). Construct validity of the SPRS-2 was examined in terms of the hierarchy of items, using the infit mean square statistic, with criterion set at between 0.70 and 1.30 (18).
For aim (iii) (normative and TBI comparative data), data from the healthy controls (n = 105) and the SPRS-2 data for the 4 TBI groups: Form A change since injury – discharge rehabilitation (n = 104), community (n = 201); Form B current status – discharge rehabilitation (n = 55), community samples (n = 150) were examined separately for score distribution and floor/ceiling effects. Given the ordinal nature of the data, non-parametric analyses were conducted to examine group differences for age, sex, IQ (for the healthy controls), and duration of PTA (for the TBI groups). Tables of normative and TBI comparison data were constructed, stratifying the sample where results of statistical analysis identified group differences.
For aim (iv) (reliable change index) a number of procedures are available to calculate the reliable change index (see review by Perdices (24)), and we used the formula described in Ley (25), applying it to logit scores for SPRS-2 derived from the Rasch analysis. The minimum difference (MD) required for a reliable change in score between two data collection occasions (Time 1 and Time 2) was calculated using the following formula:
MD = zMD √2xσ2(1-rxy),
where zMD is the z score associated with a change in logit scores of magnitude MD between data collection occasions, σ is the standard deviation at Time 1, and rxy is the test-retest reliability coefficient. The original psychometric study on Form A (10), using Sample A described in the Methods section for aim (i), contained test-retest data which were converted to logit scores using data derived from the Rasch analyses and the test-retest correlation coefficient recalculated; the SD for that sample was also calculated in logit scores. Given that scores could either improve or deteriorate over time, two-tailed tests of significance were used, and thus zMD = 1.96.
Results
Aim i: equivalence of the 7-point and 5-point versions
Results of the SPRS re-coded for a 5-point scale are presented in Table II. Inter-correlation coefficients between the 7-point and 5-point versions for all variables were very high (total score rs = 0.98, domains rs > 0.96, items rs > 0.94), and the pattern of psychometric properties was virtually identical to that produced by the 7-point version. These results affirmed our decision to adopt the 5-point rating scale (SPRS-2).
| Table II. Psychometric properties of the Sydney Psychosocial Reintegration Scale (SPRS) (Form A) comparing the original 7-point version and the re-coded 5-point version |
| | Original 7-point version (SPRS) | Re-coded 5-point version (SPRS-2) |
| Inter-rater reliability: total score Domains Occupational activity Interpersonal relationships Independent living skills | ICC = 0.95 0.93 0.86 0.94 | ICC = 0.94 0.93 0.85 0.93 |
| Test-retest reliability (1 month): total score Domains Occupational activity Interpersonal relationships Independent living skills | ICC = 0.90 0.93 0.79 0.88 | ICC = 0.91 0.94 0.80 0.87 |
| Responsiveness: inpatient admission vs discharge | z = –3.82, p < 0.001, d = –3.92 | z = –3.82, p < 0.001, d = –3.11 |
| Internal consistency (Cronbach’s alpha): total score Domains Occupational activity Interpersonal relationships Independent living skills | 0.90 0.89 0.69 0.77 | 0.89 0.88 0.72 0.75 |
| Concurrent validity, with: London Handicap Scale Katz Adjustment Scale (Form R2) Glasgow Outcome Scale – Extended Sickness Impact Profile (SIP) (Psychosocial Index + work and recreation/pastimes | rs = –0.85 0.76 –0.77 –0.76 | rs = –0.86 0.74 –0.72 –0.78 |
| Discriminant validity Glasgow Outcome Scale Good vs moderate Moderate vs severe | KW= 35.66, p < 0.001 MW: p < 0.001 MW: p < 0.03 | KW = 35.59, p < 0.001 MW: p < 0.001 MW: p < 0.03 |
| Convergent and divergent validity e.g. Sickness Impact Profile (SIP): SIP Physical with SPRS Living Skills vs SIP Physical with SPRS Relationships | rs = –0.58 rs = –0.23 | rs = –0.61 rs = –0.27 |
| KW: Kruskal-Wallis; MW: Mann–Whitney U; ICC: intra-class correlation. |
Aim ii: rating scale analysis
Results of the rating scale analysis are provided in Table III. Form A of the SPRS-2 (5-point re-coded version) showed good person separation (3.36, reliability 0.92) and item separation (7.78, reliability 0.98). Mean infit mean square statistics for both persons (1.03) and items (1.00) were within the criterion range (0.7–1.3), with one item (item 6 – family) showing misfit (1.53). The misfit was primarily due to two persons, suggesting that it can probably be attributable to idiosyncratic persons, rather than a defect in the item. A supplementary Rasch analysis was conducted on the data excluding the misfitting persons, but the result did not appreciably improve, and for this reason the original analysis with all participants (including the misfitting, but probably clinically important persons) was retained.
| Table III. Results of Rasch analyses on the Sydney Psychosocial Reintegration Scale SPRS-2 for Form A and Form B |
| Item | Form A | Form B |
| Logit score | Infit | Outfit | Logit score | Infit | Outfit |
| MNSQ | zSTD | MNSQ | zSTD | MNSQ | zSTD | MNSQ | zSTD |
| 1 | 1.3 | 1.28 | 2.3 | 1.46 | 2.9 | 1.5 | 0.93 | –0.6 | 0.94 | –0.3 |
| 2 | 1.06 | 0.71 | –2.9 | 0.62 | –3.3 | 1.22 | 0.68 | –2.9 | 0.74 | –1.8 |
| 3 | 0.61 | 0.83 | –1.6 | 0.96 | –0.3 | 0.26 | 0.84 | –1.4 | 0.96 | –0.3 |
| 4 | 0.46 | 0.9 | –1 | 0.83 | –1.5 | 0.39 | 0.57 | –4.3 | 0.6 | –3.5 |
| 5 | 0.38 | 1.07 | 0.7 | 1.09 | 0.8 | 0.42 | 0.67 | –3.1 | 0.69 | –2.6 |
| 6 | –0.75 | 1.53 | 4.2 | 1.6 | 4.1 | –0.39 | 1.88 | 5.8 | 2.16 | 6.5 |
| 7 | 0.09 | 1.03 | 0.3 | 0.99 | 0 | 0 | 0.89 | –0.9 | 1.01 | 0.1 |
| 8 | –0.72 | 0.74 | –2.7 | 0.97 | –0.2 | –0.79 | 0.98 | –0.1 | 1.14 | 1 |
| 9 | –0.42 | 0.72 | –3 | 0.77 | –2 | –0.74 | 0.92 | –0.6 | 0.93 | –0.4 |
| 10 | –1.21 | 1.04 | 0.4 | 0.94 | –0.4 | –1.22 | 1.23 | 1.6 | 0.93 | –0.4 |
| 11 | –0.3 | 1.25 | 2.3 | 1.16 | 1.4 | –0.08 | 1.38 | 2.9 | 1.32 | 2.2 |
| 12 | –0.49 | 0.88 | –1.2 | 0.84 | –1.4 | –0.58 | 1.29 | 2.2 | 1.27 | 1.8 |
| Mean (SD) for items | | 1.00 | (0.24) | 1.02 | (0.27) | | 1.02 | (0.35) | 1.06 | (0.39) |
| Mean (SD) for persons | | 1.03 | (0.60) | 1.02 | (0.79) | | 1.04 | (0.63) | 1.06 | (0.66) |
| SD: standard deviation; MNSQ: mean square; zSTD: statistic and standardised z. |
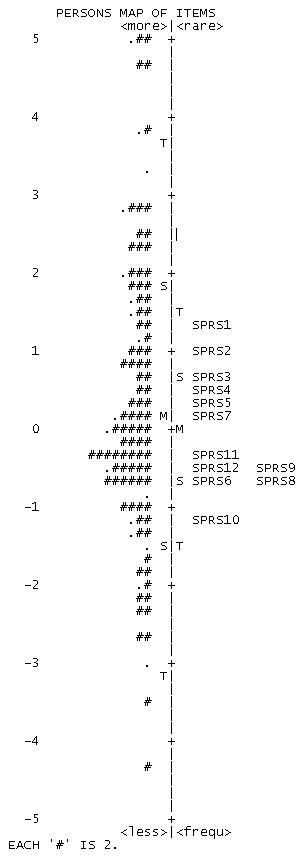
Fig. 1 shows the hierarchy of items that were clinically meaningful; items for work, leisure and interpersonal relationships (e.g. items 1, 2, 4, 5, 7, 8) were more difficult than items evaluating everyday activity living skills (e.g. items 10, 11, 12) and this accords with the literature on outcomes (e.g. 26). Inspection of the person-item map (Fig.1) suggests that the scale works best for persons performing between –1.5 and +1.5 logits.
Fig. 1. Person and item hierarchy for the Sydney Psychosocial Reintegration Scale SPRS-2 Form A (n = 201).
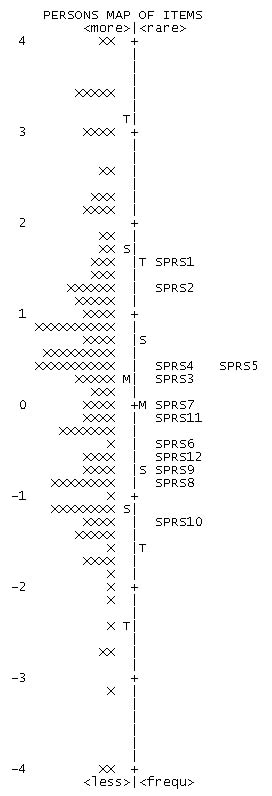
A similar result was found for the Rasch analysis of Form B of the SPRS-2 (see Table III). Person separation was 3.03 (reliability 0.90), and item separation was 7.25 (reliability 0.98). Mean infit mean square statistics for persons was 1.04, and for items was 1.02. Individually, 7 of the 12 items showed good fit within the 0.7–1.3 criterion range, and the remaining 5 items (2, 4–6, and 11) showed misfit. Inspection of the infit statistics, however, indicated that only item 4 (0.57) and item 6 (1.88) showed serious misfit. Misfit for item 4 was explained by 1 or 2 persons as outliers, but misfit for item 6 was shown for persons across the latent variable. Fig. 2 shows the hierarchy of items for Form B, which like Form A, were clinically meaningful, with items for occupational activity and intimate relationships being more difficult than items for everyday activity living skills; the person-item map showed a similar configuration.
Fig. 2. Person and item hierarchy for the Sydney Psychosocial Reintegration Scale SPRS-2 Form B (n = 150).
Aim iii: normative and traumatic brain injury comparison data
Distributions were examined for normality on the 5-point SPRS-2, but the scores were not normally distributed for most of the total and domain scores in the two samples. As expected, between-group comparisons on Form B between the healthy controls (n = 105) and community TBI group (n = 150) revealed significant differences, with the mean scores indicating that the TBI group experienced more difficulty with psychosocial functioning than did the healthy controls. This was the case for the total score (z = –6.41, p = 0.000), and each of the domains (Occupational Activity z = –8.48, p = 0.000; Interpersonal Relationships z = –4.58, p = 0.000; and Living Skills z = –2.18, p = 0.03).
Normative descriptive data on Form B (n = 105 healthy volunteers). Descriptive data for the healthy control group on SPRS-2 are displayed in Table IV. A floor and/or ceiling effect was considered present when 15% or more of the sample scores were at the extreme scores (27). There were no floor or ceiling effects for either the total score (M = 35.88, SD = 3.09; range 26 to 44) or the domains, as shown in Table V. Within-group comparisons indicated that there were no SPRS-2 differences for age, sex or IQ.
| Table IV. Descriptive data for the Sydney Psychosocial Reintegration Scale SPRS-2 for Control group, along with Form A (rehabilitation discharge and community samples) and Form B (rehabilitation discharge and community samples) |
| | Form B: control group (n = 105) | Form A: rehabilitation discharge (n = 104) | Form A: community (n = 201) | Form B: rehabilitation discharge (n = 55) | Form B: community (n =150) |
| Total score Mean (SD) Median (IQR) | 35.88 (3.09) 36.00 (4.00) | 19.54 (10.02) 20.00 (14.00) | 26.18 (12.87) 25.00 (21.00) | 21.92 (9.18) 22.13 (13.00) | 26.57 (12.45) 20.00 (20.00) |
| Occupational Activities Mean (SD) Median (IQR) | 11.28 (1.34) 10.00 (1.00) | 3.56 (2.94) 4.00 (4.00) | 6.54 (4.95) 5.00 (9.00) | 4.09 (3.00) 4.00 (4.00) | 6.49 (4.62) 6.00 (8.00) |
| Interpersonal Relationships | | | | | |
| Mean (SD) Median (IQR) | 11.94 (1.46) 12.00 (2.00) | 9.16 (3.83) 10.00 (5.00) | 9.37 (4.31) 10.00 (7.00) | 9.96 (3.40) 11.00 (4.00) | 9.41 (4.43) 10.00 (7.00) |
| Living Skills | | | | | |
| Mean (SD) Median (IQR) | 12.66 (1.52) 12.00 (2.00) | 6.82 (4.22) 7.00 (7.00) | 10.28 (4.62) 11.00 (6.00) | 7.62 (4.13) 7.00 (6.00) | 10.68 (4.59) 12.00 (6.00) |
| SD: standard deviation; IQR: interquartile range. |
TBI comparison data (n = 510). For the TBI groups, SPRS-2 scores for the samples are presented in Table V. There were no floor or ceiling effects for the community samples for either Form A (n = 201) or Form B (n = 150). Within the TBI samples, significant differences occurred among PTA subgroups in all samples, with the results indicating poorer SPRS-2 scores in groups with longer duration of PTA. Therefore, scores were stratified by PTA for all groups. SPRS-2 means and SD for the TBI samples are presented in Table VI.
| Table V. Floor and ceiling effects in the community samples for the Sydney Psychosocial Reintegration Scale SPRS-2 Form A and Form B |
| | Form A (TBI, n = 210) | Form B (TBI, n = 150) | Form B (controls, n = 105) |
| Floor % | Ceiling % | Floor % | Ceiling % | Floor % | Ceiling % |
| Total | 0.0 | 2.5 | 1.3 | 1.3 | 0.0 | 0.0 |
| Occupational activity | 9.0 | 5.0 | 10.0 | 2.7 | 0.0 | 0.0 |
| Interpersonal relationships | 0.5 | 7.0 | 2.0 | 8.7 | 0.0 | 0.0 |
| Living skills | 3.5 | 11.9 | 3.3 | 14.0 | 0.0 | 6.7 |
| TBI: traumatic brain injury. |
| Table VI. Descriptive data for Sydney Psychosocial Reintegration Scale SPRS-2 for Form A (rehabilitation discharge and community samples) and Form B (rehabilitation discharge and community samples), stratified by duration of post-traumatic amnesia |
| PTA subgroup | Form A: rehabilitation discharge (n = 104) Mean (SD) | Form A: community (n = 201) Mean (SD) | Form B: rehabilitation discharge (n = 55) Mean (SD) | Form B: community (n = 150) Mean (SD) |
| < 30 days | | | | |
| Total | 24.93 (8.31) | 32.98 (11.22) | 31.07 (4.50) | 33.27 (9.62) |
| OA | 4.57 (2.22) | 8.97 (4.98) | 6.67 (2.32) | 8.58 (4.64) |
| IR | 10.93 (3.67) | 11.24 (3.91) | 12.60 (1.88) | 11.37 (3.53) |
| LS | 9.43 (3.63) | 12.77 (3.20) | 11.47 (2.07) | 13.32 (2.73) |
| 31–90 days | | | | |
| Total | 20.62 (9.07) | 25.48 (10.55) | 21.33 (5.77) | 27.05 (11.28) |
| OA | 4.00 (3.15) | 6.03 (3.98) | 4.18 (2.72) | 6.64 (4.11) |
| IR | 9.44 (3.25) | 8.87 (3.96) | 10.09 (2.43) | 9.50 (4.33) |
| LS | 7.18 (3.63) | 10.58 (3.69) | 7.82 (3.02) | 10.93 (3.97) |
| > 91 days | | | | |
| Total | 12.92 (6.26) | 14.70 (9.47) | 12.50 (5.92) | 13.97 (8.80) |
| OA | 1.50 (1.57) | 2.70 (3.14) | 1.40 (1.67) | 2.53 (2.38) |
| IR | 7.67 (2.15) | 6.66 (3.73) | 7.80 (1.79) | 5.82 (3.87) |
| LS | 3.75 (3.36) | 5.34 (3.93) | 3.40 (2.30) | 5.62 (4.07) |
| PTA: post-traumatic amnesia; OA: occupational activities, IR: interpersonal relationships; LS: independent living skills; SD: standard deviation. |
Aim iv: critical values to determine reliable change
Table VII provides a conversion table, reproduced from the SPRS-2 manual, to convert SPRS-2 raw scores to logit scores scaled from 0 to 100. The formula to determine the reliable change index used the test-retest coefficient (re-calculated with logit scores) for the total score on Form A (ICC = 0.92). The minimum difference between two sets of scores required to indicate that such a difference is not a function of the measurement error of the scale was 8.23 logits. In other words, a change score greater than 8.23 logits for the total score is required for such a change to represent the minimum difference required for significance.
In order to apply the procedure, the Time 1 SPRS-2 raw score is first converted to logits using Table VII, then the constant of 8.23 is added to the logit score. This new logit score is the minimum score required to determine whether the change in score is reliable. The new logit score is then converted back to a SPRS-2 raw score, again using Table VII. This SPRS-2 score represents the minimum SPRS-2 raw score required to determine whether the change in score is reliable. If the Time 2 SPRS-2 raw score exceeds this minimum SPRS-2 score, then the change in score is reliable.
| Table VII. Conversion table for the Sydney Psychosocial Reintegration Scale SPRS-2 raw scores to Rasch logit scores scaled from 0 to 100 |
| Form A | Form B |
| Raw score | Logit | Raw score | Logit | Raw score | Logit | Raw score | Logit |
| 0 | 0 | | | 0 | 0 | | |
| 1 | 11.02 | 25 | 48.64 | 1 | 11.56 | 25 | 48.23 |
| 2 | 17.76 | 26 | 49.52 | 2 | 18.15 | 26 | 49.09 |
| 3 | 21.96 | 27 | 50.39 | 3 | 22.16 | 27 | 50.05 |
| 4 | 25.02 | 28 | 51.18 | 4 | 24.92 | 28 | 50.91 |
| 5 | 27.38 | 29 | 52.06 | 5 | 27.22 | 29 | 51.77 |
| 6 | 29.40 | 30 | 53.02 | 6 | 29.04 | 30 | 52.72 |
| 7 | 31.15 | 31 | 53.89 | 7 | 30.66 | 31 | 53.68 |
| 8 | 32.63 | 32 | 54.86 | 8 | 32.09 | 32 | 54.63 |
| 9 | 34.03 | 33 | 55.91 | 9 | 33.33 | 33 | 55.68 |
| 10 | 35.26 | 34 | 56.96 | 10 | 34.57 | 34 | 56.73 |
| 11 | 36.40 | 35 | 58.01 | 11 | 35.72 | 35 | 57.88 |
| 12 | 37.45 | 36 | 59.14 | 12 | 36.77 | 36 | 59.03 |
| 13 | 38.50 | 37 | 60.37 | 13 | 37.73 | 37 | 60.27 |
| 14 | 39.37 | 38 | 61.77 | 14 | 38.68 | 38 | 61.51 |
| 15 | 40.33 | 39 | 63.25 | 15 | 39.64 | 39 | 62.94 |
| 16 | 41.21 | 40 | 64.83 | 16 | 40.59 | 40 | 64.47 |
| 17 | 42.08 | 41 | 66.67 | 17 | 41.45 | 41 | 66.19 |
| 18 | 42.96 | 42 | 68.68 | 18 | 42.31 | 42 | 68.10 |
| 19 | 43.74 | 43 | 71.04 | 19 | 43.17 | 43 | 70.30 |
| 20 | 44.62 | 44 | 73.84 | 20 | 44.03 | 44 | 72.97 |
| 21 | 45.41 | 45 | 77.25 | 21 | 44.89 | 45 | 76.23 |
| 22 | 46.19 | 46 | 81.71 | 22 | 45.75 | 46 | 80.71 |
| 23 | 47.07 | 47 | 88.80 | 23 | 46.61 | 47 | 87.91 |
| 24 | 47.86 | 48 | 100 | 24 | 47.37 | 48 | 100 |
Discussion
Together with psychometric data published previously (10, 13–16), these results confirm that the SPRS has high-quality psychometric properties. The results also attest to the improved clinical utility of the SPRS-2, with the provision of reliable change data allowing a rigorous determination as to whether an individual has improved (or deteriorated). Moreover, from a clinical perspective, users of the SPRS find the 5-point scale easier to complete than the 7-point format. We tested the comparability from a psychometric perspective, and results indicated that the 5-point version of the SPRS is a reliable and valid instrument. Results of the Rasch analysis on the larger data-sets used in this report on SPRS-2 confirm that internal consistency is high for both Form A and Form B. In addition, using the larger sample sizes of community clients, the floor and ceiling effects for the total score and all domains for each of Form A and Form B were less than the conservative criterion of 15% (27), and well within the more commonly accepted criterion of less than 20% (11). We acknowledge that it will be necessary to replicate the psychometric properties using data that are specifically collected using the 5-point version itself, rather than a re-coded format, but the necessary first step was to determine comparability with the original data-sets. The 5-point SPRS-2 is thus a viable instrument, both clinically and psychometrically.
For the first time, data from a Rasch analysis are reported for the SPRS-2. The results provide further evidence of the construct validity of both Form A and Form B of the SPRS. Each form showed a good fit to a Rasch model, with both person and item separations and reliability coefficients meeting standard criteria. A small number of items showed misfit, but inspection of the data indicated that a number of persons were outliers. An exception was the misfit for item 6 on Form B, which could not be explained by persons being outliers. We elected not to delete the seriously misfitting item 6 (family), due to its clinical relevance. There are already precedents where misfitting items are retained in a scale because of their clinical importance (e.g. 28). It should be noted, however, that this pattern of misfit was not shown for item 6 in Form A, thus further work may be needed to examine the reasons underlying the discrepancy in these results between the SPRS-2 forms.
The SPRS uses a Likert-type rating scale for administration, providing measurement at the ordinal level. Ordinal data have marked restrictions in the application of statistical procedures. Data from the Rasch analysis furnish logit scores, and so for rigorous application these can be used for the SPRS-2. Indeed, the importance of using an interval level of measurement is illustrated by Table VII. At the extremes of the scale a smaller minimum difference of raw scores is required to demonstrate reliable change than in the mid-ranges of the scale. Similar results have been found for other scales, such as the Functional Independence Measure (29) when Rasch analysis has been applied. We did not have test-retest data on a 5-point version for Form B, and so logit scores could not be calculated to produce a test-retest coefficient to use in the formula to identify the critical value to determine reliable change. However, because (i) the logit scores on Form B closely correspond to those of Form A (see Table VII), and (ii) the test-retest correlation coefficients in the original psychometric studies on Form A (10) and Form B (13) were identical (ICC = 0.90), we consider that, until test-retest reliability data for the 5-point version of Form B are available, using the same Form A logit value of 8.23 will provide a close approximation of the minimum difference required to determine whether a change in scores on Form B is reliable.
Taking all these results together, in terms of Andresen’s (11) criteria for a good scale, the SPRS originally met 3 criteria at Level A (reliability, validity, and responsiveness), 5 criteria at Level B (conceptual framework, item/instrument bias in terms of factor analysis, administrative burden, respondent burden, and measurement model in terms of floor/ceiling effects), and 3 criteria at Level C (normative data, availability of alternate forms, and cultural adaptations). The present report has addressed several of the criteria at Levels B and C: (i) with the provision of both normative and TBI comparison data in this report the SPRS-2 meets Level A for this criterion, although we acknowledge that the normative data-set provided in this study is from a relatively small, convenience sample, (ii) with documentation of the absence of floor and ceiling effects (cf. Andresen’s measurement model) it meets Level A, and (iii) changing the SPRS to a 5-point rating scale, and demonstrating its psychometric equivalence to the original version, indicates that administrative and respondent burden now meets Level A. Consequently, the SPRS-2 now meets 7 of the 11 criteria at Level A, 2 at Level B, and 2 (cultural adaptations and availability of alternate forms) at Level C. Work is currently in progress to translate the SPRS-2 into languages other than English. In terms of the second Level C criterion, although the availability of alternate forms is particularly important for some types of measures (viz, cognitive tests, which can be subject to practice effects), the need is not so relevant for scales of participation (such as the SPRS). Finally, a paediatric version of the scale has been completed.
The good psychometric properties of the SPRS, along with its clinical relevance and ease of administration, are reasons for its continued use. It compares very well with other scales of participation commonly used for the TBI group, such as the CIQ, CHART and MPAI. In terms of a head-to-head comparison, the structure of the above 3 scales and SPRS is similar, all providing a relatively brief sampling of participation items (from 8 items in the MPAI – Participation subscale to 32 items in the CHART, and the CIQ and SPRS containing 15 and 12 items, respectively). They also all take an exteriorized (i.e. objective) perspective on measuring participation, as opposed to a client-centred (i.e. subjective) perspective (see ref. (30) for discussion of the classification of scales of participation). Within the exteriorized perspective, however, whereas the other measures adopt a frequency-type approach (e.g. number of hours of work, number of friends, percentage of time the activity is interfered with), the SPRS uses a qualitative approach (e.g. standard of work performance, quality of relationships). It thus has the capacity to capture the changes in the quality of a person’s everyday functioning that are not captured by a frequency count. The MPAI and the SPRS probably provide the most comprehensive set of psychometric data, attesting to the very good psychometric properties of both scales (12). Certainly, however, the CIQ is the most commonly used scale of participation in the TBI research literature from the USA. Other more recently developed scales of participation (31–33), constructed using the ICF as a model, also show promise. Given the myriad of stakeholders who have an interest in the domain of participation (consumers, family members, rehabilitation service providers, researchers, funders, health planners and policymakers), continuing efforts in the development and refinement of high-quality measures is essential.
Acknowledgements
We are grateful to Dr Mike Linacre for helpful advice on the Rasch analyses conducted for this paper. Acknowledgement is also made of the researchers who contributed data on the SPRS. Some of the studies on which this paper is based were supported by the Motor Accidents Authority of New South Wales, Australia.
References