Shamay S. M. Ng, PhD, Phoebe C. M. Ng, BSc(Hons), Connie Y. W. Lee, BSc(Hons), Elva S. W. Ng, BSc(Hons) and Mimi H. W. Tong, BSc(Hons)
From the Department of Rehabilitation Sciences, The Hong Kong Polytechnic University, Hong Kong (SAR), China
Shamay S. M. Ng, PhD, Phoebe C. M. Ng, BSc(Hons), Connie Y. W. Lee, BSc(Hons), Elva S. W. Ng, BSc(Hons) and Mimi H. W. Tong, BSc(Hons)
From the Department of Rehabilitation Sciences, The Hong Kong Polytechnic University, Hong Kong (SAR), China
OBJECTIVES: To investigate the effect of walkway length (5, 8 or 10 m) on measurements of comfortable and maximum walking speed.
DESIGN: A cross-sectional study.
SETTING: University-based rehabilitation centre.
SUBJECTS: Patients (n = 25) with chronic stroke.
METHODS: Timed walking with different walkway lengths (5, 8 and 10 m) walkways were recorded using a stop-watch.
RESULTS: No significant effect of walkway length was found on either the comfortable or maximum walking speed in subjects with chronic stroke. For all walkway lengths, comfortable speed was significantly different from maximum speed (p < 0.001).
CONCLUSION: There is no significant effect of walkway length (5, 8 and 10 m) on either comfortable or maximum walking speed. Different walkway lengths can yield consistent results in measuring gait speed clinically. A 5-m walkway with standardized 2-m acceleration and deceleration distances is recommended as it occupies the least space and imposes less stress on subjects.
Key words: walking; stroke; speed; rehabilitation; hemiplegia.
J Rehabil Med 2012; 44: 43–46
Correspondence address: Shamay S. M. Ng, Department of Rehabilitation Sciences, The Hong Kong Polytechnic University, Hong Kong (SAR), China. E-mail: Shamay.Ng@inet.polyu.edu.hk
Submitted June 14, 2011; accepted September 19, 2011
INTRODUCTION
Walking speed is widely used in the clinic as an indicator of gait performance after stroke (1). It is simple to measure, highly reliable and responsive (2). Both comfortable and maximum walking speeds are required to document walking ability properly. Comfortable walking speed is often used as an indicator of walking performance in clinical assessment (3), whereas maximum walking speed is important for daily activities, such as crossing a street (2).
To measure comfortable walking speed subjects are asked to walk at their own most comfortable speed for a given distance. Excellent test-retest reliability has been reported, with intraclass correlation coefficients (ICCs) of 0.86–0.99 among subjects with acute stroke (4–6) and those with chronic stroke (7, 8). Comfortable walking speed can also reflect minimal clinical changes over time in stroke subjects, with responsiveness ratios from 3.41 to 17.7 (2, 9). Moreover, a standard error of measurement (SEM%) of only 7.9% has been reported with 50 subjects with chronic stroke (8).
For the measurement of maximum walking speed, subjects are asked to walk as quickly as they can for a given distance. Excellent test-retest reliability has also been reported for such measurements of maximum walking speed, with an ICC of 0.88–0.97 in subjects with acute stroke (5) and chronic stroke (8–10). A small SEM of 7.5% has also been reported with 50 subjects with chronic stroke (8).
Although these walking speed tests are commonly used as a measuring tool in stroke rehabilitation, the walkway length has never been standardized. Various clinical studies have adopted lengths of 2–14 m (2–14, 15–19), and 20–30 feet (20). Three studies (21–23) did not mention the walkway length.
Although walkway length might affect the walking strategies chosen and walking speed adopted (13, 21, 22), the effects of walkway length on walking speed for patients with stroke has not yet been documented systematically. Najafi et al. (21) found that healthy older adults chose to walk faster over a longer (20-m) walkway compared with a shorter (10-m) one. In clinical trials of subjects with stroke, Salbach et al. (13) reported that the maximum walking speed using a 5-m walkway was greater than that using a 10-m walkway, while Ng et al. (22) demonstrated that subjects with chronic stroke walked faster over a longer walkway in the 6-min walk test.
The aim of this study was to investigate the effect of walkway lengths of 5, 8 and 10 m on measurements of comfortable and maximum walking speeds in patients with stroke.
METHODS
Participants
This study was a cross-sectional clinical trial. According to the study of Hsu et al. (23), differences of 0.33 m/s were required to represent significant differences between comfortable and maximum walking speed in patients with stroke. At least 22 subjects would be needed if the statistical significance was set at 5% (α level at 0.05) and the power at 80% (β level at 0.2).
Twenty-five subjects (20 men, 5 women; mean age: 59.2, standard deviation (SD) 8.3 years) with post-stroke duration of 6.0 years (SD 4.6) were recruited from a local rehabilitation network in Hong Kong (Table I). The inclusion criteria were: (i) at least 6 months since the most recent stroke; (ii) aged 40 years or above; (iii) able to walk 10 m independently with or without an assistive device; (iv) having an Abbreviated Mental Test score of 7 or higher; and (v) having a general medical condition stable enough to perform the tests. Subjects were excluded if they had a neurological disorder other than stroke, or if they had co-morbid disabilities that would hinder proper assessment.
| Table I. Characteristics of the subjects with stroke (n = 25) | |
| Characteristics | |
| Gender, n (%) Male Female | 20 (80) 5 (20) |
| Type of stroke, n (%) Ischaemic Haemorrhage | 13 (52) 12 (48) |
| Stroke attacks, n (%) One Two | 19 (76) 6 (24) |
| Side of hemiplegia, n (%) Right Left | 12 (48) 13 (52) |
| Mobility status, n (%) Unaided Stick Quadripod | 9 (36) 13 (52) 3 (12) |
| Ankle-foot orthosis, n (%) Yes No | 2 (8) 23 (92) |
| Falls, n (%) None Once Twice > Twice | 23 (92) 0 (0) 1 (4) 1 (4) |
| Age, years, mean (SD) [range] | 59.20 (8.25) [41–75] |
| Weight, kg, mean (SD) [range] | 68.76 (10.50) [50–90] |
| Height, cm, mean (SD) [range] | 165.40 (7.62) [152–182] |
| BMI, kgm–2, mean (SD) [range] | 25.11 (3.40) [20.82–33.30] |
| Post-stroke duration, years, mean (SD) [range] | 5.99 (4.63) [0.67–17.08] |
| Plantarflexor spasticity level (Modified Ashworth Scale), median (SD) [range] | 2 (1.38) [0–4] |
| Berg Balance Scale, median (SD) [range] | 53 (6.69) [27–56] |
| Fugl-Meyer Assessment Lower Extremity, median (SD) [range] | 26 (4.97) [15–33] |
| SD: standard deviation; BMI: body mass index. | |
All subjects provided written consent before participating. The study was approved by the local ethics committee and conducted according to the Declaration of Helsinki for human experiments.
Measurements
Walk tests. Three separate walkways, 5, 8 and 10 m long, were marked out in a straight corridor using coloured tape, with additional 2-m acceleration and deceleration zones at each end. The time a subject used to walk through the middle 5-, 8- or 10-m section was recorded using a stop-watch. The subjects started 2 m from the start of the test segment when the investigator said “Ready, go”. To ensure safety, an investigator walked slightly behind, but not beside the subject, so as to avoid influencing their usual speed.
Each subject performed the test under 6 experimental conditions in random sequence by drawing lots. Three trials were performed under each experimental condition, with 2 min rest in between each trial. A 2-min rest period was also provided after each experimental condition to avoid any fatigue. The mean value of 3 trials in each experimental condition was used for data analysis. The 6 conditions are as follows:
• Condition 1: 5-m walk test at comfortable walking speed.
• Condition 2: 8-m walk test at comfortable walking speed.
• Condition 3: 10-m walk test at comfortable walking speed.
• Condition 4: 5-m walk test at maximum walking speed.
• Condition 5: 8-m walk test at maximum walking speed.
• Condition 6: 10-m walk test at maximum walking speed.
Statistical analysis
Descriptive statistics were computed to describe the demographic characteristics of the subjects. Differences between comfortable and maximum walking speeds over each walkway length were analysed by paired t-tests. Differences of walking speed between 3 different walkway lengths were analysed by 1-way repeated measures analysis of variance (ANOVA), followed by Bonferroni post hoc multiple comparison test. The analysis employed the Statistical Package for the Social Sciences (Version 17.0, SPSS Inc., USA).
RESULTS
No significant difference was found among different walkway lengths when assessing comfortable walking speed or maximum walking speed (Table II). There was, however, a significant difference between the comfortable and maximum walking speed (p ≤ 0.001) assessed over any walkway length (Fig. 1).
| Table II. Comfortable and maximum walking speed over 5-, 8- and 10-m walkways | ||||
| Walking strategy | Mean walking speed, m/s (SD) | p-value | ||
| 5 m | 8 m | 10 m | ||
| Comfortable walking speed | 0.76 (0.26) | 0.78 (0.30) | 0.79 (0.27) | p = 0.093 |
| Maximum walking speed | 0.99 (0.40) | 0.97 (0.36) | 1.00 (0.37) | p = 0.452 |
| SD: standard deviation. | ||||
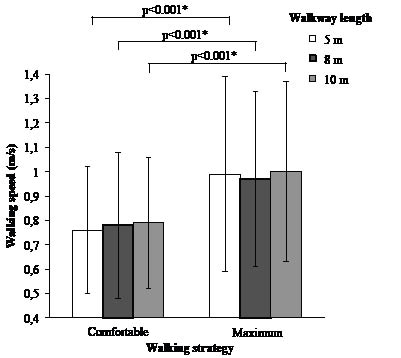
Fig. 1. Mean walking speed under each test condition. *Statistically significant difference between comfortable and maximum walking speed (p ≤ 0.05).
DISCUSSION
This was the first systematic study to investigate the effect of walkway length on comfortable and maximum walking speed measurements on subjects with chronic stroke. The results showed no significant difference in either comfortable or maximum walking speed along 5-, 8- and 10-m walkways.
The mean comfortable walking speeds over the 5-, 8- and 10-metre walkways were 0.76 m/s, 0.78 m/s and 0.79 m/s, respectively. These were slower than the speeds measured in a previous study using a 5-m walkway (0.86 m/s) (1), but were consistent with those previously reported using an 8-m walkway (0.69–0.80 m/s) (24, 25) and 10-m walkways (0.65–0.94 m/s) (8, 18, 26, 27). The mean maximum walking speeds over the 5-, 8- and 10-m walkways were 0.99, 0.97 and 1.00 m/s, respectively. These were slower than the speeds reported in previous studies using 5-m (1.28 m/s) and 10-m walkways (1.3–1.5 m/s) (8, 10, 27). No previous study used an 8-m walkway for measuring maximum walking speed.
There are several possible reasons for these inconsistencies in walking speed (i.e. slower walking speed) when comparing our results with those of previous studies. First, the demographic characteristics of subjects were different, including age, height, body weight, body mass index, and time since stroke. Our subjects with chronic stroke had spastic plantarflexors (Table I), with mean Modified Ashworth Scale scores 2 (SD 1.38), which could explain the slower walking speed. Hsu et al. (23) found that plantarflexor spasticity was the most important independent determinant of gait symmetry (R2 = 0.45–0.76) during walking at both comfortable and fast speeds in patients with stroke.
Our results are consistent with those of Dobkin (28), that there is no significant difference between comfortable walking speed measured using a 15-m walkway, and average walking speed using 35-m walkway in a 6-min walk test with 24 patients with chronic stroke. Note that subjects in the study of Dobkin (28) were instructed to “walk at usual comfortable speed” during the 6-min walk test.
Our results, however, disagree, with the findings of a study of 50 subjects with acute stroke conducted by Salbach’s group (13). That study concluded that fast walking speed measured using a 5-m walkway was greater than that measured using a 10-m walkway after correction for multiple comparisons, and such difference could not be found for comfortable walking speed. The inconsistent findings might be explained by the fact that subjects in the study of Salbach et al. (13) were only 8–38 days post-stroke. Subjects with acute stroke might not have the muscular endurance and active muscle control to complete a 10-m walk at a steady speed.
The ability to increase walking speed voluntarily from slow to maximum speed helps stroke survivors to adapt better in activities of community life, such as crossing a street and facing unpredictable pedestrian and street traffic. Consistent with the findings of previous studies (15, 28), the maximum walking speeds measured in the current study were 0.23, 0.20 and 0.21 m/s faster than the comfortable walking speeds over the 5-, 8- and 10-metre walkways, respectively. Studies led by Bohannon (15) and Dobkin (28) both showed a difference of approximately 2 m/s between comfortable and maximum walking speed with chronic (15) and sub-acute stroke subjects (28), respectively. Dobkin (28) reported that slow walkers with speed less than 0.5 m/s showed no significant difference between their comfortable and maximum walking speeds, but the sample size (n = 5) was too small to support any definite conclusions. Further investigation may be needed to determine whether baseline walking speed may affect the differences between comfortable and maximum walking speed.
Difficulties in increasing the walking speed beyond comfortable speed have been reported in people with stroke (28). Community-dwelling older adults could increase the walking speed by 25–50% beyond their comfortable speed (29). However, our subjects could only increase their walking speed by 24.4–30.3%. This was consistent with the results of a study by Dobkin (28), which found that subjects with chronic stroke could only increase their walking speed by 25% beyond their comfortable speed. Inability to increase the walking speed is consistent with the symptomatology of stroke, manifested as muscle weakness and spasticity. Muscle weakness and spasticity are characterized by difficulty in generating appropriately timed and sufficient muscle force to accomplish a given functional task (30).
In addition to walkway length, acceleration and deceleration distances should also be important factors in walking speed performance, as the speed is not constant throughout the walkway length. However, the acceleration and deceleration distances have never been standardized. Clinical studies have reported using 1–2-m (5–10, 13, 14, 20) for acceleration and/or deceleration. Ten clinical studies did not include any mention of the acceleration or deceleration distance used (2, 4, 11, 15–18, 31–33). Investigation of the effect of acceleration and deceleration distances is beyond the scope of the present clinical trial, and this area warrants further study.
Study limitations
This study has several limitations. The quality of gait during walking test may have been overlooked because walking speed is the main focus of the present study. Moreover, our results could not be generalized to the general stroke population because of our subjects’ good functional mobility, which could be reflected by their high Berg Balance Scale and Fugl-Meyer Assessment Lower Extremity Scores (Table I). Furthermore, our results are strictly applicable only to similar environments, i.e. indoors with a flat, smooth floor surface. In addition, sample size was small in the present study. Note that the study design was cross-sectional, and no causal relationships have been established.
In the present study, investigators had to walk closely behind the subjects for safety reasons, which may have influenced the pacing of the subjects. As each subject had to perform the walking tests in the 6 different conditions, there might have been a certain degree of learning and fatigue effects. However, randomization of testing sequences by drawing lots, and use of the 2-min rest periods, were intended to minimize any learning or fatigue effects. Three walkway lengths (5-, 8-, and 10-metres) were used in the present study, as these walkway lengths are commonly used in clinical settings. Whether significant differences in walking speed would be attained if different walkway lengths were chosen remains unknown.
In conclusion, our results clearly show that there is no significant effect of walkway length on either the comfortable or maximum walking speed of subjects with chronic stroke. In the clinic a walkway anywhere from 5- to 10-m long will give consistent results in assessing walking speed. A 5-m walk test with standardized acceleration and deceleration distances is highly recommended for measuring comfortable and maximum walking speeds in stroke rehabilitation, as it occupies the least space and imposes less stress on subjects.
AcknowledgementS
The authors would like to thank Professor Robert L. Kane, University of Minnesota School of Public Health, for his valuable guidance and advice in conducting clinical research, and Dr Raymond C. K. Chung and Mr Brian Choi for their statistical advice. The authors would also like to thank the Community Rehabilitation Network for help in recruiting subjects with stroke.
This study was supported by a grant from the Hong Kong Jockey Club Charities Trust “CADENZA: A Jockey Club Initiative for Seniors” to Shamay S. Ng.
No commercial party having a direct financial interest in the results of the research supporting this article has or will confer a benefit upon the authors or upon any organization with which the authors are associated.
REFERENCES

