Katharine Scrivener, BASc, PT1,2, Catherine Sherrington, PhD2 and Karl Schurr, MASc, PT1
From the 1Bankstown-Lidcombe Hospital and 2The George Institute for Global Health, The University of Sydney, Sydney, Australia
Katharine Scrivener, BASc, PT1,2, Catherine Sherrington, PhD2 and Karl Schurr, MASc, PT1
From the 1Bankstown-Lidcombe Hospital and 2The George Institute for Global Health, The University of Sydney, Sydney, Australia
OBJECTIVE: To describe the dose of lower limb exercise completed during admission to a stroke unit, establish predictors of dose and explore the relationship between dose and walking outcomes.
DESIGN: Inception cohort study.
PARTICIPANTS: Two hundred consecutively-admitted people with stroke.
METHODS: Repetitions of exercise completed throughout the admission were tallied. Possible predictors of exercise dose were recorded within 48 h of admission. Walking velocity was assessed at the beginning and end of the hospital stay.
RESULTS: Data were available for 191 (96%) participants on discharge. The mean daily dose of lower limb exercise was 288 repetitions (standard deviation (SD) 242), the variability in dose was best explained by age and disability level. The mean improvement in walking velocity was 0.43m/s (SD 0.46), 26% of variability in walking improvement was explained by exercise repetitions and 29% was explained by a multivariable model including significant contributions from exercise repetitions (p < 0.01) and age (p = 0.03). After controlling for other factors, for every 100 daily repetitions of lower limb exercise there was an additional change in walking velocity of 0.08m/s (95% CI 0.05 to 0.11, p < 0.01).
CONCLUSION: Exercise dose in a stroke unit is variable and can be predicted by age and disability. Increased exercise dose is associated with improved mobility outcomes.
Key words: stroke; walking; exercise; dose; rehabilitation.
J Rehabil Med 2012; 44: 00–00
Correspondence address: Ms Katharine Scrivener, The George Institute of Global Health, The University of Sydney, PO Box M201, Missenden Road, NSW, Australia, 2050. E-mail: katharine.scrivener@sswahs.nsw.gov.au
Submitted January 31, 2012; accepted May 22, 2012
INTRODUCTION
Many stroke survivors do not regain the ability to walk (1). For those who cannot walk in the first month after stroke, 60% who have participated in rehabilitation and 39% of those managed in an acute unit will have regained the ability to walk by 3 months (1). Faster walking is associated with improved community participation and quality of life in stroke survivors (2). Unfortunately stroke survivors who regain the ability to walk typically walk slowly, at speeds from 0.3 to 0.8 m/s (3–6).
Physiotherapy intervention can improve mobility outcomes after stroke (7–9). Systematic reviews have shown a small but favorable effect of more intense therapy after stroke (9–12). The pooled effect of trials of more intense physiotherapy equates to a 5% improvement in activity of daily living performance as measured by the Barthel Index and an improvement in walking performance of 0.19 standard deviation (SD) units (95% CI 0.01 to 0.36, p = 0.02). A systematic review investigating the impact of more intense physiotherapy found that the difference between the low and high intensity groups had a mean of only 16 h of exercise over the first six months post stroke (10). It is possible that larger differences in outcomes would be seen if there was a greater difference between lower and higher intensity groups.
Previous trials of therapy intensity after stroke have measured dose of exercise as hours of therapy. However, total therapy time is unlikely to be an accurate measure of the dose of exercise and/or practice completed by stroke survivors during therapy sessions (13). Observational studies have shown that rehabilitation participants spend as little as 45% of their time in therapy doing activities related to their recovery (14). In a recent study we observed that exercise repetitions could vary between people from 4 to 369 repetitions in a 30-min period (15). Therefore, a more accurate way of measuring does of exercise may be to count repetitions of exercises performed. Several descriptive studies have now measured exercise dose by counting repetitions of exercise (16–19). To assist in recording exercise dose we have developed and validated a simple method for patients to count their own exercise repetitions in an inpatient therapy setting (15).
The aim of this study was to document the dose of exercise that stroke survivors performed throughout their inpatient stay on a comprehensive stroke unit. We also sought to identify predictors of daily exercise dose and to explore the relationship between dose of exercise and mobility improvement.
The research questions were:
• What dose of lower limb exercise do stroke survivors complete during a comprehensive stroke unit stay?
• What are the predictors of exercise dose?
• How does much does walking speed change during a comprehensive stroke unit stay?
• What is the relationship between exercise dose and change in walking speed? Does this relationship vary by initial disability levels?
METHOD
Design
A prospective, inception cohort study was conducted at Bankstown-Lidcombe Hospital (BLH) Stroke Unit in Sydney, Australia. The stroke unit is a 20-bed comprehensive unit that includes all people admitted to the hospital with a diagnosis of stroke. The unit provides both acute care and ongoing rehabilitation. Therapists on the unit use a task-related approach to exercise prescription (20) and aim to maximise dose of exercise undertaken by patients. Tasks trained include sitting, moving from sitting to standing, walking and climbing stairs. Exercise prescription is targeted at the impairments identified and the exercises may include strength training or part and whole practice of those tasks. Specific strategies were utilised to allow opportunities for the very weak stroke survivors to exercise, such as use of a sliding top tilt table. This tilt table enables very weak people to begin to extend their legs against minimal resistance.
The participant’s treating therapist performed all measurements and data collection. Clinical measures of walking ability were collected within 48 h of admission to the unit. Data on the dose of exercise was recorded daily throughout the admission. The walking measures were repeated within the 48 h prior to discharge from the unit. All therapists were trained in the assessment methods, given standard equipment and given feedback regarding assessment techniques by the first author.
The Human Research Ethics Committee of the Sydney South West Area Health Service approved this study on the 13th August 2008. Project number QA2008/049.
Participants
Two hundred people admitted to the stroke unit with a diagnosis of stroke participated in this study. People were included if they were diagnosed with a stroke either via clinical presentation or CT/MRI scan results. All types of stroke were eligible for inclusion, for example ischemic or hemorrhagic stroke. The side and type of stroke was recorded.
All people admitted to the unit during the study period were considered for the study. People were excluded from the study if: stroke was not their primary diagnosis; they were not considered to require physiotherapy intervention during their admission (e.g., those with transient ischemic attacks or very mild strokes); or they were admitted to the unit for palliation.
Measurement
Data on demographics, predictors and initial walking performance were collected by the participants treating therapist within 48 h of admission to the unit. Walking performance was reassessed in the 48 h prior to discharge.
Descriptive data. The type of stroke was documented based on computed tomography (CT)/Magnetic Resonance Imaging (MRI) reporting where available. When unavailable medical notes and/or opinions were sought as to the likely type of stroke.
Dose of exercise. The dose of exercise was calculated by tallying the number of active lower limb exercise repetitions completed by each participant. Repetitions of each exercise were counted and documented each day of the admission. Therapy staff counted the repetitions of exercise in one-to-one sessions. In independent, supervised or group sessions, the stroke survivor counted repetitions themselves, using a hand-held tally counter, if the therapists judged them able to do so accurately. We have previously found that therapists are able to identify patients who are able to accurately count their own repetitions of exercise using a counter (15). For those participants who were unable to accurately count their own exercise repetitions, relatives and/or therapy staff counted exercise repetitions.
Repetitions were counted for each exercise using the following method. For most exercises, a repetition was defined as the number of times the exercise was undertaken. For example one stand up was recorded as one exercise repetition, one step was recorded as a repetition and one active ankle dorsiflexion in strength training. When the participant was attempting to maintain a position (e.g. remain sitting/standing upright) each effortful attempt was recorded as a repetition. When the participant maintained a position for some time (e.g. sat unsupported for 20 min), one repetition was recorded for each minute the position was held for (i.e., 20 repetitions for 20 min of unsupported sitting). Each metre of walking was also considered to be one repetition. When the participant was walking over-ground, he/she completed laps of a track of known distance or the therapist measured the distance with a trundle measurement wheel. When walking on the treadmill distance walked was calculated from the speed and time walked displays on the treadmill.
Each exercise was categorised according to its purpose. The categories included walking, part practice of walking, other task-specific practice and strength training. The treating therapist documented specific details of each exercise. The first author coded each exercise into the broad categories above for data analysis. Any passive exercises that occurred e.g. stretching or passive range of movement were not included in this study.
The number of therapy days was totaled based on the therapists’ recording sheets. As each participant’s length of stay on the unit was different, his/her mean daily number of exercise repetitions was then calculated and this was used in data analysis.
Predictors of mean daily exercise dose. Variables investigated included age (from the medical record), co-morbidity (scored from the history and medical record using the modified Charlston Index designed for use in ischemic stroke (21, 22)), cognition (whether the treating therapist perceived that the participant’s cognitive impairment impacted negatively on the assessment or the first therapy session), disability level (using the modified Rankin Scale, the 7-point scale commonly used in the stroke population (23)). We dichotomised the Rankin scale for data analysis. The first category was a score of 5 meaning the participant was bed bound and unable to transfer even with assistance. The other category included any score less than 5 meaning the participant could walk or transfer with or without assistance.
Walking performance. Admission walking velocity was measured by the 10-m walk test. This test has been shown to have good test-retest and inter-rater reliability in stroke populations (Intraclass Correlation Coefficient 0.87–0.99) (24). The walking test was measured on a 14-m track with the middle 10 m timed. The participant was asked to walk safely at his/her maximal speed. Up to three trials were completed (as the participant tolerated) and the best time was recorded. If the participant was unable to walk for ten m, then his/her velocity was recorded based on the maximal distance he/she was able to walk. If he/she was unable to walk, the velocity was zero. If the participant required physical assistance this was specified. Discharge walking velocity was measured in an identical manner. The change in walking velocity during the admission was then calculated.
Data analysis
Statistical analysis was completed using PASW (formerly SPSS) V18 software. Descriptive statistics were used to describe the population and summarise the amount of exercise completed. Predictors of exercise dose and change in gait speed during admission were investigated using univariable and multivariable linear regression models. In the univariable models to establish predictors of exercise dose the outcome variable was exercise dose measured as mean daily repetitions of lower limb exercise and the predictor variables were age (in years), dichotomised admission Rankin score, co-morbidity, cognitive issues and admission walking velocity. The multivariate model included each of these variables with the exception of walking velocity, which was excluded due to its strong relationship with the dichotomised admission Rankin score. In the univariable models to establish predictors of change in walking velocity from admission to discharge, the outcome variable was change in walking velocity (in m/s) and the predictor variables were age (in years), dichotomised admission Rankin score, co-morbidity, cognitive issues, admission walking velocity and mean exercise repetitions completed each day (expressed in hundreds of repetitions for ease of data interpretation). The multivariate model included each of these variables with the exception of walking velocity, which was excluded due to its strong relationship with the dichotomised admission Rankin score. We also used separate multivariable models to investigate if this relationship varied based on disability on admission (measured using the dichotomised scores from the modified Rankin Scale). In the multivariable analysis for participants with a Rankin score of 0–4 (i.e., people who may have been able to walk), we also included admission walking velocity in the model but did not include admission walking velocity in the multivariable analysis for participants with a Rankin score of 5 as these people were unable to walk so the value for admission walking velocity would be zero for all participants.
RESULTS
Flow of participants through the study
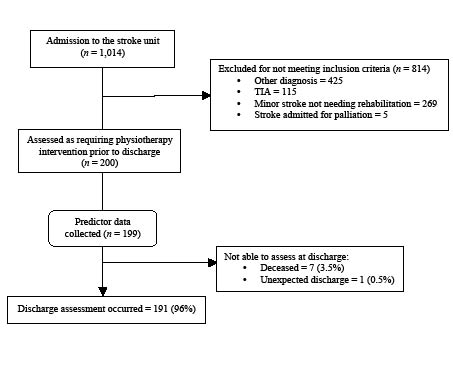
Of the 1,014 people admitted to the stroke unit between February 2008 and June 2010, 200 were included in the study (Fig. 1). Most people excluded had other medical conditions. All predictor data were collected for 199 participants. Seven participants died during their stay on the stroke unit. Discharge data were available for all except one (99%) of the survivors – this person was discharged unexpectedly and measurement did not occur. Consequently data were available for analysis for 191 stroke survivors.
Fig. 1. Flow of participants through the study. TIA: transient ischaemic attack.
Characteristics of participants
The characteristics of the 200 participants on admission are detailed in Table I. The average age of participants was 76 years (SD = 12.5). There were 80 participants who had left hemispheric ischemic strokes and 80 right. Two participants had bilateral strokes. There were 23 participants with hemorrhagic strokes and 15 participants with cerebellar or brainstem strokes. Most participants were significantly disabled on admission. The mean modified Rankin Scale (mRS) was 4.2 (SD 0.8). A score of 4 indicates the need for assistance to transfer or walk and help with all daily activities. Furthermore, 40% of participants scored 5 for the mRS, meaning they were bed-bound and needed full nursing care. Approximately half of the participants were identified as having cognitive impairments that impacted on their therapy sessions. The number of therapy days during participants’ stroke unit admissions ranged from 10 to 81 days, with mean of 22.2 (SD 13.1), or approximately 4 weeks.
|
Table I. Demographics of the 200 study participants on admission to the stroke unit |
|
|
Characteristic |
Study population |
|
Age, mean (SD) [range] |
76.2 (12.5) [19–99] |
|
Sex, female, n (%) |
97 (48.5) |
|
Type of stroke, n (%) L hemisphere R hemisphere Haemorrhagic Cerebellar/Brainstem Other |
80 (40) 80 (40) 23 (11.5) 15 (7.5) 2 (1) |
|
Cognitive issues impacted on therapy, yes, n (%) |
101 (50.5) |
|
Disability (modified Rankin Scale), n (%) 2 3 4 5 |
4 (2) 30 (15) 87 (42.5) 79 (39.5) |
|
Co-morbidities (Charlston Index), mean (SD) |
1.7 (2.1) |
|
Mobility on admission, mean (SD) Walking velocity, m/s |
0.18 (0.3)a |
|
a0 m/s used if participant unable to walk. L: left; R: right; SD: standard deviation. |
|
Dose of lower limb exercise
The mean daily dose of lower limb exercise was 288 repetitions (SD 240) with a range from 1 to 1,136 repetitions. Fig. 2 shows the distribution of participants’ mean daily exercise repetitions. The mean total lower limb exercise dose during an admission was 6,770 repetitions (SD 7,596) with a range from 23 to 42,083.
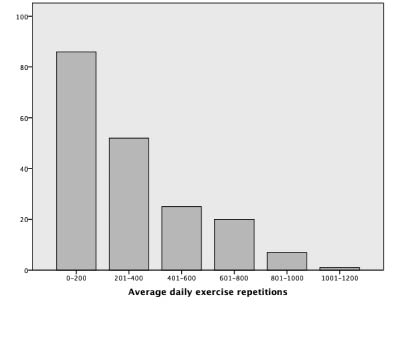
Fig. 2. Number of participants completing each range of daily lower limb exercise repetitions (n = 192).
Throughout their therapy, participants walked a mean of 1,721 m (SD 2,562, range 0 to 16,342 m) either over ground or on a treadmill. They completed 1,209 (SD 1,948, range 0–17,153) repetitions of part practice of walking, 1,801 (SD 2,030, range 0–12,085) task specific repetitions of sitting, sit-to-stand or standing (including moving in standing/balance exercises) and 2,032 (SD 3,114, range 0–22,561) repetitions of strengthening exercises. The mean values were 74 m (SD 103) of walking, 55 (SD 76) exercises practicing part of walking e.g. stepping, 81 (SD 76) task specific exercises and 78 (SD 94) strength exercises on each day of physiotherapy.
In univariable analysis the variability in exercise dose was best explained by age (R2 16%, p < 0.01) and scoring 5 on the modified Rankin Scale on admission (R2 = 21%, p < 0.01, Table II). This indicates the older and more disabled participants completed fewer exercise repetitions on each day. A multivariable model including age, Rankin score, co-morbidity and cognition explained 38% of exercise dose. This model found age (p < 0.01) and Rankin score (p < 0.01) to be independently associated with exercise dose.
|
Table II. Univariable and multivariable analysis of the predictors of mean daily exercise dose (n=191) |
|||
|
Variable |
Effect on daily exercise dose Mean (95% CI) |
p |
R2 % |
|
Univariable |
|||
|
Age in years |
–7.8 (–10.3 to –5.3) |
< 0.01 |
17 |
|
Admission Rankin score of 5 |
–223.1 (–286.2 to –160.1) |
< 0.01 |
21 |
|
Co-morbidity, Charlston Index* |
–11.4 (–28.5 to 5.7) |
0.19 |
0.01 |
|
Cognitive issues noted |
–86.8 (–154.4 to 19.2) |
0.01 |
3 |
|
Admission walking velocity |
231.3 (120.7 to 341.9) |
< 0.01 |
8 |
|
Multivariable |
38 |
||
|
Age in years |
–7.2 (–9.4 to –5.0) |
< 0.01 |
|
|
Admission Rankin score of 5 |
–223.2 (–283.8 to –162.5) |
< 0.01 |
|
|
Co-morbidity, Charlston Index* |
–11.5 (–25.4 to 2.4) |
0.10 |
|
|
Cognitive issues noted |
–11.7 (–70.5 to 47.0) |
0.69 |
|
|
*n=189 CI: confidence interval. |
|||
Walking outcomes
On admission to the stroke unit 86 participants were able to walk. The mean walking velocity for those able to walk was 0.42 m/s (SD 0.32). Only 5 stroke survivors could walk independently, 30 required supervision to walk safely and 35 assistance of one person, 16 required two people to assist. On discharge 152 (80%) stroke survivors were able to walk, 94 could walk independently, 43 survivors required supervision and 15 required physical assistance of 1–2 people. Walking aids were required by 30% of ambulatory participants (10% of participants also used aids pre-stroke). The mean walking velocity on discharge was 0.77 m/s (SD 0.39). The mean improvement in walking velocity during admission was 0.43 m/s (SD 0.46). At discharge participants walked at a mean of 183% of their admission walking velocity. Considering the 191 survivors for whom complete data were available, 65% of the 129 who could not walk on admission had recovered the ability to walk prior to discharge from the unit (even if they required assistance of a person or walking aid).
Univariable linear regression indicated that exercise repetitions was the single variable, which explained the highest proportion of the variability in change in walking speed (R2 26%, p < 0.01). As Table III shows age explained 11% of the variability in change in walking speed and Rankin score explained 7%.
The multivariable model explained 29% of the variability of change in walking velocity. The two variables that made a significant contribution to the model were exercise repetitions (p < 0.01) and age (p = 0.03). As Table III shows, after correcting for other factors, for every hundred repetitions of lower limb exercise completed in a day there was a greater change in walking velocity of 0.08 m/s (95% CI 0.05 to 0.11, p < 0.01).
Multivariable analysis stratified for disability on admission demonstrated that for participants who scored 5 on the modified Rankin Scale on admission, 26% of the variability in change in walking velocity was explained by the model and exercise repetitions (p < 0.01) made the only significant contribution. For participants who scored less than 5 on the modified Rankin Scale on admission, 33% of the variability in change in walking velocity was explained by the model and significant contributions were made by exercise repetitions (p < 0.01) and admission walking velocity (p < 0.01). Interestingly, participants with a faster walking velocity on admission had a smaller improvement in their velocity by discharge. Further details of these models can be seen in Table III.
|
Table III. Variables explaining the variability in change in walking speed during the admission (n=191) |
|||
|
Variable |
Effect on walking velocity Mean (95% CI) |
p |
R2 % |
|
Univariable |
|||
|
Average hundreds of exercise reps each day |
0.10 (0.07 to 0.12) |
< 0.01 |
26 |
|
Age in years |
–0.01 (–0.02 to –0.01) |
< 0.01 |
11 |
|
Admission Rankin score of 5 |
–0.26 (–0.39 to –0.13) |
< 0.01 |
7 |
|
Co-morbidity, Charlston Index* |
–0.03 (–0.07 to 0.00) |
0.05 |
2 |
|
Cognitive issues noted |
–0.09 (–0.22 to 0.04) |
0.17 |
1 |
|
Admission walking velocity |
–0.10 (–0.32 to 0.13) |
0.39 |
0.4 |
|
Multivariable |
29 |
||
|
Average hundreds of exercise reps each day |
0.08 (0.05 to 0.11) |
< 0.01 |
|
|
Age in years |
–0.01 (–0.01 to 0.00) |
0.03 |
|
|
Admission Rankin score of 5 |
–0.08 (–0.22 to 0.07) |
0.29 |
|
|
Co-morbidity, Charlston Index* |
–0.02 (–0.05 to 0.01) |
0.13 |
|
|
Cognitive issues noted |
–0.01 (–0.13 to 0.12) |
0.91 |
|
|
Multivariable |
|||
|
Admission Rankin = 5 |
26 |
||
|
Average hundreds of exercise reps each day |
0.13 (0.06 to 0.19) |
< 0.01 |
|
|
Age in years |
–0.01 (–0.02 to 0.00) |
0.10 |
|
|
Co-morbidity, Charlston Index* |
–0.04 (–0.12 to 0.03) |
0.25 |
|
|
Cognitive issues noted |
–0.07 (–0.30 to 0.16) |
0.53 |
|
|
Admission Rankin < 5 |
33 |
||
|
Average hundreds of exercise reps each day |
0.07 (0.04 to 0.10) |
< 0.01 |
|
|
Age in years |
–0.00 (–0.01 to 0.00) |
0.12 |
|
|
Co-morbidity, Charlston Index* |
–0.03 (–0.06 to 0.00) |
0.08 |
|
|
Cognitive issues noted |
0.06 (–0.08 to 0.19) |
0.41 |
|
|
Admission walking velocity |
–0.42 (–0.61 to –0.24) |
< 0.01 |
|
|
*n=189. CI: confidence interval. |
|||
DISCUSSION
This study is the first inception cohort study to describe the amount of lower limb exercise completed in hospital after stroke by counting exercise repetitions. This study found that the dose of exercise completed was variable. Some stroke survivors completed over 1,000 lower limb exercises, whilst others averaged one repetition each day of their admission. This variability highlights the need to quantify the dose of therapy in terms of the dose of exercise actually completed rather than days of therapy or time spent in therapy.
The factors that best predicted exercise dose were the stroke survivor’s age and admission disability level. Older and more disabled participants performed less daily exercise despite therapists aiming to offer intense exercise opportunities to all stroke survivors.
This study demonstrated that the walking speed improved by a mean of 0.43 m/s during a stay on a comprehensive stroke unit. We found a relationship between daily exercise dose and improvement in walking speed. Daily exercise dose was the single variable that explained the greatest proportion of variability in change in walking speed during the hospital stay. It explained more than twice as much of the variability as the next best model. The relationship between dose and outcomes was similar despite the stroke survivor’s initial level of disability.
The strength of this study was our observation of 200 stroke survivors throughout their inpatient hospital admission. We had minimal loss to follow-up with data collected for 99% of survivors. The comprehensive stroke unit also allows all stroke survivors to undertake rehabilitation without any prejudgment of their potential outcomes from the medical or allied health professionals. Thus we were able to capture data on a true population of stroke survivors and describe their ability to participate in therapy.
A limitation of the study was the measure of cognition used, which was based on therapist impressions. A formal scale may have been more accurate in detecting more subtle cognitive impairment. The study followed participants until discharge from hospital rather than documenting outcomes at a designated time point, e.g. 6 months. This approach enabled us to reassess 99% of participants but means that results can’t be generalised past the inpatient rehabilitation phase.
In our analyses we calculated the dose of lower limb exercises as repetitions. This required us to make judgments regarding what constitutes an exercise repetition. One sit-to-stand is not necessarily equivalent in work to one metre of walking. It has been argued that a better measure of training intensity would be energy expenditure (25), however this is not feasible in the clinical setting. Despite the limitations of counting exercise repetitions, we suggest this to be a more accurate measure of work completed than the commonly used method of using time in therapy to estimate dose of exercise.
Caution needs to be taken when interpreting the relationship between dose and outcomes, as this was an observational study not a randomised controlled trial. As such, confounding factors may impact on the relationship between dose and outcome. In data analysis we have controlled for confounding factors where possible. However, there is a possibility that we have not fully controlled for confounding factors.
This study demonstrated the feasibility of recording the dose of all lower limb exercise undertaken during inpatient stroke therapy. Therefore this approach can be used in future trials to more accurately document the exact amount of exercise stroke survivors complete. Previous studies have recorded repetitions of exercise in order to quantify the intensity of outpatient physiotherapy and occupational therapy sessions after stroke (16, 17, 19). We previously counted repetitions of a dose of a single exercise in a study of the effect of an additional weight-bearing exercise on walking outcomes (18).
In conclusion, the amount of exercise completed on a comprehensive stroke unit was variable and was best predicted by stroke survivors’ age and disability level. A relationship between exercise dose and improvement in mobility was found. Randomised trials are required to further investigate the link between additional exercise dosage and mobility outcome.
Acknowledgements
This study was supported by a grant (number 07-08/007) from the Ingham’s Health Research Institute. C Sherrington received salary support from the Australian National Health and Medical Research Council.
Dharani Khandasamy and Angela Vratsistas assisted with data collation and entry. The physiotherapy staff and students on the stroke unit diligently assisted with data collection.
REFERENCES

