Jean-François Lemay, MSc, PT1,2 and Sylvie Nadeau, PhD, PT1,2
From the 1Laboratoire de pathokinésiologie, Centre de recherche interdisciplinaire en réadaptation (CRIR), Institut de réadaptation Gingras-Lindsay de Montréal (IRGLM) and 2École de réadaptation, Université de Montréal, Montréal, Canada
OBJECTIVES: The aim of this study was to investigate the concurrent validity of the Smart Balance Master (SBM) tests in individuals with incomplete spinal cord injury.
DESIGN: Correlational study.
SUBJECTS: A total of 32 individuals with an American Spinal Injury Association Impairment Scale D spinal cord injury able to walk 10 m independently, with or without walking assistive devices.
METHODS: Outcome measures obtained from static and dynamic balance tests while standing using the SBM were compared to data obtained from the Berg Balance Scale (BBS) (14 items).
RESULTS: No difference in performance between paraplegic and tetraplegic subjects was noted in the SBM tests. No ceiling effect was apparent in the SBM tests. The highest levels of association with the BBS was found for the limits of stability test (–0.416 < R < –0.752, p ≤ 0.05). The limits of stability test also correlated significantly with the majority of the other SBM tests and, except for the weight-shifting test, was completed by all but two participants.
CONCLUSION: The limits of stability test of the SBM system appears to be useful for assessing dynamic standing-balance ability in spinal cord injury subjects and could potentially be used to complement the BBS.
Key words: postural balance; evaluation; paraplegia; tetraplegia; rehabilitation; validity; walking.
J Rehabil Med 2012: 44: 00–00
Correspondence address: Jean-François Lemay, MSc, PT, Institut de réadaptation Gingras-Lindsay de Montréal, 6300 Darlington, Montreal, Quebec, H3S 2J4 Canada. E-mail: jf.lemay@umontreal.ca
Submitted May 27, 2011; accepted August 10, 2012
Introduction
Balance is a central component for safe, optimal standing and walking functions. In fact, standing balance has been reported as one of the major determinants of walking in a spinal cord injury (SCI) population (1). Moreover, recent studies show that clinical measures of standing balance, such as the Berg Balance Scale (BBS) (2), correlate well with various walking aspects (speed, endurance and use of assistive devices) (3, 4). The BBS is a well-known evaluation providing clinicians with a simple way to follow clients’ improvement and identify situations that may be unsafe. Its validity for people with SCI was investigated recently and found to be satisfactory since it is well suited to walking function (3–5) and also seems promising to discriminate between the performance of people with tetraplegia and those with paraplegia who use different strategies to maintain their balance (4). The main lacuna of the BBS is its ceiling effect. The BBS has also been unable to predict falls in this population and has yielded little information as to what could potentially be the underlying causes for the balance difficulties observed (4).
Balance can also be assessed by recording the behavior of the center of gravity (COG) or center of pressure (COP) during static and dynamic tasks (6, 7). Assessment of weight-shifting ability in various directions provides useful quantitative information that can be used as an outcome measure (8, 9). The Smart Balance Master (SBM) (NeuroCom International Inc., Clackamas, OR, USA) uses a force platform to locate the COG and provides numerous tasks known to challenge balance. It has been used with populations presenting with neurological deficits and no ceiling or floor effect has been reported with it (10–13). However, it remains to be known whether this instrument is appropriate for quantifying balance ability in people with SCI. If so, it could potentially complement the BBS by providing information on parameters useful for interpreting and comparing balance characteristics of people with SCI. Quantification of the static and dynamic balance characteristics of this population is becoming critical since nowadays many individuals with a SCI lesion recover some ability to walk in the community but face a certain risk of falling (14, 15).
The purpose of this study was therefore to determine whether SBM tests constitute a valid and complementary balance assessment for people with an American Spinal Injury Association Impairment Scale (AIS D) (16) SCI. The objectives were to assess the level of association between the BBS, walking speed and SBM tests; to identify the most valuable test of the SBM for a SCI population; to determine the correlations between the various tests of the SBM; and lastly, to verify whether SBM scores for paraplegia and tetraplegia differ, as was suggested with the BBS (4).
Methods
Participants and setting
Thirty-two individuals with SCI (25 men, 7 women) were recruited on a volunteer basis from the inpatient population of the SCI rehabilitation unit of the Institut de réadaptation Gingras-Lindsay de Montréal (Table I). Potential participants were first identified by treating therapists according to the following inclusion criteria: adults with an AIS D SCI lesion of either traumatic or non-traumatic etiology able to walk independently for 10 m with or without upper extremity assistive devices. Individuals who had other concomitant neurological conditions in addition to the SCI or walking difficulties prior to the SCI were excluded from the study. Demographic information including age, height and weight, as well as information about neurological status, such as the type and time of injury, level of lesion, AIS level, lower extremity motor score (LEMS), self-chosen walking speed for 10 m (10MWT) and the presence of any relevant associated conditions, were gathered from the subject’s chart. Table I summarizes subjects’ characteristics. Ethics approval was obtained from the research center’s ethics committee. Consent was obtained after the subject had read and understood the information about the research objectives and procedure.
|
Table I. Descriptive statistics of subject characteristics and clinical evaluations (n = 32) |
||
|
Variables |
Mean (SD) |
Range |
|
Age, years |
47.9 (12.8) |
20–75 |
|
Weight, kg |
78.5 (20.1) |
42–130 |
|
Height, cm |
173.0 (9.2) |
152–188 |
|
Time post lesion, days |
77.2 (44.3) |
28–214 |
|
LEMS |
42.2 (5.8) |
29–50 |
|
Paraplegia (n = 15) |
40.2 (6.1) |
29–50 |
|
Tetraplegia (n = 17) |
44.2 (4.8) |
37–50 |
|
BBS |
47.9 (10.7) |
17–56 |
|
Paraplegia (n = 15) |
44.8 (13.0) |
17–56 |
|
Tetraplegia (n = 17) |
50.7 (7.5) |
31–56 |
|
10MWT (ms–1) |
0.81 (0.34) |
0.08–1.43 |
|
Paraplegia (n = 15) |
0.73 (0.32) |
0.08–1.35 |
|
Tetraplegia (n = 17) |
0.87 (0.34) |
0.34–1.43 |
|
|
|
n |
|
Sex (male/female) |
|
25/7 |
|
Neurological level (paraplegia/tetraplegia) |
|
15/17 |
|
Level of injury (cervical/thoracic/lumbar) |
|
17/10/5 |
|
Type of injury (traumatic/non-traumatic) |
|
21/11 |
|
Spinal surgery (yes/no) |
|
27/5 |
|
SD: standard deviation; LEMS: lower extremity motor score; BBS: Berg Balance Scale; 10MWT: 10-m walk test. |
||
Procedure
A physical therapist with 7 years of experience in the field of SCI conducted all the assessments. She started with the BBS and then assessed the SBM. These evaluations were usually performed in a single session lasting approximately 1 h. Subjects were allowed to rest as needed to avoid fatigue. If a patient was not able to complete all the evaluations the same day due to time constraints or fatigue, the rest of the assessment was done the next day. The participants were reassessed in the course of rehabilitation if their walking status improved so that they could walk with a less cumbersome assistive device (e.g., a cane instead of a walker) or if they progressed to walking with no device. Three participants were reassessed. The evaluation process ended when a patient was discharged from the institution.
Outcome measures
The BBS is a clinical measure of balance consisting of 14 tasks testing both static and dynamic balance (2). Each task is graded on a 5-point ordinal scale and then summated to a possible maximal score of 56. Scoring is based on the ability to meet certain time or distance requirements and to perform the items independently. Subjects wore their usual shoes and orthotics if necessary during testing but were not allowed to use their walking assistive device.
The SBM is a rehabilitation device designed to evaluate balance abilities during stance. It consists of a pair of force platforms used to locate the position and behavior of the COG. An eye-level adjusted screen displays the subject’s COG as well as the evaluation task. Various tests can be done and analysis is supplied by the system. The subject did not wear shoes during the evaluation and his/her feet were aligned on the platform’s grid according to the subject’s height, as recommended in the SBM instruction manual. The use of a walking assistive device was not allowed. To ensure safety, subjects wore a harness during the evaluation (17). All the static and dynamic tests of the SBM used in this study are cited as relevant tests in the literature and were selected to assess the visual contribution to static balance (static tests with eyes open and closed) and the participants’ ability to voluntarily move their COG using visual feedback (limits of stability test (LOS), dynamic weight-shifting tests) (10–12, 18).
For the static tests, participants were requested to stand still for 20 s on the platform, keeping their eyes open and then closed. Each test was done 3 times and the sway areas, expressed as a percentage of LOS, were averaged. The LOS represents the area over which the participant’s COG can be moved safely on a standardized base of support (19).
For the LOS tests, 8 targets positioned at 75% of the participant’s theoretical LOS were subsequently highlighted on the screen. Participants could reach the various targets by moving their COG anteriorly, posteriorly, to the left and to the right, as well as in between these directions. Participants were asked to reach the highlighted target as fast as possible and to hold that position. Movement time (MT) (expressed in seconds), representing the time taken to reach the target and hold that position (8 s being the maximum, with a shorter time representing better performance) and path sway (PS) (% of maximal area), representing the distance traveled by the participant (100% being the shortest distance possible and the best score), were averaged over the 8 directions.
The dynamic weight-shifting tests consist of forward/backward (F/B) and medial/lateral (M/L) tests. The participant is asked to follow an on-screen target with an icon representing his/her COG. The target moves alternately between two bars situated at the person’s 50% theoretical LOS. The test is done at 3 different speeds, the target taking 3, 2 and then 1 s to reach each bar. Absolute error, expressed as a percentage of LOS, was computed following previously published instructions (10, 12, 18). The greater the value, the worse the participant’s performance.
Statistical analysis
All data were analyzed using the Statistical Package for Social Science for Windows (SPSS), version 13.0 (Chicago, IL). The normality of the distribution was assessed with the Kolmogorov-Smirnov test. A descriptive analysis (mean, SD) and a correlative analysis were performed for all balance tests. For the latter, Spearman’s rho (Rs) was used for nonparametric data and Pearson’s product-moment correlation for parametric data. Correlation coefficients were interpreted as good to excellent when > 0.75 (20). A correlation matrix was performed on the various SBM tests to explore relationships between these tests. Differences in the performance of paraplegic and tetraplegic participants were explored using t-tests for normally distributed data and Wilcoxon tests for non-normally distributed data. Levene’s test was used to compare the variance between the groups. Participants unable to complete a test were treated as missing and analyses were conducted on available data, which could potentially inflate the risk of a type II error. For all analyses, an α level of 0.05 was regarded as significant. We did not adjust for multiple comparisons.
Results
Subjects’ characteristics and descriptive clinical data
The LEMS trended towards higher scores for tetraplegic participants than for paraplegic participants (44 vs. 40; p = 0.052). Otherwise, no difference was revealed between the paraplegic and tetraplegic participants in terms of demographic data or the BBS.
Results for some of the SBM tests were unavailable as a result of an inability to maintain balance during the entire duration of the test or due to very poor performance. Thus, only the static eyes-open test was completed by all 32 participants. The LOS test (2 subjects), the M/L and the F/B weight-shifting tests in 3 and 2 s (2 subjects), the static eyes-closed test (3 subjects), and the M/L and the F/B weight-shifting test in 1 s (7 subjects) did not yield results for all participants.
Smart Balance Master descriptive data
Table II shows the descriptive data for the tests performed on the SBM system for the entire group (all participants who could complete the tests) and for the paraplegic and tetraplegic participants. Almost all parameters were abnormally distributed except for some weight-shifting tests (F/B-3s, M/L-2s and M/L-1s).
|
Table II. Descriptive data of the group and sub-groups for the Smart Balance Master (SBM) |
||||
|
Test |
Variable |
n |
Mean (SD) |
Range |
|
Static |
Eyes open, % LOS |
32 |
0.24 (0.34) |
0.04–1.96 |
|
Paraplegica |
15 |
0.30 (0.49) |
0.04–1.96 |
|
|
Tetraplegic |
17 |
0.17 (0.12) |
0.06–0.49 |
|
|
Eyes closed, % LOS |
29 |
0.89 (0.78) |
0.07–2.82 |
|
|
Paraplegic |
13 |
1.13 (1.03) |
0.07–2.82 |
|
|
Tetraplegic |
16 |
0.70 (0.44) |
0.21–1.70 |
|
|
Limits of stability |
MT(s) |
31 |
4.77 (1.49) |
2.53–8.0 |
|
Paraplegic |
14 |
4.37 (1.31) |
2.7–7.4 |
|
|
Tetraplegic |
17 |
5.07 (1.59) |
2.53–8.0 |
|
|
PS, % max area |
31 |
294.1 (110.7) |
173.8–575 |
|
|
Paraplegic |
14 |
276.9 (110.5) |
179.1–502.1 |
|
|
Tetraplegic |
17 |
298.8 (116.7) |
173.8–575 |
|
|
Weight–shifting tests |
M/L-3s, % error |
30 |
9.1 (7.2) 9.0 (7.2) 9.1 (7.5) 8.9 (6.6) 9.3 (7.6) 8.4 (5.8) 9.8 (7.8) 10.6 (7.9) 9.1 (8.0) 14.8 (9.9) 15.9 (9.3) 13.9 (10.4) 10.8 (10.1) 8.6 (10.9) 12.4 (9.6) 12.1 (9.0) 10.1 (6.5) 13.4 (10.3) |
0.22–25.8 |
|
Paraplegic |
14 |
0.22–25.8 |
||
|
Tetraplegic |
16 |
1.3–23.9 |
||
|
M/L-2s, % error |
30 |
0.6–25.5 |
||
|
Paraplegic |
14 |
0.6–25.5 |
||
|
Tetraplegic |
16 |
0.71–19.6 |
||
|
M/L-1s, % error |
25 |
0.2–26 |
||
|
Paraplegic |
13 |
0.99–25.8 |
||
|
Tetraplegic |
12 |
0.2–26 |
||
|
F/B-3s, % error |
30 |
0.06–34.8 |
||
|
Paraplegic |
13 |
3.4–30.6 |
||
|
Tetraplegic |
17 |
0.06–34.8 |
||
|
F/B-2s, % error |
30 |
0.21–31.6 |
||
|
Paraplegic |
13 |
0.21–28.4 |
||
|
Tetraplegic |
17 |
0.61–31.6 |
||
|
F/B-1s, % error |
25 |
1.2–31.5 |
||
|
Paraplegic |
10 |
2.3–19.3 |
||
|
Tetraplegic |
15 |
1.2–31.5 |
||
|
aFor all the SBM tests, t-tests or Wilcoxon tests did not depict a significant difference between paraplegic and tetraplegic subjects. SD: standard deviation; LOS: limits of stability; MT: movement time; PS: path sway; F/B: forward/backward weight-shifting test; M/L: medial/lateral weight-shifting test. |
||||
The statistical analysis did not reveal any difference between the groups for all parameters of the SBM, although the mean values were often distinct. The standard deviations revealed great variability between participants for most parameters. For the eyes-open and eyes-closed static tests, paraplegic subjects showed a tendency towards a greater range of values than the tetraplegic subjects (0.04–1.96 vs. 0.06–0.49 and 0.07–2.82 vs. 0.21–1.70; Table II). Levene’s test, assessing the homogeneity of variance between the groups, was significant for the eyes-closed static test (p = 0.001) and almost significant for the eyes-open static test (p = 0.082). The percentage of LOS was highest in the eyes-closed condition.
For the LOS test, the tetraplegic participants tended to reach the targets slower than the paraplegic participants (mean MT 5.07s vs. 4.63s). Likewise, the path followed by the COG to reach the various targets was, on average, longer for tetraplegic subjects (mean PS 298.8% vs. 276.9%). However, these differences did not reach the level of significance.
For the weight-shifting tests, the range of values for the M/L tests was greater for paraplegic participants in 2 out of the 3 tests (M/L-3s: 0.22–25.8 (paraplegia) vs.1.3–23.9 (tetraplegia); M/L-2s: 0.6–25.5 vs. 0.71–19.6) when compared to the tetraplegic participants. Conversely, the range of value for the F/B tests was greater for the tetraplegic participants (F/B-3s: 0.06–34.8 vs. 3.4–30.6; F/B-1s: 1.2–31.5 vs. 2.3–19.3). Levene’s test approached significance only for the F/B-1s weight-shifting test (p = 0.065).
Correlational analysis
Table III represents the levels of association between BBS and SBM results. The BBS scores showed a significant negative association with the static tests, LOS test and two tasks of the weight-shifting tests (–0.414 < Rs < –0.729). The highest correlation coefficients were generally observed with the LOS test (–0.613 < Rs < –0.729), followed by the static tests (–0.414 < Rs < –0.444), the F/B-3s and 1s (–0.524 < Rs < –0.590). No association was observed between the M/L weight-shifting tests the F/B-2s test and the BBS scores (Rs < –0.330). Visual inspection of scatter plots revealed a ceiling effect for the BBS (Fig. 1), whereas the SBM data differed between subjects.
|
Table III. Spearman correlation coefficients between Berg Balance Scale (BBS) and Smart Balance Master (SBM) parameters |
||
|
|
SBM |
BBSa |
|
Static tests |
Eyes open |
–0.414* |
|
Eyes closed |
–0.444* |
|
|
LOS |
MT |
–0.729** |
|
PS |
–0.613** |
|
|
Weight–shifting tests |
M/L-3 s |
–0.042 |
|
M/L-2s |
0.058 |
|
|
M/L-1s |
–0.33 |
|
|
F/B-3s |
–0.524** |
|
|
F/B-2s |
–0.107 |
|
|
F/B-1s |
–0.590** |
|
|
*p < 0.05. **p < 0.01. LOS: limits of stability; MT: movement time; PS: path sway; F/B: forward/backward weight-shifting test; M/L: medial/lateral weight-shifting test. |
||
Fig. 1. Scatter plots showing the association between the Berg Balance Scale and the Smart Balance Master tests. In the static eyes-closed test (A), participants maintain quiet standing with the eyes closed. Stability is measured as a percentage of the limits of stability, with a lower value indicating better performance. In the weight-shifting tests, participants shift their weight in a forward/backward direction (B) or in a medial/lateral direction (C) in tune with a moving on-screen target alternating between two bars set at the person’s 50% theoretical limits of stability (LOS). Performance is measured as a percentage of absolute error from these bars, with a lower error percentage representing better performance. In the LOS test, participants reach 8 on-screen targets. Outcome measures of this test include the mean movement time to reach the targets, with a lower time indicating better performance.
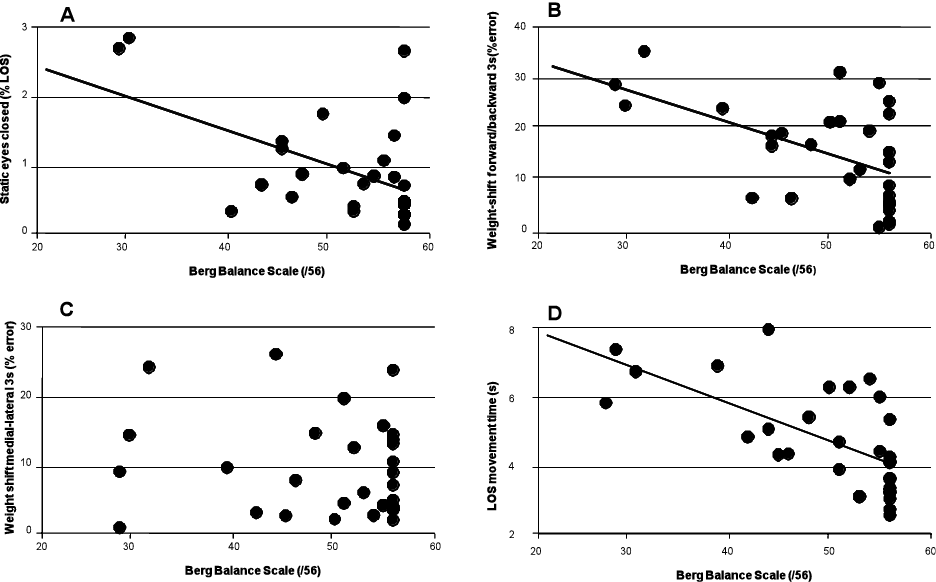
Table IV shows the correlation matrix computed for the SBM tests. The static tests correlated significantly with each other (R = 0.770). The LOS MT was associated significantly with the LOS PS (R = 0.648), the F/B-3s (R = 0.529), the F/B-2s (R = 0.532) and the F/B-1s (R = 0.578). The F/B-2s was significantly correlated with all tests (R ≥ 0.396), except for the M/L-2s (R = 0.066), the M/L-1s (R = 0.281) and the F/B-1s (R = –0.136). The M/L tests displayed the lowest level of correlation with the other SBM tests, the M/L-1s being associated with the LOS PS (R = 0.467), the F/B-3s (R = 0.754) and the F/B-1s (R = 0.597), with the M/L-3s being associated only with the F/B-2s (R = 0.404) and the M/L-2s not being associated with any of the SBM tests (R ≤ 0.280).
|
Table IV. Correlation matrix between parameters of the Smart Balance Master tests (Pearson’s product moment coefficient) |
|||||||||
|
|
EC sway |
LOS MT |
LOS PS |
M/L-3s |
M/L-2s |
M/L-1s |
F/B-3s |
F/B-2s |
F/B-1s |
|
EO sway |
0.770* |
0.244 |
0.158 |
0.184 |
0.044 |
0.008 |
0.065 |
0.396* |
–0.112 |
|
EC sway |
|
0.552** |
0.267 |
0.122 |
0.134 |
0.149 |
0.222 |
0.523** |
–0.050 |
|
LOS MT |
|
|
0.648** |
0.132 |
0.000 |
0.318 |
0.529** |
0.532** |
0.578** |
|
LOS PS |
|
|
|
0.142 |
0.187 |
0.467* |
0.446* |
0.549* |
0.511 |
|
M/L-3s |
|
|
|
|
0.205 |
0.384 |
0.320 |
0.404* |
0.236 |
|
M/L-2s |
|
|
|
|
|
0.280 |
0.009 |
0.066 |
0.036 |
|
M/L-1s |
|
|
|
|
|
|
0.754* |
0.281 |
0.597* |
|
F/B-3s |
|
|
|
|
|
|
|
0.403* |
0.558* |
|
F/B-2s |
|
|
|
|
|
|
|
|
–0.136 |
|
*p < 0.05, ** p < 0.01. EO: eyes open; EC: eyes closed; LOS: limits of stability test; MT: movement time; PS: path sway; M/L: medial/lateral weight-shifting test; F/B: forward/backward weight-shifting test. |
|||||||||
Discussion
This study is the first to use the SBM to assess standing balance in people with SCI. The concurrent validity of the SBM tests was assessed by establishing levels of association with the BBS. Many tests showed significant correlation with the BBS, the parameters derived from the LOS test showing the strongest associations overall. Similar results between the BBS, walking speed and the LOS test have already been reported in the literature for a stroke population (10). Moreover, as opposed to other SBM tests such as the weight-shifting tests, all but one participant completed the LOS test, suggesting that this may be well suited for people with a SCI having the characteristics of those assessed in the present study. Overall, the findings suggest that this particular test (LOS) could be a powerful adjunct to the clinical assessment of balance with the BBS.
The associations between the eyes-open and eyes-closed static tests of the SBM and the BBS, albeit significant, are somewhat low in comparison to the LOS, as revealed in Fig. 1 A and B. Moreover, the graphs produced reveal a greater dispersion than for the LOS test. Inferences of the balance and walking performance from these tests may therefore be limited for people already walking independently with or without assistive devices. However, one can argue that the static tests might be useful in assessing SCI individuals who are beginning to assume a standing position; nevertheless, a future study would need to confirm this. Comparison of static test data performed with the eyes open and closed reveals, as expected, that balance tends to decrease when visual information is unavailable. This result replicates previous findings about sensory integration with various clienteles (21).
The weight-shifting tests yielded ambiguous results. With the exception of two of the F/B tasks, the weight-shifting tests did not correlate well with the BBS. The coefficients obtained were especially low for the M/L tests and, at best, moderate for the F/B tests. All tests display equivocal association with the BBS on the graphs. Thus, these tests were generally unable to segregate individuals according to walking speed or balance level as measured by the BBS. Moreover, the weight-shifting tests, particularly the M/L tests, tended not to be correlated with the other SBM tests. These results contrast with those of Liston et al. (10) obtained for a stroke population, which revealed a significant association among most of those tests. Following their study conducted in a stroke population, Chien et al. (12) recommended to further explore the metrological properties of the weight-shifting tests before implementing them in the clinical setting. Finally, shifting the center of gravity in tune with a moving target in a F/B or M/L direction at various speeds turns out to be a complex and demanding task for a significant number of our participants, as shown by the missing data for all these tests (2 to 7/32 depending on the test; 6.25 to 21.9%). Therefore, the level of association between these tests should be interpreted cautiously. Although the ability to control movement of the COG in multiple directions is crucial for adequate standing balance, what specific aspect that the balance weight-shifting tests assess in a SCI population has yet to be determined. However, it seems that these tests are able to detect a difference between subjects with different levels of balance, which is promising.
The SBM did not show the same limit for the ceiling effect as reported for the BBS. In fact, 37.5% (12/32) of patients in this sample reached the maximum possible score on the BBS (56/56). According to Mao et al. (22), this percentage represents a significant ceiling effect. Therefore, for SCI people having a maximal score on the BBS, the SBM tests (i.e., primarily the LOS tests), would have been an appropriate alternative.
Although significant associations were found between the SBM tests and the BBS scores, the level was not high, revealing differences between these two types of assessment. For example, the tests performed on the SBM require a static foot placement standardized according to the subject’s height. In contrast, the BBS is composed of multiple static and dynamic tasks using various base of support dimensions (unipodal, tandem) as well as foot movements (turning around, stepping). These BBS items thus evaluate a wider range of balance tasks than the SBM. Hence, since the two tests are not highly correlated, the specific usefulness of each of these assessments in revealing standing differences among SCI patients needs to be demonstrated. In posturography, many variables such as COG and COP displacements or velocity are used to characterize balance performance in quiet standing (23, 24). The SBM tests entered in this category of tests where participants are asked to keep their feet immobile. These tests might be less valid for assessing standing balance in a dynamic situation such as gait, where positioning of the feet is constantly adjusted to meet the environmental demand and the body movements. New models of dynamic standing balance such as those presented recently by Duclos et al. (25) might bring additional ways to determine balance abilities of a person after a SCI during more dynamic tasks.
The BBS seems to show a certain capacity to discriminate between paraplegic and tetraplegic subjects based on their performance in the 14 tasks, as pointed out by Lemay & Nadeau (4). Paraplegic subjects seemed to struggle equally among the various tasks, while tetraplegic subject scores showed more the progressive difficulties of the BBS tasks. The SBM tests also seem to yield different patterns for paraplegic and tetraplegic participants, mainly in the static and LOS tests. However, the range of inter-subject variation, which was very large in the paraplegic group, prevented us from obtaining significant findings. The ability of the SBM and the BBS to distinguish between the performances of these two groups of individuals therefore still needs to be explored.
Limits of this study
It should be noted that two versions of the SBM are available on the market, each providing its own set of parameters. The version used in this study characterizes performance in the LOS test in terms of MT, PS and distance error. In the newest version, performance is measured rather in terms of reaction time, movement velocity, maximal and end-point excursion, and directional control. It is therefore possible that our results obtained with the first version could not be extrapolated to the latest version of the software. One other important limitation is that our study did not assess the test-retest reliability of the SBM tests, which could have changed some of our interpretations of the best SBM tests. A correction for multiple comparisons (e.g., Bonferroni’s) was not applied in the present study. Thus, we might have concluded to a relationship when there was no true relationship (type I error). The correlation showing values near the threshold of significance might thus be interpreted with caution. Participants unable to complete a test were treated as missing and analyses were conducted on available data which could potentially inflate the risk of a type II error.
Conclusion
Overall, the LOS test of the SBM is a relevant balance evaluation for people with AIS D SCI and should be considered as a complement to the BBS. Further studies are needed to identify balance tests that are more able to discriminate between the performance of paraplegic and tetraplegic individuals.
Acknowledgments
The project was supported by funding from the Ordre professionnel de la physiothérapie du Québec and the CIHR Multidisciplinary Team in Locomotor Rehabilitation after Spinal Cord Injury and Stroke. J.-F. Lemay holds a scholarship from the Fonds de la recherche du Québec en Santé (FRQS) and S. Nadeau has a senior scientist salary from the FRQS. The authors thank Isabelle Robidoux and Catherine Dansereau for their assistance throughout the project.
References

