Paula W. Rushton, PhD1, William C. Miller, PhD1,2, R. Lee Kirby, MD3, and Janice J. Eng, PhD1,2,4 From the 1Rehabilitation Sciences Graduate Program, University of British Columbia, 2G F Strong Rehabilitation Centre, Vancouver, 3Division of Physical Medicine and Rehabilitation, Dalhousie University, Halifax and 4Department of Physical Therapy, Faculty of Medicine, University of British Columbia, Vancouver, Canada
OBJECTIVE: To evaluate the measurement properties of the Wheelchair Use Confidence Scale for manual wheelchair users version 2.1 (WheelCon-M 2.1).
DESIGN: Cohort study.
PARTICIPANTS: Volunteer sample of 83 community-dwelling, experienced manual wheelchair users.
METHODS: Participants completed the WheelCon-M 2.1 twice to assess retest reliability. Validity was assessed by evaluating hypothesized relationships between the WheelCon-M 2.1 and relevant variables. Responsiveness was assessed using the standard error of measurement (SEM) and smallest real difference (SRD).
RESULTS: The median (interquartile range) WheelCon-M 2.1 score was 84.6 (71.3–92.0) of a possible 0–100. The one-week retest intraclass correlation coefficient was 0.84 with 95% bias-corrected and accelerated confidence intervals of 0.77–0.90. Cronbach’s alpha was 0.92. Correlations ranging from rs = –0.19 (p = 0.780) to rs = 0.58 (p < 0.001) were found between the WheelCon-M 2.1 and other relevant outcome measures with all correlations being statistically significant except for age (p = 0.780) and social support (p = 0.057). A statistically significant difference was not found between the sexes (p = 0.140). The SEM and SRM were 5.9 and 16.4, respectively.
CONCLUSIONS: WheelCon-M 2.1 has high internal consistency, strong retest reliability, and support for concurrent validity, construct validity and responsiveness. This new test holds promise as a clinical and research tool.
Key words: wheelchairs; self efficacy; outcome assessment (health care); reproducibility of results.
J Rehabil Med 2013; 45: XX–XX
Correspondence address: William C Miller, Rehabilitation Sciences, University of British Columbia, T325 - 2211 Wesbrook Mall, Vancouver, BC, V6T 2B5, Canada. E-mail: billm@mail.ubc.ca
Submitted November 21, 2011; accepted August 10, 2012
INTRODUCTION
Population estimates suggest that the number of people who require a wheelchair for mobility is approximately 65 million worldwide (1). In the United States and in Canada there are approximately 2,702,000 and 155,000 individuals, respectively, who use wheelchairs (2, 3). Adults and older adults account for 90% of the Canadian wheelchair population (3, 4). Given that the number of Canadian adults is projected to double by 2026 (4), the number of people with mobility-related disabilities who need wheelchairs will also likely increase.
Over half of Canadian wheelchair users require assistance with using their wheelchair and with activities of daily living (3). To enable provision of appropriate interventions, it is important to determine the reasons why wheelchair users are having these difficulties. The literature exploring factors affecting wheelchair use is mainly comprised of variables related to the environment and physical attributes of the wheelchair users. These predictive models, however, only account for a modest amount of the variance (5, 6). More information is needed in order to enhance wheelchair users’ independence with their chosen daily activities.
It seems plausible that psychological factors may help to explain variations in wheelchair use. Confidence refers to one’s belief in his or her capabilities to organize and execute the courses of action required to produce given attainments (7). It has been found to be a stronger predictor of behavior than actual skills or abilities (8). Judgments of confidence play a major role in determining whether to perform a behavior, the degree of effort to invest, and the length of time one will persist in a given activity (7). Therefore, it may be that low confidence with wheelchair use might lead to self-imposed restrictions.
Confidence has been identified as an important construct to consider in the areas of wheelchair skills training (9), wheelchair provision (10), and abandonment of assistive technology (11). Importantly, confidence has also been identified as a possible contributor to the gap between the capacity to perform wheelchair skills (what the wheelchair user can do) and the actual performance of wheelchair skills (what the wheelchair user actually does) (12). Recently, we developed an outcome measure designed to assess confidence with manual wheelchair use, the Wheelchair Use Confidence Scale, or WheelCon-M (13). Fliess-Douer et al. (14) have independently done the same.
The objective of this study was to evaluate the measurement properties of the WheelCon-M 2.1. We have previously reported on the development of the tool and its content validity (13). For this study, we hypothesized that the WheelCon-M 2.1 would: (i) have high internal consistency; (ii) have high retest reliability; (iii) have moderate and low correlations with relevant existing measures; (iv) be influenced by sex, age, and wheelchair experience (construct validity); and (v) accurately detect change when it has occurred (responsiveness).
METHODS
Participants
A sample size of 42 individuals was determined to provide sufficient power to assess our a priori hypothesis that the reliability of WheelCon-M 2.1 would exceed an intraclass correlation coefficient (ICC) of 0.8, given an α of 0.05 and a β of 0.80 (15). To test our a priori hypotheses that WheelCon-M 2.1 would have moderate correlations with other relevant variables, we determined that, given an α of 0.05 and a β of 0.80, a minimum of 80 participants would be needed (16).
Recruitment and screening
Participants were recruited from Vancouver, British Columbia, Hamilton, Ontario, and Halifax, Nova Scotia, using letters of information sent via clinicians and vendors, as well as advertisements posted in locations frequented by manual wheelchair users. To be included in the study, participants had to be at least 19 years of age, use a manual wheelchair as their primary means of mobility (at least 4 h per day), have at least 6 months of manual wheelchair experience, and live in the community. Participants were excluded if they were unable to read and write in English.
Ethical issues
Ethical approval was obtained by local university or hospital research ethics boards. Each participant provided informed consent.
WheelCon-M 2.1
The WheelCon-M 2.1 is a 63-item self-report questionnaire designed to measure confidence with manual wheelchair use (13). Items were generated using qualitative interviews (version 1.0), items were selected and content validation was conducted using a Delphi survey (version 2.0) (13), and items were refined using a Think Aloud process (version 2.1). WheelCon-M 2.1 has 6 different areas: negotiating the physical environment (33 items), activities performed in the wheelchair (11 items), knowledge and problem solving (6 items), advocacy (4 items), managing social situations (6 items), and managing emotions (3 items). The stem for each item was “As of now, how confident are you …” and individuals rated their confidence level for each item using a 0 (not confident) to 100 (completely confident) response scale. The WheelCon-M 2.1 was scored by summing the ratings for each item and dividing by the total number of items. Total scores range from 0 to 100, with higher scores representing higher confidence. Version 2.1 can be downloaded from the following website: http://millerresearch.osot.ubc.ca/resources/mobility-outcome-tools/.
Data collection
Volunteer participants who met the study inclusion/exclusion criteria were provided with two data collection appointments. At baseline, a demographic questionnaire and the WheelCon-M 2.1 were administered. One week later, the WheelCon-M 2.1 was re-administered to assess retest reliability, followed by 6 measures (described below) in random order. Participants used their own manual wheelchairs for all testing. All research assistants were trained by the primary investigator (PWR).
Internal consistency
Internal consistency was calculated using Cronbach’s α. Stepwise deletion was performed to determine if α changed in the absence of any of the items.
Retest reliability
One-week retest reliability was evaluated using ICC1,1 with 95% confidence intervals (CI), calculated using one-way analysis of variance (ANOVA) (16). In order to provide a more accurate CI with non-normally distributed data, a bootstrap procedure with 1,000 bootstrap replications was conducted and a bias-corrected and accelerated (BCa) CI (17) reported. The Bland-Altman limits of agreement plot was also used to provide a visual assessment of how individual WheelCon-M 2.1 scores varied between baseline and follow-up (18).
Concurrent validity
To assess the concurrent validity of the WheelCon-M 2.1, we explored hypothesized relationships between it and relevant outcome measures.
Wheelchair Skills Test (WST) 4.1. The WST 4.1 is a 32-item objective, performance based evaluation of an individual’s ability to perform various wheelchair skills, ranging from wheeling forward 10 m to ascending/descending curbs and stairs (19). It has demonstrated interrater, intrarater, and retest reliability (20). Version 2.4 has demonstrated concurrent validity with Functional Independence Measure scores (21). Theory supports a positive association between confidence and physical ability (7). Fifty-two percent of the items on the WheelCon-M 2.1 are related to negotiating the physical environment (13).
The Wheelchair Skills Test Questionnaire (WST-Q) 4.1. The WST-Q 4.1 is a semi-structured interview version of the WST 4.1 where the individual is asked whether he/she believes him/herself to be capable of performing specific wheelchair skills and, if so, how he/she would perform the skill (19). WST-Q 4.1 has demonstrated a very high correlation with the WST 4.1 (rs = 0.89) (22).
Barthel Index (BI). The BI is a 10-item self-report measure of one’s level of functional independence related to specific activities of daily living (ADLs) tasks (23). It has demonstrated concurrent validity with the Motricity Index (24) and high inter-rater reliability (25). Functional ability with basic ADLs has been associated with confidence in other areas of mobility (26) and there are many WheelCon-M 2.1 items related to basic ADLs (13).
Life Space Assessment (LSA). The LSA measures frequency and independency of mobility across a continuum of environments through which a person reports moving during the prior 4 weeks (27). Test-retest reliability has been demonstrated and concurrent validity confirmed with the Physical Performance Measure (27). For individuals who have mobility disability, distance travelled increases with wheelchair use (28). We expected confidence with wheelchair use to be associated with distance travelled, as wheelchair users who are more confident may be less likely to worry about wheeling in life spaces farther from home and in unfamiliar environments.
Interpersonal Support Evaluation List (ISEL). The ISEL is a 12-item measure used to assess social support (29). It has demonstrated concurrent validity with the Sense of Support Scale (30). Social support has been positively associated with confidence (31).
Hospital Anxiety and Depression Scale (HADS). The HADS is a 14-item measure of anxiety (7 items) and depression (7 items) (32). It has demonstrated concurrent validity with the Beck Depression Inventory (33) and the State-Trait Anxiety Inventory (34). Theory proposes that if physiological arousal, or anxiety, is interpreted as a sign of vulnerability to poor performance, it can lower confidence. Similarly, a negative mood, or depression, can diminish confidence as it activates thoughts of past failings, rather than accomplishments (7). Both depression and anxiety have been associated with wheelchair use (35, 36).
Based on the above descriptions of relevant outcome measures and their relation to confidence, we hypothesized that the WheelCon-M 2.1 would have: a positive moderate (rs ≥ 0.5) correlation with the WST, WST-Q, BI, and LSA; a positive low (rs ≥ 0.3) correlation with the ISEL; and a negative moderate (rs ≥ 0.5) correlation with the HADS. Associations were calculated using Spearman’s rank correlation coefficients. The strength of the associations was interpreted according to Domholdt’s classification (37).
Construct validity
Demographics and wheelchair use characteristics were captured to describe the sample and to assess construct validity. Given that the preponderance of Canadian wheelchair users are older females and confidence studies in other mobility-related areas have reported that females and older people have lower confidence (38), we hypothesized that men would have higher total WheelCon-M 2.1 scores than women and that there would be an inverse relationship between age and WheelCon-M 2.1 scores. We also hypothesized that there would be a positive moderate correlation between years of wheelchair experience and WheelCon-M 2.1 scores. The Mann-Whitney U test was used to assess the difference between men and women. Spearman’s rank correlation coefficient was used to assess the associations between the WheelCon-M and age and wheelchair experience.
Responsiveness
We measured the minimum change detectable given the measurement error of the WheelCon-M 2.1 at a between-person differences level. The standard error of measurement (SEM) was calculated for groups using SEM = baseline SD ×√1 – test retest ICC (16). The smallest real difference (SRD) was calculated for a single individual using SRD = 1.96 × √2 × SEM (39).
Data analysis
The analyses for specific components of the study have been described above. Descriptive statistics were also used to provide a summary of all variables. The Shapiro-Wilk Test was used to determine the normalcy of the data. WheelCon-M 2.1 values were derived relative to demographic factors to give an indication of how values varied based on these factors. All analyses were completed using SPSS version 16.0, except for the bootstrapping which was completed using Stata version 11. The level of statistical significance was set at p < 0.05.
RESULTS
Participants
Demographic, clinical, and wheelchair-use characteristics of the sample are presented in Table I. The sample of 83 participants had a median (interquartile range [IQR]) age of 50.0 (31.0–60.0) years. Men accounted for 70% of the participants and most of the total sample had a diagnosis of spinal cord injury (60.3%). Our recruitment methods did not allow us to determine participation rates as we did not have access to the data bases used by clinicians and vendors to send out the letters of information.
|
Table I. Demographic, clinical, and wheelchair-use characteristics |
||
|
Demographics |
Values |
WheelCon-M 2.1 Median (IQR) |
|
Age, years, median (IQR) |
50.0 (31.0–60.0) |
84.6 (71.3–92.0) |
|
Sex, % Male (n = 58) Female (n = 25) |
69.9 30.1 |
85.6 (75.9–91.3) 80.7 (56.3–93.2) |
|
Marital status, % Married or common-law (n = 34) Other (n = 49) |
41.0 59.0 |
84.6 (76.4–91.0) 83.9 (69.8–93.4) |
|
Education, % Less than high school (n = 5) High school degree (n = 31) Post-secondary education (n = 47) |
6.0 37.3 56.7 |
63.7 (45.1–86.6) 80.8 (69.6–90.0) 85.6 (76.8–94.1) |
|
Diagnosis, % Spinal cord injury (paraplegia) (n = 36) Spinal cord injury (tetraplegia) (n = 14) Lower extremity amputation (n = 9) Multiple sclerosis (n = 8) Other (n = 16) |
43.4 16.9 10.8 9.6 19.3 |
87.2 (75.7–94.8) 86.5 (74.9–91.5) 63.7 (43.9–92.3) 78.5 (53.4–86.0) 83.8 (71.6–90.0) |
|
Years with diagnosis, median (IQR) |
18.0 (9.0–30.0) |
84.6 (71.3–92.0) |
|
Years using wheelchair, median (IQR) |
13.0 (4.0–28.0) |
84.6 (71.3–92.0) |
|
Wheelchair Propulsion Method, % Two hands (n = 78) Other (n = 5) |
94.0 6.0 |
84.1 (70.3–91.3) 85.2 (81.7–97.0) |
|
WheelCon-M: Wheelchair Use Confidence Scale for manual wheelchair users; SD: standard deviation; IQR: interquartile range. |
||
WheelCon-M 2.1 scores
WheelCon-M 2.1 scores demonstrated a negatively skewed non-normal distribution (Shapiro-Wilk p-value < 0.001). The median (IQR) WheelCon-M 2.1 score was 84.6 (71.3–92.0).
Internal consistency
Cronbach’s α coefficient was 0.92. Scaling using stepwise deletion revealed that α did not change by more than 0.0008 with the exclusion of any item.
Reliability
The 1-week retest ICC was 0.84 (95% BCa CI 0.70–0.92). The Bland-Altman plot (Fig. 1) presented a fairly equal distribution of values above and below the mean difference suggesting no systematic bias in score. The clustering of scores suggests a potential ceiling effect. There were 5 outliers who did not fall between the limits of agreement (14.6 to –16.6), 2 outliers had better and 3 had worse WheelCon-M 2.1 scores.
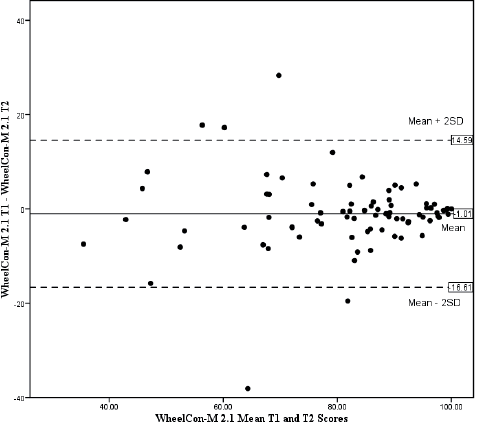
Fig. 1. A Bland-Altman plot of the mean versus the difference in baseline and follow-up Wheelchair Use Confidence Scale for manual wheelchair users version 2.1 (WheelCon-M 2.1) scores. This figure shows a comparison of the WheelCon-M 2.1 at baseline (T1) and one week later at follow-up (T2). The mean difference between the WheelCon-M 2.1 administrations was –1.01 with an upper limit of agreement of 14.6 (mean difference + 2 standard deviations (SD)) and lower limit of agreement of –16.6 (mean difference –2 SD). With 5 outliers, 95% of the differences fell between the 2 SD.
Concurrent validity
All correlations were in the direction hypothesized (Table II) and, apart from the ISEL and age, all correlations were statistically significant. Correlations ranged from rs = –0.19 (p = 0.780) to rs = 0.58 (p < 0.001). Fig. 2 illustrates the positive, moderate correlation between the WheelCon 2.1 and the WST 4.1.
|
Table II. Median scores and correlations for the study measures |
||
|
Study measures (maximum score) and variables |
Median (IQR) |
Correlation (rs) with WheelCon-M 2.1, p-value |
|
WheelCon-M 2.1 (baseline) (/100) |
84.6 (71.3–92.0) |
N/A |
|
Wheelchair Skills Test 4.1 (/100) |
81.0 (71.5–90.0) |
0.52, p < 0.001 |
|
Wheelchair Skills Test – Questionnaire 4.1 (/100) |
84.0 (78.0–93.3) |
0.58, p < 0.001 |
|
Barthel Index (/100) |
75.0 (70.0–80.0) |
0.32, p = 0.004 |
|
Hospital Anxiety and Depression Scale (/21) |
9.0 (6.0–14.3) |
–0.43, p < 0.001 |
|
Interpersonal Support Evaluation List-12 item (/36) |
26.0 (21.0–32.0) |
0.21, p = 0.057 |
|
Life Space Assessment (/120) |
56.3 (40.0–67.5) |
0.38, p < 0.001 |
|
Age |
50.0 (31.0–60.0) |
–0.19, p = 0.780 |
|
Years of wheelchair experience |
13.0 (4.0–28.0) |
0.32, p = 0.003 |
|
IRQ: interquartile range; WheelCon-M 2.1: Wheelchair Use Confidence Scale for manual wheelchair users version 2.1 N/A: not applicable; rs: Spearman’s rank correlation coefficient. |
||
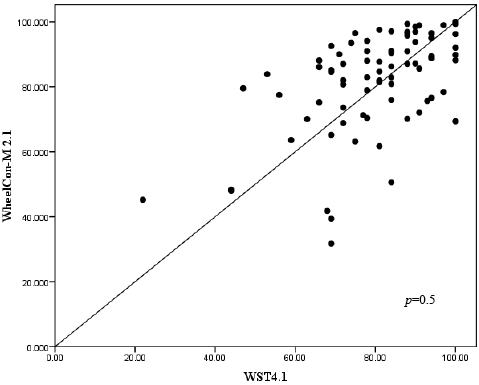
Fig 2. Concurrent validity between the Wheelchair Use Confidence Scale for manual wheelchair users version 2.1 (WheelCon-M 2.1) and the Wheelchair Skills Test Questionnaire version 4.1 (WST-Q 4.1).
Construct validity
Men scored better than women on the WheelCon-M 2.1 (Table I). The difference, however, was not statistically significant (Mann-Whitney U test = 577.5, p = 0.140). An inverse relationship was found between age and WheelCon-M 2.1 scores, but the association was also not statistically significant (rs = –0.19, p = 0.780). A positive, weak correlation was found between wheelchair experience and WheelCon-M 2.1 scores (rs = 0.32, p = 0.003). These unexpected results contradict Bandura’s theory (7) and previous research (38), both of which report that men and younger people have higher confidence than women and older people. For that reason, we conducted a post hoc two-way between-groups analysis of variance test to provide further explanation to this result. This analysis revealed a large statistically significant age × sex interaction (F = 8.90, p = 0.004).
Responsiveness
The SEM was 5.9 and the SRD was 16.4 providing an indication of the minimal change in score that would reflect a meaningful change beyond measurement error for a group of individuals and a single individual respectively.
DISCUSSION
We accomplished our objective of providing evidence about the measurement properties of the WheelCon-M 2.1. It was determined that the WheelCon-M 2.1 has high internal consistency, strong retest reliability, support for concurrent validity, construct validity and responsiveness. Participants in this study were experienced, community dwelling adults ranging in age from 21 to 80 with a variety of diagnoses. Generally, they were quite confident with wheelchair use, scoring a median (IQR) of 84.6 (71.3–92.0) of a possible 0–100 on the WheelCon-M 2.1.
The WheelCon-M 2.1 items had a high degree of internal consistency. An α of 0.92 suggests some item redundancy (40) and it may be possible to reduce the number of items in the future, using Rasch analysis. However, it may be that there are clinically important differences between the items. For example, the confidence required ‘to go up a standard 15 cm-high curb’ is very different from that required ‘to go down such a curb’. Differences between seemingly similar skills were supported by subjects during the development phase of the WheelCon-M, version 1.0 (13).
The WheelCon-M 2.1 ICC of 0.84 for retest reliability was very good (54) but the 95% BCa CI was wide (0.70–0.92), which may be explained by the outliers illustrated in the Bland-Altman plot. One participant’s increase in confidence scores may be explained by her participation in wheelchair skills training during the one-week interval between the testing sessions. Indeed, she stated that her confidence in using the wheelchair had increased as a result of this training. This finding supports preliminary results from Sakakibara et al’s study (41), where confidence with manual wheelchair use in older adults increased with wheelchair skills training. The reasons for the changes in scores for the other four outliers were not apparent based on the data collected.
The clustering of scores at the higher score end of the WheelCon-M 2.1 demonstrated by the Bland-Altman plot was expected given our sample of experienced wheelchair users. As demonstrated in this study, confidence increased with wheelchair experience. We used an experienced sample of participants to increase the likelihood of stability of confidence during the week between tests.
Our results corroborate most of the a priori hypotheses regarding the relationships between the variables used to assess concurrent validity and the WheelCon-M 2.1. The magnitudes of the relationships between the WheelCon-M 2.1 and the WST 4.1 and WST-Q 4.1 were as expected, given that approximately half of the WheelCon-M items involved negotiating the physical environment, the focus of the WST and WST-Q. The other WheelCon-M items involved assessing confidence related to activities, knowledge and problem solving, advocacy, managing social situations, and managing emotions, areas not covered in the WST and WST-Q. However, for the majority of the associations, the strength was less than anticipated. The ceiling effect of the WheelCon-M 2.1 may be one possible reason for these results, however, as described below, other possible explanations exist.
One surprising result was the low (rs = 0.21) correlation found between the WheelCon-M 2.1 and social support. It may be that emotional support in the form of positive reinforcement, may improve the confidence of wheelchair users (7), but physical assistance may have the opposite effect. Independence may be discouraged and more physical assistance than necessary provided for wheelchair users by friends, family, and even strangers. An overabundance of support could limit wheelchair users’ opportunities to build confidence through attempting and practicing the activities of which they are capable. Successes achieved with external assistance carry little efficacy value because they are likely credited to the assistance provided rather than to personal capabilities (7).
A statistically significant difference was not found for sex. Further, a statistically significant difference was not found between age and WheelCon-M 2.1scores. As described earlier, a large statistically significant age × sex interaction was found in post hoc analysis. Therefore, it appears as though our results may be related to statistical differences. Further investigation regarding the predictors of wheelchair confidence is warranted.
The correlation of rs = 0.38 between the WheelCon-M 2.1 and life space mobility was lower than anticipated. Upon reflection, this value may be explained in part by the fact that the frequency scale of the LSA is limited to evaluating the life space levels traveled daily. It does not capture the variety and number of destinations to which an individual travels within a day. Therefore, it could be that individuals with higher wheelchair confidence may be more active within life space levels, a phenomenon that the LSA would not capture.
The SEM of 5.9 and the SRD of 16.4 represent the minimal change in WheelCon-M 2.1 score that reflects a meaningful change beyond measurement error for a group and an individual respectively. While these values allow for important statistical changes to occur post intervention given the 0–100 response scale, the SRD value did not meet Smidt et al’s (42) standard of 10% or less of the possible score range. Further research is required to investigate change using the WheelCon-M 2.1, both statistical change, and most importantly, clinically important change.
Our findings are consistent with those of Fliess-Douer et al. (14) who recently developed a scale for perceived self-efficacy in manual wheeled mobility. Both scales demonstrated support for internal consistency, construct, and concurrent validity. The WheelCon-M has also demonstrated strong retest reliability. Primary differences between the scales are the applicability and generalizability of the results. Specifically, the WheelCon-M is generalizable to a broader base of wheelchair users who were sampled from the general population, whereas Fliess-Douer’s scale was developed specifically for use with individuals with spinal cord injury and evaluated using elite and recreational athletes. In addition, while Fliess-Douer relied on selecting items from previous self-efficacy measures, we used previous measures to inform our process in addition to using an inductive qualitative process consisting of interviews, Delphi, and Think Aloud approaches.
Study limitations
This study had a number of limitations, some of which have already been noted. For instance, the sample consisted of wheelchair users with at least 6 months of experience using a manual wheelchair. Although a stable sample was necessary to evaluate the retest reliability of the WheelCon-M 2.1, this limited the generalizability of the results. A social desirability bias may have been present, with participants seeking to please or impress the researcher, who was nearby while the participants completed the WheelCon-M 2.1. As well, two individuals who participated in the item generation and item selection phases of the WheelCon-M development also participated in this study. However, given this small number and the amount of time between the separate studies, we do not believe that the overlap of the two subjects influenced the results enough to be considered a limitation. The volunteer sample may have also been a limitation to this study and may have influenced the determined properties of the WheelCon-M 2.1, including the relationship between wheelchair confidence and sex and age, as well as the SEM and SRD. Future research regarding predictors of wheelchair confidence and meaningful change is warranted. Finally, there are other characteristics of a good tool, such as cost, time to administer, and extent of training needed, that we did not address in this study.
The development of a new measure is an ongoing and iterative process. Future work is needed to address the study limitations and extend our understanding of the WheelCon-M 2.1. For instance, we see the need to test the measurement properties with new wheelchair users and diagnosis specific samples, to conduct factor analysis using a larger sample, to conduct further responsiveness testing in an intervention study designed to enhance confidence with wheelchair mobility, and to extend the work to powered wheelchair users and caregivers.
Despite the study limitations and the need for further study, the WheelCon-M 2.1 is one of the first measures of confidence with manual wheelchair use to have been rigorously developed and psychometrically tested. Results obtained in this study provide data on the measurement properties of this new measure.
Conclusion
WheelCon-M 2.1 has high internal consistency, strong retest reliability, and support for concurrent validity, construct validity and responsiveness. Although further work is needed, this new test holds promise as a clinical and research tool.
ACKNOWLEDGEMENTS
This study was funded by the Canadian Institutes of Health Research (CGA 86803). Salary/scholarship funds were provided by: the Canadian Institutes of Health Research (PWR, WCM) and the Michael Smith Foundation for Health Research (PWR, JJE).
We thank: Kristine Vaughan (BSc), Amira Tawashy (MSc), Mark Burley (BScOT), and Haley Augustine (MScOT) for their assistance with data collection; Dr. Kathleen Martin-Ginis (PhD) for data collection site support at McMaster University; and Dr. Dan Neal (PhD) for statistical support.
REFERENCES

