Heleen Beckerman, PhD1,4,5, Jiska C. E. Kempen, MSc1,4,5, Dirk L. Knol, PhD2,4,5, Chris H.
Polman, PhD, MD3,5, Gustaaf J. Lankhorst, PhD, MD1 and Vincent de Groot, PhD, MD1,4,5
From the 1Department of Rehabilitation Medicine, 2Department of Epidemiology and Biostatistics, 3Department of
Neurology, VU University Medical Center, 4EMGO Institute for Health and Care Research, VU University and VU
University Medical Center, and 5MS Center Amsterdam, Amsterdam, The Netherlands
OBJECTIVE: To determine the course of daily functioning in patients with multiple sclerosis in the 10 years after their definite diagnosis.
METHODS: A long-term prospective follow-up study including an incidence cohort of 156 patients with multiple sclerosis. Participants were examined systematically, beginning immediately after definite diagnosis, then at the following time-points: 6 months, 1, 2, 3, 6 and 10 years. The various domains of daily functioning were assessed with the Expanded Disability Status Scale, the Functional Independence Measure, and the Medical Outcome Study Short Form-36 (SF-36).
RESULTS: Neurological disability and physical functioning worsened significantly, with a time course dependent on whether a patient had multiple sclerosis of the relapse onset type or non-relapse onset type. Cognitive and social functioning worsened significantly over time, but with the same (accelerated) rate of change in both the RO and NRO groups. Scores on SF-36 mental health, SF-36 role physical, and SF-36 general health changed only slightly.
CONCLUSION: In the first 10 years after definite diagnosis, patients with multiple sclerosis showed a more pronounced decline in physical functioning than in cognitive and social functioning. There was no time-related decline in mental health, social role due to physical limitations, or general health.
Key words: multiple sclerosis; disability; physical functioning; cognitive functioning; longitudinal analyses; prospective cohort study; social functioning; activities and participation.
J Rehabil Med 2012; 00: 00–00
Correspondence address: Heleen Beckerman, Department of Rehabilitation Medicine, VU University Medical Center, PO Box 7057, 1007 MB Amsterdam, The Netherlands. E-mail: h.beckerman@vumc.nl
Submitted December 29, 2011; accepted August 16, 2012
Introduction
Long-term follow-up studies of daily functioning are essential in slowly progressive diseases such as multiple sclerosis (MS), because patient-centred care, treatment planning, programme co-ordination, and the allocation of financial resources are all dependent on the functional assessment of a patient’s physical and cognitive abilities. MS is an inflammatory and degenerative disease of the central nervous system, which affects young and middle-aged people.
A long-term prospective follow-up study, the Functional Prognosis Multiple Sclerosis study (FUPRO-MS), was initiated in the period 1998–2000. The aim of this study was to investigate the functional prognosis of an inception cohort of 156 patients with a definite diagnosis of MS (1). This study yielded important insights into the functioning of patients with early MS. While neurological deficits were relatively minor for most patients immediately after definite diagnosis, 39% already had aberrant social functioning scores, 26% had aberrant physical functioning scores, 9% had aberrant mental health scores, and 25% had aberrant general health scores (1). Over the 3-year course of the study, it became clear that both neurological deficits and physical functioning deteriorated significantly over time. This deterioration was more pronounced and clinically relevant in patients with the non-relapse onset type of MS (NRO), compared with patients with the relapse onset type of MS (RO). Mental health also showed a significant, but not clinically relevant, deterioration over time, and social functioning and general health showed some non-significant effects in this period.
Since a 3-year follow-up of an incident MS cohort is relatively short, largely due to the variable disease course of MS, we extended the cohort follow-up to cover the course of functioning during the later stages of the disease. The objective of this study was to determine both the longitudinal course of functioning and the rate of change simultaneously, in domains including neurological deficits, physical functioning, cognitive and mental functioning, social functioning and general health during the first 10 years following a definite diagnosis of MS.
To control for the possible influence of therapies, the use of disease-modifying drugs (DMD) was included as an explanatory variable, as DMD can have a significant impact on the course of functioning. Although the first-line DMD interferon β-1a (Avonex® or Rebif®), interferon β-1b (Betaferon® or Betaseron®), and/or glatiramer acetate (Copaxone®) have been shown to reduce the number of relapses and to influence brain magnetic resonance imaging (MRI) measures of disease activity, their influence on disease activity when measured with the Expanded Disability Status Scale (EDSS) appears to be limited (2–8). The Strengthening the Reporting of Observational Studies in Epidemiology (STROBE) statement, a guideline for reporting observational studies in epidemiology, was used as a checklist (9).
Methods
Participants and design
In the period 1998–2000, a long-term prospective follow-up study was initiated, with the aim of studying the functional prognosis in an inception cohort of 156 patients with a definite diagnosis of MS (10, 11). Consecutive adult patients were recruited from 5 outpatient neurology clinics. All patients had a recent diagnosis of MS (i.e. less than 6 months). Patients with co-morbid neurological disorders or systemic or malignant neoplastic diseases at baseline were excluded. Medical ethics committees at both the VU University Medical Center and the participating hospitals approved the study protocols.
Participants were systematically examined at baseline, 6 months, 1, 2, 3, 6 and 10 years. At each of the time-points, patients underwent a neurological assessment and completed a number of questionnaires. Most examinations were performed in the participant’s private home and were completed with data from self-reported questionnaires. All patients were free from any exacerbation of MS at the time of assessment. Full details of the FUPRO-MS study design and the initial course of functioning have been reported elsewhere (1, 10–12).
Measurement instruments
The EDSS, the Functional Independence Measure (FIM) and the Medical Outcome Study Short Form-36 (SF-36) were used to assess the domains of neurological deficits, physical functioning, cognitive functioning, mental health, social functioning and general health (13–16).
The EDSS, a clinical measure of the disease severity of MS, was used in its original format, where 0 indicates the absence of neurological deficits and 10 indicates death due to MS (13, 17). The same EDSS measurement procedure was used as in the neurology setting. The rehabilitation physician and 4 research physiotherapists, who carried out the neurological examinations of participants, received an additional training by an MS neurologist in the scoring of the neurological systems and the EDSS.
The FIM consists of a motor function sub-scale (FIMmf, 13 items) and a cognitive function sub-scale (FIMcf, 5 items) (14). These items address the activities of daily living and are scored on the basis of a semi-structured interview. The validity of the FIM for use in inpatient and outpatient rehabilitation settings is well established, and its reliability is good (18, 19).
The SF-36 is a health-related quality of life questionnaire that assesses 8 domains, i.e. physical functioning (SF-36pf), mental health (SF-36mh), bodily pain, vitality, social functioning (SF-36sf), role physical (SF-36rp), role emotional, and general health perception (SF-36gh) (15, 16). Its clinimetric properties have been studied extensively (20, 21).
The FIMmf scores (maximum range: 13–91), FIMcf scores (maximum range: 5–35), and SF-36 scores were transformed to a scale that ranged from 0 (worst) to 100 (best) (21).
The following potential determinants of the course of functioning were considered: age at inception of the study (age0), gender, type of MS, and use of DMD.
The type of MS was determined by a neurologist 6 months after inclusion of the patient in the study as either RO or NRO using the standardized definitions of Lublin & Reingold (22). In the early stages of the disease, relapsing remitting MS (RRMS) is relatively easy to recognize and accounts for the majority of cases. In practice, primary progressive MS (PPMS) is more difficult to recognize. The RO group consisted of patients with RRMS and secondary progressive MS (SPMS), and the NRO group consisted of PPMS and a small group for whom the type was not clear at the 6-month follow-up.
DMD use was analysed by dividing the participants into DMD-users or never-users, based on their medication history with the first-line DMD interferon β-1a, interferon β-1b, and/or glatiramer acetate (5). The use of a DMD and the type of DMD, including starting date and end date, were verified at each interview.
Statistical analyses
Within-patient changes in the course of functioning over a 10-year period were analysed for 8 continuous outcomes, using the linear mixed model (LMM) from SPSS (Statistical Package for the Social Sciences), version 15.0 (23–25). LMM allows both time-invariant and time-varying covariates of the continuous outcome variable to be considered. LMM also allows the inclusion of random effects, such as subject-specific intercepts and slopes, assuming the participation of a random sample of MS patients. Another advantage of the LMM is the so-called “all available cases” analysis, alleviating the problem of missing data and allowing the use of all data of all available cases at each measurement moment. Time was modelled as a continuous variable and expressed in “years since diagnosis”. To test whether the course of functioning showed a best fit as linear or non-linear over time, other higher-order polynomial time trends (i.e. quadratic and cubic time effects) were tested for each outcome measure.
We used the interaction terms “time (years) × RO group, time2 × RO group and time3 × RO group” to test for differences in the rate of change between the RO group and the NRO group, using the NRO group as the reference in the analyses. The initial level of functioning (i.e. random intercept) and time course (random slopes) were allowed to vary across individuals. The significance level for both main effects and interaction effects was set at 0.05.
Fig. 1 shows plots of the fixed predicted estimates (with all random effects set at 0). Because age0 was a significant covariate of the 10-year course of the EDSS, SF-36pf, and FIMmf (Fig. 1a–c), these figures show the course over time in a patient who was 40 years of age at the start of the study. This example was chosen, because it is more or less the average of the ages of the RO and the NRO group.
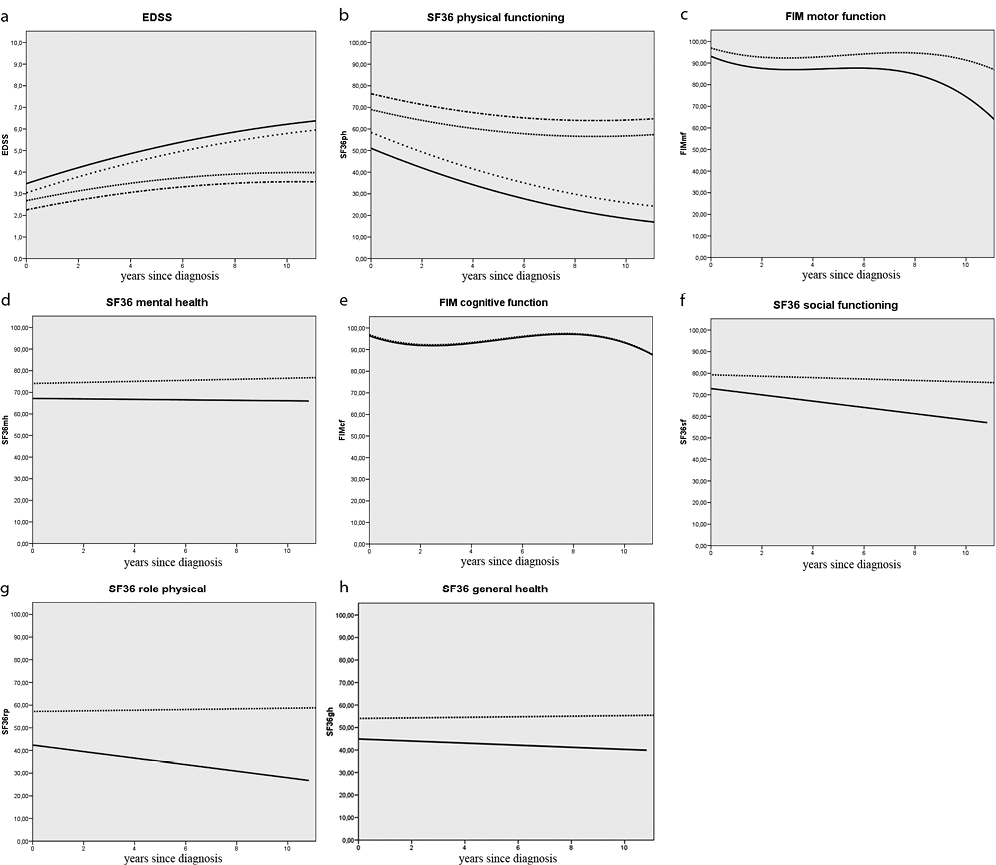
Fig. 1. Ten-year course of functioning of patients with multiple sclerosis (MS) in the domains of neurological deficits, physical functioning, cognitive and mental health, social functioning and general health. The fitted scores on the outcome measures (y-axis) are plotted against years since diagnosis, on the x-axis. Y-axis: absolute scores on the outcome measure; the maximum range of Expanded Disability Status Scale (EDSS): 0–10, the maximum range of Medical Outcome Study Short Form-36 (SF-36) sub-scales and Functional Independence Measure (FIM) sub-scales: 0–100. (a–c) Because age was a significant covariate, these figures show the course over time in prototypical patients who were 40 years of age at the start of the study, with all random effects = 0. (a–b) Four lines each are given; the bold line represents the 10-year course of functioning of the non-relapse onset type of MS (NRO) group who used disease-modifying drugs (DMD), the dotted line the course of functioning of the non-DMD NRO group. The line with the frequent dots represents the course of functioning of the relapse onset type of MS (RO) group who used DMD, and the interrupted line the course of functioning of the non-DMD RO group. (c–h) Bold lines represent the course of functioning of the NRO group of patients, and the dotted lines the course of functioning of the RO group of patients. All random effects = 0. SF-36pf: sub-scale physical functioning; FIMmf: Functional Independence Measure, subscale motor function; SF-36mh: SF-36 mental health; FIMcf: FIM subscale cognitive function; SF-36sf: SF-36 social functioning; SF-36rp: SF-36 role physical; SF-36gh: SF-36 general health.
Results
Participants
The main socio-demographic and disease characteristics of the participants at baseline are shown in Table I. The data represent 156 patients, with a maximum of 7 repeated measures. Most participants (n = 128) had RO type of MS. NRO type MS was seen in 28 patients. Ten percent of the total number of measurements (109/1092 measurements) were missing due to lost to follow-up or skipping of a measurement. All 7 measurements were completed by 96 patients, 35 patients missed 1 measurement, 10 patients missed 2, 6 patients missed 3, 4 patients missed 4, and 4 patients missed 5 measurements, respectively. Reasons for loss of participants included the death of 2 patients, lack of new address or telephone number for 8 patients, and temporary or permanent withdrawal from the study. During the 10-year follow-up, 86 patients never used first-line DMD, and 70 used one or more first-line DMD for some period.
|
Table I. Socio-demographic and disease characteristics of 156 multiple sclerosis patients at the start of the follow-up study in 1998–2000 |
|||
|
Characteristic |
Relapse onset group n = 128 |
Non-relapse onset group n = 28 |
Total group n = 156 |
|
Age, years, median (IQR) |
35.9 (29.2–42.5) |
43.8 (38.2–49.0) |
37.1 (29.6–45.2) |
|
Female, % |
68.0 |
50.0 |
64.7 |
|
Use of DMD, % |
48.4 |
28.6 |
44.9 |
|
EDSS, median (IQR) |
2.0 (2.0–3.0) |
3.0 (2.5–4.0) |
2.5 (2.0–3.0) |
|
IQR: interquartile range; DMD: disease-modifying drugs; EDSS: Expanded Disability Status Scale. |
|||
Time course of functioning
Table II shows the median scores on daily functioning for the total cohort of MS patients. The results of the final regression models are presented in Table III. The 10-year course of functioning of the RO group and the NRO group are also graphically presented (Fig. 1a–h), and the level of change for each of the 8 outcome measures is given in the y-axes of these figures. Given age at the start of the study (age0), use of DMD, and MS type of onset for each individual patient, the rate of change per year can be calculated using the regression coefficients presented in Table III. The intercepts of the linear mixed models are estimates of the mean initial status immediately after diagnosis (Table III, Fig. 1a–h).
|
Table II. Daily functioning scores of 156 patients with multiple sclerosis (median, interquartiles) |
|||||||
|
Outcome measures |
0 years n = 156 Median (IQR) |
6 months n = 153 Median (IQR) |
1 year n = 148 Median (IQR) |
2 years n = 146 Median (IQR) |
3 years n = 147 Median (IQR) |
6 years n = 124 Median (IQR) |
10 years n = 109 Median (IQR) |
|
Neurological disability |
|||||||
|
EDSS score, % |
2.5 (2.0–3.0) |
2.5 (2.0–3.0) |
2.5 (2.0–3.5) |
3.0 (2.0–3.75) |
3.0 (2.0–4.0) |
3.0 (2.0–4.0) |
3.5 (2.0–6.0) |
|
< 3 |
65.4 |
59.5 |
54.4 |
44.1 |
43.8 |
40.7 |
38.5 |
|
< 6 |
97.4 |
94.1 |
93.9 |
89.0 |
87.0 |
79.7 |
73.4 |
|
< 8 |
100 |
100 |
100 |
100 |
100 |
100 |
94.5 |
|
Physical functioning |
|
|
|
|
|
|
|
|
SF-36 physical functioning |
75.0 (55.0–90.0) |
75.0 (45.0–90.0) |
70.0 (45.0–90.0) |
70.0 (45.0–90.0) |
75.0 (43.8–95.0) |
60.0 (30.0–85.0) |
65.0 (30.0–90.0) |
|
FIM motor function |
97.4 (93.6–100.0) |
96.2 (91.0–98.7) |
94.9 (89.7–98.7) |
92.3 (87.2–97.4) |
93.6 (87.2–97.4) |
96.2 (89.7–98.7) |
92.3 (87.8–97.4) |
|
Cognitive functioning |
|
|
|
|
|
|
|
|
SF-36 mental health |
76.0 (60.0–84.0) |
80.0 (64.0–88.0) |
76.0 (56.0–88.0) |
80.0 (64.0–88.0) |
76.0 (60.0–88.0) |
76.0 (64.0–88.0) |
80.0 (68.0–88.0) |
|
FIM cognitive function |
96.7 (93.3–100.0) |
96.7 (90.0–100.0) |
96.7 (90.0–100.0) |
93.3 (86.7–100.0) |
93.3 (86.7–97.5) |
96.7 (93.3–100.0) |
93.3 (90.0–100.0) |
|
Social functioning |
|
|
|
|
|
|
|
|
SF-36 social functioning |
81.3 (62.5–100.0) |
87.5 (62.5–100.0) |
75.0 (62.5–100.0) |
87.5 (62.5–100.0) |
75.0 (62.5–100.0) |
75.0 (62.5–100.0) |
75.0 (62.5–100.0) |
|
SF-36 role physical |
50.0 (0.0–100.0) |
75.0 (0.0–100.0) |
62.5 (0–100.0) |
75.0 (0.0–100.0) |
50.0 (0.0–100.0) |
50.0 (0.0–100.0) |
75.0 (0.0–100.0) |
|
General health |
|
|
|
|
|
|
|
|
SF-36 general health |
52.0 (35.0–69.3) |
53.5 (35.5–67.0) |
50.0 (35.0–67.0) |
52.0 (37.0–72.0) |
52.0 (40.0–67.0) |
50.0 (35.0–67.0) |
55.0 (37.0–72.0) |
|
IQR: Interquartile Range; EDSS: Expanded Disability Status Scale; SF-36: Medical Outcome Study Short Form-36; FIM: Functional Independence Measure. |
|||||||
Course of neurological functioning
The course of EDSS scores changed significantly over time, and was best fitted by a quadratic slope model. There was also a significant interaction between MS onset type and the time variables, showing a faster rate of change in the NRO group than in the RO group (Fig. 1a). Because age had a significant influence on the EDSS scores, the course over time in patients who were 40 years of age at the start of the study is shown in Fig. 1a. Patients using DMD had overall higher EDSS scores than patients who did not use DMD. There was no interaction effect between DMD use and time.
Course of physical functioning
Measured with the SF-36pf, physical functioning worsened gradually, though significantly, over time in both subgroups (Fig. 1b); the time course could be best fitted with a quadratic slope of change. The course of the FIMmf scores showed a different pattern; a gradual change in scores was seen over the first 6 years, followed by a steep decline in both the RO group and the NRO group (Fig. 1c). While the RO and NRO groups initially differed by 17.9 points on the SF-36pf (95% confidence interval (95% CI): 8.99–26.81) and 3.9 points on the FIMmf (95% CI: 1.81–5.93), these gaps became larger over time due to a more rapid decrease in physical functioning in patients with NRO type of MS. The variables “age” and “use of DMD” both contributed significantly to the course of SF-36pf. Age was also a significant covariate in the FIMmf model. Older patients had lower scores on the physical functioning scales, as indicated by the negative signs.
Course of cognitive and mental functioning
Fig. 1e shows that the scores on SF-36mh changed only marginally in the 10-year period. The variable “time” had no significant effect (Table III). Although the respective scores of the RO (initial score 74.08) and NRO groups (initial score 67.17) were significantly different (6.9 points, 95% CI, 0.4–13.4), there was no significant interaction effect of “time × RO/NRO group”. The pattern of FIM cognitive function scores was characterized by an initial worsening to year 2, a slight improvement up to the sixth year, followed by a steep decline to the last follow-up time 10 years after diagnosis. Overall, the change on the FIM cognitive function scale was small, i.e. 10% in 10 years (or 3 points on the non-transformed FIMcf). The cubic curves of the RO and NRO groups were nearly identical (Fig. 1e). On both cognitive outcome measures, the covariate age0 did not attain significance. Because our main aim was to study the time course of functioning, Table III also presents the (non-significant) estimates of time and interaction. Nevertheless, both models were also fitted without the non-significant interaction term, time × RO/NRO group. For SF-36mh, the main effect of time was 0.187 (95% CI, –0.101 to 0.475), and for FIMcf, time –4.21 (95% CI, –5.186 to –3.235), time2 1.126 (95% CI, 0.875 to 1.379), and time3 –0.074 (95% CI, –0.090 to –0.057).
Course of social functioning
SF-36sf scores decreased linearly over time in both the RO and the NRO group by –1.46/year (95% CI, –2.59/year to –0.33/year). Because of the non-significant interaction, the model was also fitted without the interaction. The significant parameter estimate for time declined to –0.509 (95% CI, –0.974 to –0.045), and for onset type to 9.52 (95% CI, 2.112 to 32.670). No significant effect of time was found for the SF-36rp subscale.
Course of general health
The general health perception of the participants was measured with the SF-36gh subscale. On this subscale no significant influence of time on the course of functioning or on the interaction with type of MS was found (Table III).
|
Table III. Ten-year course of daily functioning. Final linear mixed models with estimates of the fixed coefficients with 95% confidence intervals |
||||
|
Fixed coefficients |
EDSS Estimate (95% CI) |
SF-36 physical functioning Estimate (95% CI) |
FIM motor function Estimate (95% CI) |
SF-36 mental health Estimate (95% CI) |
|
Intercept |
1.845 (1.018 to 2.671) |
84.713 (67.573 to 101.854) |
98.851 (95.231 to 102.471) |
67.173 (61.306 to 73.039) |
|
Time |
0.395 (0.291 to 0.500) |
–4.865 (–6.620 to –3.110) |
–4.779 (–6.511 to –3.407) |
–0.111 (–0.822 to 0.600) |
|
Time2 |
–0.012 (–0.019 to –0.005) |
0.160 (0.042 to 0.280) |
1.176 (0.745 to 1.607) |
|
|
Time3 |
|
–0.088 (–0.116 to –0.061) |
||
|
NRO vs RO typea |
–0.791 (–1.210 to –0.373) |
17.904 (8.994 to 26.814) |
3.869 (1.812 to 5.927) |
6.917 (0.442 to 13.391) |
|
Time × RO/NROa |
–0.145 (–0.229 to –0.060) |
2.036 (0.608 to 3.464) |
1.156 (–0.753 to 3.065) |
0.356 (–0.422 to 1.133) |
|
Time2 × RO/NROa |
–0.317 (–0.792 to 0.158) |
|||
|
Time3 × RO/NROa |
0.033 (0.003 to 0.064) |
|||
|
Age0 |
0.041 (0.024 to 0.057) |
–0.841 (–1.189 to –0.492) |
–0.143 (–0.216 to –0.071) |
|
|
DMD use vs no-usea |
–0.425 (–0.738 to –0.113) |
7.343 (0.894 to 13.792) |
||
|
FIM cognitive function Estimate (95% CI) |
SF-36 social functioning Estimate (95% CI) |
SF-36 role physical Estimate (95% CI) |
SF-36 general health Estimate (95% CI) |
|
|
Intercept |
96.380 (94.512 to 98.247) |
72.880 (65.497 to 80.262) |
42.399 (29.301 to 55.498) |
44.919 (38.103 to 51.735) |
|
Time |
–4.187 (–5.211 to –3.163) |
–1.460 (–2.588 to –0.331) |
–1.445 (–3.268 to 0.378) |
–0.462 (–1.351 to 0.426) |
|
Time2 |
1.126 (0.874 to 1.378) |
|||
|
Time3 |
–0.074 (–0.091 to –0.057) |
|||
|
NRO vs RO typea |
0.511 (–1.511 to 2.533) |
6.390 (–1.758 to 14.539) |
14.772 (0.313 to 29.231) |
9.122 (1.598 to 16.646) |
|
Time × RO/NROa |
–0.027 (–0.414 to 0.360) |
1.133 (–0.101 to 2.368) |
1.592 (–0.403 to 3.587) |
0.587 (–0.385 to 1.559) |
|
aNRO group and DMD use (yes) were respectively used as reference groups. EDDS: Expanded Disability Status Scale; SF-36: Medical Outcome Study Short Form-36; FIM: Functional Independence Measure; RO: relapse onset type of MS; NRO: non-relapse onset type of MS; DMD: disease modifying drugs; Time2: quadratic time factor; Time3: cubic time factor. |
||||
Discussion
Time course of daily functioning
The aim of this study was to consider neurological, physical, cognitive and social functioning over a 10-year course in an incidence cohort of 156 patients with MS. The findings of our previous 3-year follow-up study have now been extended (1). We found a significant, mostly non-linear, worsening over time for neurological, physical functioning, and cognitive and social functioning, with a more rapid decline in neurological and physical functioning in patients with the NRO type of MS. There was no time-related decline in scores on the SF-36mh, SF-36rp, and SF-36gh.
An interesting point is the difference in courses of physical functioning and cognitive functioning when measured with either the SF-36 or the FIM. The FIM scores were obtained by a structured interview of the patient, while the SF-36 is a self-reported questionnaire. FIM motor function, as well as FIM cognitive function, were best fitted by a cubic function. Both FIM scales showed a steep decline in scores 6 years after onset. Scores on the SF-36pf decreased gradually, and only small, non-significant changes were found on the SF-36mh. A clinimetric study of these evaluative outcome measures concluded that the SF-36pf was more responsive than the FIMmf, and the FIMcf was found to be more useful than the SF-36mh (21). The influence of the manner of administration of a questionnaire on the responsiveness and response shift of patient-reported outcome measures will be an interesting topic for future research.
Magnitude of changes in daily functioning
A considerable number of patients with MS have a benign course and live for many years without accumulating neurological disability. Even after 10 years, 38.5% of our FUPRO-MS cohort still had an EDSS < 3. The most widely accepted definition of benign MS is an EDSS score ≤ 3 at 10 years after disease onset (26–28). Our results concur with those of other recent studies demonstrating overall stability in EDSS scores in population-based cohorts of MS patients (29–32).
Given the slow disease progression in our FUPRO-MS cohort as perceived by the EDSS, it is perhaps unsurprising that changes in daily functioning were, on average, also small. The largest effect was on the SF-36pf, with a decline of 12.3% in 10 years in RO patients, and 32.7% in NRO patients. Nevertheless, one should bear in mind that at the moment of diagnosis most of the patients already have aberrant functioning scores compared with their healthy peers (1, 33). Any additional progression further worsens daily functioning and may indicate the need for rehabilitation interventions (e.g. physiotherapy, occupational therapy, adaptive devices and equipment).
Use of disease-modifying drugs
One of the methodological issues in observational cohort studies, and an easy target for criticism, is the uncontrolled influence of drugs and therapies that patients use. Therefore, we used the dichotomous variable DMD (use/no use) as a covariate to investigate whether DMD had a positive influence on the time course of daily functioning. Unlike others, we were unable to demonstrate in the small FUPRO-MS cohort a course-modifying interaction of DMD over time (34, 35). We could note that patients who used DMD had significantly lower SF-36pf scores and higher EDSS scores, compared with those not using DMD (Fig. 1a–b). This confirms that high disease activity leads to the treatment of patients with DMD.
When DMD first became available for MS they were prescribed particularly often to those patients with high disease activity, due to the supposed risk of irreversible progression of disability (2, 3). This might explain why in our study population, DMD were prescribed to RO as well as NRO patients. Currently these drugs are especially prescribed to patients with RRMS, and it is expected that the percentage of DMD users will be larger in more recently diagnosed RO type of patients. To avoid the methodological weaknesses of non-randomized studies in the estimation of DMD effectiveness, confounding by treatment indication, or the selective elongated observation of trial participants, we highly recommend the inclusion of patient-reported functional outcome measures, such as the FIM or the SF-36, as primary end-points in future randomized clinical trials of new DMD.
Comparison with other longitudinal studies
One other study by Gulick and colleagues (36) and Gulick (37) simultaneously analysed the 10-year trajectory of MS-related symptoms and daily functioning. The findings suggested a slow but significant increase in prevalent symptoms related to motor, brain stem, and bowel and bladder function, and an overall decline in all activities of daily living (ADL) domains. The magnitude of change during the 10-year period was greatest for Fine and Gross Motor and Intimacy ADL functions. Physical functioning showed a relatively steep decline after 5 years post-diagnosis in the group with early MS (37). In our study, this pattern was also found on the FIM motor function score, but not on the SF-36pf.
Longitudinal results on the course of cognitive functioning are available from a variety of MS populations (38). If we focus on early MS, two studies show results comparable to ours (33, 39). An Italian multicentre prospective study of MS prognosis in 50 young participants (mean disease duration 1.58 years, range 0.07–4.95 years), showed that the percentage of patients with mild or moderate cognitive deficits increased from 26% at baseline, to 49% at the 4-year follow-up, and to 56% at the 10-year follow-up (39). Jønsson et al. (33) conducted a 4-year follow-up study of 80 newly diagnosed MS patients (77 RO, 3 NRO, time since diagnosis less than 1 year). While 48% of the patients already had cognitive impairments at baseline, the course of cognitive performance on most of the cognitive domains showed an improvement or remained stable over time. The authors attributed these findings mainly to a very large practice effect for the neuropsychological tests used (33). To measure daily cognitive functioning, we used the 5-item cognitive functioning scale of the FIM. A practice effect on the interviewer-based FIM questionnaire used in our study can clearly be excluded. It would be worthwhile to investigate the relationship between the 5-item FIMcf and more specific neurocognitive instruments in order to understand whether processes, such as restoration, compensation, adaptation, or learning effects, are involved.
Immediately after diagnosis, 39% of our cohort already showed aberrant social functioning scores (1). Gulick (37) also found poor scores on this domain, which she defined as a normal pattern in early MS. The emotional impact of diagnosis and uncertainty about the future leads patients to focus their limited energy on employment, homemaking, and personal care activities, and to restrict their normal social and recreational activities. While Gulick (37) found that social functioning improved after a few years of adaptation, it had again declined at the 10-year follow-up. We found a relatively stable pattern of social functioning in the RO group, but a clinically relevant decline in the NRO group.
Explaining change over time
In this study, we were in the first place interested in the time course of daily functioning of the FUPRO-MS cohort as a whole. A challenge in the interpretation of the longitudinal changes might be found in the between-patient differences. Repeatedly administered patient-reported outcome measures might be influenced by the phenomenon of response shift, i.e. patients may adapt to their altered health situation, change their expectations, and/or change their standards of social comparison (40). Therefore, at several points in time, part of the patients may have used different frames of reference when completing the SF-36 (40). Further analyses will be conducted to examine the role of explanatory determinants, including response shift, to explain between-patient differences in the course of SF-36 and FIM scores. Furthermore, it would be interesting to determine whether there is a mutual longitudinal relationship between the outcome measures, such as social functioning and physical functioning, in NRO and RO patients. Appropriate criteria to predict which patients with MS are at low, medium, or high risk for neurological disability and functional limitations over the long-term are anticipated but are not yet available (11, 26–28, 32).
Strengths and limitations of the study
Longitudinal cohort studies in patients with MS provide data on the direction and magnitude of change that occurs over time in a single patient, especially when the study begins at the moment of definite diagnosis. Moreover, linear mixed model analyses with more than 3 repeated measurements allow the determination of non-linear trajectories, taking into account individual variation in baseline scores and trajectories (23). Our study also showed that the various domains of functioning each have their own time course, which suggests the need for regular, periodic multidimensional assessments and monitoring. This will allow the identification of changing patterns in individual patients, permitting treatment by timely and appropriate rehabilitation interventions.
The results of our study may have been influenced by several obvious limitations (9, 41). Two main types of biases might have affected our study results, i.e. a selection bias and an information bias. The problem of missing data is common in longitudinal studies, especially with measurements over longer time periods. Our participation rates declined substantially over the 10-year time interval, from 156 at the start, to 109 after 10 years. To minimize loss to follow-up, participants were mainly visited at home, avoiding the need for a visit to the MS Center. Furthermore, in the intervals between visits the patient cohort was kept actively engaged in the study by newsletters describing interesting study results and personal score sheets that included an explanation in layman’s terms. As a result of some loss of follow-up, we cannot entirely exclude the possibility that a selection bias or response bias might have influenced present results. Selection bias may have an impact on both the apparent change in patients’ functioning over time and the interaction between time and onset type of MS. Regarding the latter, slightly more data from NRO type patients were missing at 10 years, compared with RO type patients. The percentage of NRO participants declined from 17.9% at baseline to 16.5% at 10 years. The baseline scores of participants who completed 10 years in the study were slightly better on the 8 outcome measures presented. Only the baseline EDSS differed significantly (by 0.5 points) between patients lost-to-follow-up and long-term participants. Given these small differences and the statistical power of linear mixed models, we do not expect selection bias to have significantly altered our results.
To keep the variability in measurement procedures to a minimum, only a small number of well-trained researchers were responsible for over 1,000 measurements. All were physiotherapists and were trained in rating the EDSS by the same MS neurologist. All other assessment methods were taught and supervised by the same rehabilitation physician, who was involved in the study from its inception. Therefore, the scoring of the EDSS and the FIM in this protocolized research setting, took place in a valid and consistent way. We can therefore confidently exclude information bias due to contributions from different researchers.
Conclusion
This study followed an incidence cohort of 156 patients with MS and monitored the longitudinal course of functioning in the domains of neurological deficits, physical functioning, cognitive functioning, social functioning and general health. In a previous study, we were able to show that a large percentage of patients with MS already have functional limitations immediately after disease onset (1). This study shows, that in the following 10 years, MS induces relatively mild changes in the patient’s daily activities. Although patients showed declines, which were more pronounced in physical functioning than in cognitive and social functioning, there were no time-related declines in mental health, social role due to physical limitations, or general health.
AcknowledgementS
This study was carried out as part of the FUPRO-MS research programme “Long-term prognosis of functional outcome in neurological disorders”. We would like to thank the neurologists of the outpatient neurology clinics of the VU University Medical Center, Erasmus MC University Medical Center Rotterdam, Academic Medical Center Amsterdam, Saint Lucas Andreas Hospital Amsterdam, and OLVG Hospital Amsterdam, for recruiting newly diagnosed MS patients. We thank the participants of the FUPRO-MS cohort study for their contributions and dedication throughout the study period.
This study was supported by Fonds NutsOhra (SNO 0601-68). Ms J. C. E. Kempen was supported by a grant from the Dutch MS Research Foundation (05-570 MS). The Netherlands Organization for Scientific Research (NWO 940-33-009), and the Netherlands Organization for Health Research and Development (ZonMw 1435.0020) supported previous parts of the FUPRO-MS research programme. The MS Center Amsterdam receives structural funding of the Dutch MS Research Foundation. None of the funding sources had a role in the study design, conduct, analysis and interpretation of the data, the writing of the manuscript, or in the decision to submit the paper for publication.
All authors have completed the ICMJE uniform disclosure form at www.icmje.org/coi_disclosure.pdf (available on request from the corresponding author) and declare: no support from any organization for the submitted work; no financial relationships with any organizations that might have an interest in the submitted work in the previous 3 years; except CHP, who received payment from Actelion, Biogen Idec, Bayer Schering, Teva, Merck-Serono, Novartis, Glaxo SK, UCB, Roche, and Antisense Ther for consultancies; no other relationships or activities that could appear to have influenced the submitted work.
References

