Shamay S. Ng, PhD, Hannah H. Ng, BSc(Hons), Kimmy M. Chan, BSc(Hons), Julia C. Lai, BSc(Hons), Ann K. To, BSc(Hons) and Cindy W. Yeung, BSc(Hons)
From the Department of Rehabilitation Sciences, The Hong Kong Polytechnic University, Hong Kong (SAR), China
OBJECTIVE: To investigate: (i) the intra-rater, inter-rater and test-retest reliability of the 12-step stair test; (ii) its correlation with other stroke-specific impairments; and (iii) the cut-off scores that best discriminate patients with stroke from healthy elderly subjects.
DESIGN: Cross-sectional study.
SETTING: University-based rehabilitation centre.
SUBJECTS: Thirty-five subjects with chronic stroke and 29 healthy elderly subjects.
METHODS: The 12-step ascend and descend test was administered along with the Fugl-Meyer Motor Assessment for the lower extremities (FMA-LE), hand-held dynamometer measurements of hip abductor and knee extensor muscle strength, the Five Times Sit to Stand Test (FTSTST), assessment using the Berg Balance Scale (BBS), activities-specific balance confidence scale (ABC) assessment, the 10-metre walk test, and the Timed “Up and Go” (TUG) test.
RESULTS: The 12-step ascend and descend test showed excellent intra-rater, inter-rater and test-retest reliability. The test was positively correlated with FTSTST times, gait velocity, and TUG times, and negatively correlated with FMA-LE scores and BBS scores. A test performance of 15.22 seconds or less was shown reliably to discriminate healthy elderly subjects from stroke survivors.
CONCLUSION: The 12-step ascend and descend test is a reliable clinical test that is inexpensive and easy to implement, and is useful for assessing the stair-walking ability of patients with chronic stroke.
Key words: stroke; walking; outcomes measures; rehabilitation.
J Rehabil Med 2013; 45: 00–00
Correspondence address: Shamay S.M. Ng, Department of Rehabilitation Sciences, The Hong Kong Polytechnic University, Hong Kong (SAR), China. E-mail: Shamay.Ng@polyu.edu.hk
Submitted May 23, 2012; accepted August 29, 2012
INTRODUCTION
Stair-walking has been rated as the most difficult and troubling daily motor activity for stroke survivors (1, 2). It is also considered the best predictor of free-living physical activity for community-dwelling people with stroke (3). Stair-walking ability alone predicts 48% of the variance in the daily duration of time on the feet and 58% of that in activity frequency (3). Reduced mobility, including stair-walking speed, is commonly reported (3), and measuring stair-walking ability is a crucial element in stroke rehabilitation.
Testing the stair-walking ability of patients with stroke is inexpensive and easy to administer, so it is widely used in clinical settings. Measurements of stair ascending and descending ability are included in the Motor Assessment Scale (4, 5) and the Barthel Index (4, 5), and this particular item has also been used separately as an independent outcome measure for patients with stroke (6).
Two-step, 3-step, 11-step and 12-step stair tests have been developed (7–11). Excellent reliability had been reported with different patient groups, including patients with stroke (7, 8) or total knee replacement (9), frail elderly people (10) and healthy elderly people (11). In a chronic stroke population, Faria et al. (7) reported excellent intra-rater (intraclass correlation coefficient (ICC) range, 0.93–0.96) and inter-rater (ICC range, 0.94–0.97) reliability with an 11-step stair ascend/descend test. Flansbjer’s group (8) also reported excellent test-retest reliability (ICC=0.98) with stroke patients for the 12-step stair test. A group led by Almeida (9) reported excellent inter-rater reliability (ICC=0.94) using an 11-step stair test with patients after total knee replacement. Jette et al. (10) have reported moderate test-retest reliability (ICC=0.54) with the frail elderly using a 2-step stair test, but Panzer’s group (11) reported rather better test–retest reliability (ICC = 0.63) using a 3-step descent with healthy elderly subjects.
Although the reliability of stair testing with stroke survivors has been studied previously (7, 8), there have been no published studies that have attempted to find a correlation between stair-walking ability and stroke-specific impairment assessments, nor has there been any published investigation of the best cut-off score in a 12-step ascend and descend test for discriminating patients with chronic stroke from healthy elderly subjects.
The objectives of this study were: (i) to assess the intra-rater, inter-rater and test-retest reliability of a 12-step ascend and descend test; (ii) to explore any correlation between 12-step ascend and descend test performance and other more stroke-specific indicators including the Fugl-Meyer lower extremity assessment (FMA-LE), leg strength, 5 times sit-to-stand test (FTSTST) time, Berg Balance Scale (BBS) score, Activities-specific Balance Confidence scale (ABC) score, gait velocity and Timed “Up and Go” test (TUG) time; and (3) to determine the cut-off scores best discriminating patients with stroke from healthy elderly subjects.
METHODS
Participants
This was a cross-sectional study. A sample size of 29 subjects per group was required to achieve 80% power to detect an intra-class correlation coefficient (ICC) of 0.95 at a confidence level of 0.05.
A total of 35 people with chronic stroke (27 men, 8 women; mean age 57.26 years (standard deviation (SD) 7.19) ) with a mean duration of 5.80 (SD 2.82) years post-stroke were recruited along with 29 healthy elderly persons (19 men, 10 women; mean age 57.76 years (SD 5.77) ) to participate in the study. The stroke subjects were recruited from a local self-help group for patients with stroke. The healthy subjects were recruited from the community using convenience sampling.
Subjects with stroke were included if: (i) they had experienced a single stroke at least 1 year previously; (ii) were able to walk more than 10 metres and climb a flight of 12 stairs independently (with or without a walking aid); (iii) had an Abbreviated Mental Test score of 7 or higher; and (iv) were in generally stable medical condition that allowed them to participate in the testing protocol. Candidates were excluded if they had experienced other neurological conditions aside from stroke, such as Parkinson’s disease, or co-morbid disabilities, such as visual impairment or arthritis, that would affect proper assessment. Age-matched healthy elderly subjects were recruited if they were able to walk 10 m and negotiate a flight of 12 stairs independently with or without an assistive device, and could understand instructions.
The ethics committee of the local institution approved the study protocols as meeting all of the guidelines set by the Declaration of Helsinki. Before testing began, all eligible individuals were informed about the purpose and procedures of the study and gave their written consent.
Procedures
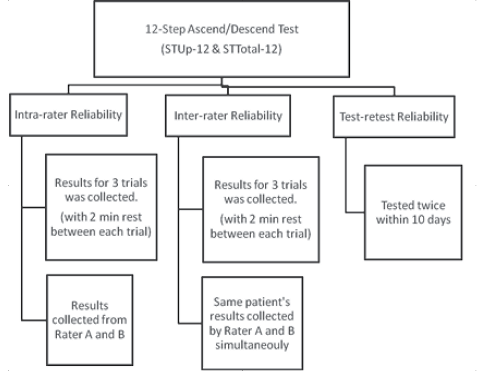
The stroke subjects were tested in two separate sessions 7–10 days apart. In addition to the 12-step ascend and descend test they were required to complete the FMA-LE, a lower limb muscle strength assessment, the FTSTST, a BBS assessment, an ABC scale assessment, the 10-m walking test and the TUG test. The order of testing was randomized by drawing cards. Two min of rest was allowed after each test in order to minimize any effect of fatigue. Each session lasted approximately 1.5 h. The data collection procedures are illustrated in Fig 1.
The healthy subjects were tested in one session and were only required to perform the step test, the TUG test and the FTSTST in random order. The testing session lasted approximately 30 min.
Fig. 1. Data collection procedures.
Outcome measures
All outcome measures were recorded by two trained, independent examiners (A and B), and each examiner was blinded to the other’s results.
Twelve-step Ascend and Descend Test. The test was administered using a set of 12 steps 14 cm high, 30 cm deep and 153 cm wide with handrails on both sides. The test began with the subject standing behind a marked line 27 cm away from the first step, with one hand (self-selected) on the handrail if he or she felt it necessary to ensure safety. On one rater’s “go” the subject climbed the stairs, turned around on the top platform, and descended using the other handrail (e.g. right-hand up, right-hand down). The subjects were instructed to complete the task at their “comfortable” speed. The ascending time (STUp-12) was recorded from the rater’s “go” to the time when both of the subject’s feet had reached the top platform. The total ascending and descending time (STTotal-12) was recorded when both of the subject’s feet had returned to the floor.
Fugl-Meyer Lower Extremity Assessment. The FMA-LE is a reliable test (12), with ICC ranging from 0.81 to 0.96 (13), designed to assess motor recovery following stroke. It was used to evaluate the impairments of the lower extremity including reflexes, movement synergies and coordination. The FMA-LE consists of 17 items and each item was scored on a 0–2 scale, giving a maximum possible score of 34 (12). The lower the score, the greater the subject’s motor impairment.
Lower limb muscle strength. The maximal isometric voluntary contraction of the hip abductors and knee extensors (in kg) was tested with a Nicholas hand-held dynamometer (model 01160, Lafayette Instrument Co., Lafayette, IN, USA). Good to excellent intra-rater reliability (ICC range, 0.76–0.89) has been reported for such measurements with individuals with chronic stroke (14). During the hip abductor strength measurements the subjects were positioned in supine lying. The dynamometer was placed on the lateral aspect of the femur, 5 cm proximal to the lateral epicondyle. During the knee extensor strength measurements the subjects were positioned in a high sitting position with the hip and knee in 90º of flexion. The dynamometer was placed on the anterior aspect of the tibia, 5 cm proximal from the inferior tip of the medial malleoli. For each muscle, the mean values from 3 trials were used for data analysis. A 2-min rest was given between trials in order to prevent muscle fatigue.
Five Times Sit-to-Stand Test. FTSTSTs first served as an outcome measure for functional leg strength (15). Excellent reliability (ICC range 0.97–1.00) have been reported with chronic stroke subjects (16). A standard chair 45 cm high without armrests was used for this test. Subjects were instructed to complete 5 repetitions of the sit-to-stand manoeuvre as quickly as possible with their arms crossed on their chest and their back against the chair at the end of each repetition. The time taken for completing the task was recorded. The mean values from 3 trials, with one-minute rest between each trial, were used for data analysis.
Berg Balance Scale Assessment. The BBS serves as a clinical test of a subject’s ability to maintain balance (17). Excellent reliability (ICC range, 0.98–0.99) has been demonstrated with stroke survivors (18). The subjects were tested on 14 tasks required in everyday living and the quality and speed of their task completion were rated by an assessor using a 5-point (0–4) scale with a maximum score of 56 (17).
Activities-specific Balance Confidence Scale. The ABC is a self-administered, questionnaire-based tool to assess subjective balance confidence in performing a wide range of activities that involve changing position or walking, and are related to community living (19). The questionnaire covers 10 items. Its scores range from 0 to 100. High test-retest reliability (ICC = 0.85) has been reported with chronic stroke subjects (20).
Ten-M Walk Test. Gait velocity was measured using the time taken to traverse a 10-m walkway. High test-retest reliability (ICC range, 0.90–0.97) has been reported with subjects with chronic stroke (8). The subjects were instructed to walk at their comfortable speed over a 14-m marked distance and were timed over the middle 10 m.
Timed “Up and Go” Test. The TUG test was developed to assess the basic functional mobility of frail elderly subjects (21), and it has shown excellent reliability (ICC > 0.95) with stroke survivors (22). The subjects were required to stand up from a chair, walk 3 m, turn around, return to the chair, and sit down. The time taken to complete this task was measured. The mean values from 3 trials, with 1-min rest between each trial, were used for data analysis.
Statistical analysis
Descriptive statistics were compiled describing the demographic characteristics of the subjects and the mean values of all the outcome measures. Data analysis was done with the help of SPSS software version 19.0 for Windows.
The normality of the data was checked using Shapiro–Wilk statistics, and the homogeneity of its variance was tested with Levene’s test for quality of variance. Non-parametric analyses were performed with the variables that were not normally distributed or not homogeneous, but otherwise the analyses were parametric. ICCs were used to quantify the degree of intra-rater (ICC3,1), inter-rater (ICC3,2), and test-retest reliability (ICC2,1). Any correlation between the subjects’ STUp-12 and STTotal-12 times and their stroke-specific impairment scores was established in terms of Spearman’s rho. The cut-off score between healthy elderly subjects and subjects with stroke was determined by plotting the receiver operating characteristics (ROC) curve.
The strength of correlation was defined as little or none (rs < 0.25), fair (rs range 0.25–0.50), moderate-to-good (rs range 0.50–0.75), or good to excellent (rs > 0.75) (23). A significance level of 0.05 was set for all analyses.
RESULTS
Descriptive statistics for all subjects and mean values of all outcome measures are shown in Tables I and II, respectively. Excellent intra-rater (ICC range 0.96–0.99) (Table III), inter-rater (ICC = 1.00) and test-retest reliability (ICC range 0.98–0.99) were observed (Table III).
|
Table I. Mean values of demographics in the two subject groups |
|||
|
Parameters |
Stroke (n = 35) Mean (SD) |
Healthy elderly (n = 29) Mean (SD) |
Healthy elderly vs stroke p-value |
|
Age, years |
57.26 (7.19) |
57.76 (5.77) |
0.76 |
|
Sex, M/F, n (%) |
27/8 |
19/10 |
0.30 |
|
Height, cm |
164.81 (7.17) |
164.03 (8.25) |
0.69 |
|
Weight, kg |
67.97 (9.87) |
66.95 (13.24) |
0.56 |
|
Body mass index, kg/m2 |
24.96 (2.81) |
24.87 (4.60) |
0.94 |
|
Post-stroke duration, years |
5.80 (2.82) |
N/A |
N/A |
|
STUp-12, s |
11.39 (3.14) |
6.14 (0.75) |
< 0.001* |
|
STTotal-12, s |
25.45 (7.51) |
12.65 (2.03) |
< 0.001* |
|
FTSTST, s |
20.57 (6.95) |
14.81 (2.56) |
< 0.001* |
|
TUG, s |
15.97 (5.40) |
9.01 (1.37) |
< 0.001* |
|
*p < 0.05. SD: standard deviation; M: male; F: female; STUp-12: the ascending time; STTotal-12: the descending time; FTSTST: Five Times Sit to Stand Test; TUG: Timed “Up and Go” Test. |
|||
|
Table II. Mean values of all outcome measures in subject with stroke |
|
|
Observation |
Mean (SD) |
|
STUp-12, s |
11.39 (3.14) |
|
STTotal-12, s |
25.45 (7.51) |
|
FMA-LE |
26.60 (4.46) |
|
Muscle strength, kg Hip abductors, affected/unaffected side |
15.33 (6.22)/18.09 (5.75) |
|
Knee extensors, affected/unaffected side |
16.13 (5.53)/19.20 (5.30) |
|
FTSTST, s |
20.57 (6.95) |
|
BBS |
51.46 (3.46) |
|
ABC scale |
75.19 (15.25) |
|
Gait velocity, m/s |
0.88 (0.27) |
|
TUG, s |
15.97 (5.40) |
|
SD: standard deviation; STUp-12: the ascending time; STTotal-12: the descending time; FMA-LE: Fugl-Meyer Motor Assessment for the lower extremities; FTSTST: Five Times Sit to Stand Test; BBS: Berg Balance Scale; ABC: activities-specific balance confidence scale; TUG: Timed “Up and Go” Test. |
|
|
Table III. Intra-tester reliability of STUp-12 and STTotal-12 times for subjects with stroke |
||||
|
STUp-12 time |
STTotal-12 time |
|||
|
Score, s Mean (SD) |
ICC (3, 1) (95% CI) |
Score, s Mean (SD) |
ICC (3, 1) (95% CI) |
|
|
Rater A |
||||
|
Day 1 |
11.36 (3.10) |
0.958 (0.924–0.978) |
25.38 (7.60) |
0.980 (0.952–0.991) |
|
Day 2 |
11.48 (3.20) |
0.977 (0.957–0.988) |
25.48 (7.53) |
0.987 (0.975–0.993) |
|
Rater B |
||||
|
Day 1 |
11.32 (3.11) |
0.954 (0.910–0.977) |
25.41 (7.60) |
0.978 (0.945–0.990) |
|
Day 2 |
11.41 (3.23) |
0.978 (0.960–0.988) |
25.51 (7.56) |
0.988 (0.979–0.994) |
|
STUp-12 time: the ascending time; STTotal-12 time: the descending time; ICC: intraclass correlation coefficient; CI: confidence interval; SD: standard deviation. |
||||
Table IV demonstrates the Spearman’s correlation analyses relating STUp-12 and STTotal-12 times with the other variables. Significant positive correlations were found with FTSTST times (STUp-12: rs = 0.50; STTotal-12: rs = 0.52), gait velocity (STUp-12: rs = 0.71; STTotal-12: rs = 0.74,) and TUG times (STUp-12: rs = 0.73; STTotal-12: rs = 0.76). Significant negative correlations were found with FMA-LE scores (STUp-12: rs = –0.80; STTotal-12: rs = –0.77) and BBS scores (STUp-12: rs = –0.68; STTotal-12: rs = –0.70).
|
Table IV. Spearman’s correlations of the STUp-12 and STTotal-12 times with stroke-specific assessments of subjects with stroke |
||
|
Parameters |
Correlation of STUp-12 |
Correlation of STTotal-12 |
|
FMA-LE |
–0.80** |
–0.77** |
|
Muscle strength, kg Hip abductors, affected side |
–0.26 |
–0.33* |
|
Knee extensors, affected side |
–0.24 |
–0.26 |
|
FTSTST, s |
0.50* |
0.52* |
|
BBS |
–0.68** |
–0.70** |
|
ABC scale |
–0.28 |
–0.24 |
|
Gait velocity, m/s |
–0.71** |
–0.74** |
|
TUG, s |
0.73** |
0.76** |
|
*p<0.05; **p<0.001. STUp-12: the ascending time; STTotal-12: the descending time; FMA-LE: Fugl-Meyer Motor Assessment for the lower extremities; FTSTST: Five Times Sit to Stand Test; BBS: Berg Balance Scale; ABC: activities-specific balance confidence scale; TUG: Timed “Up and Go” Test. |
||
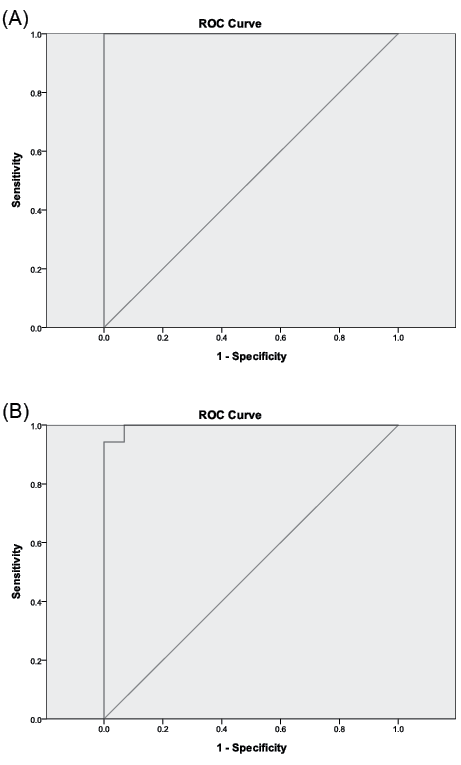
STUp-12 performance above or below 7.51 s (p ≤ 0.001) and STTotal-12 performance above or below 15.22 seconds (p ≤ 0.001) were found to best discriminate healthy elderly subjects from stroke survivors (STTotal-12 sensitivity = 100%, specificity = 90.4%; STUp-12 sensitivity = 100%, specificity = 100%). The area under the ROC curve (AUC) was 1.00 for both the STUp-12 times and the STTotal-12 times (Fig. 2).
Fig. 2. Receiver operating curve characteristic (ROC) curves between healthy elderly subjects and subjects with stroke (A) for STUp-12 scores (area under the curve (AUC) = 1.00) and (B) for STTotal-12 scores (AUC = 1.00). The near-vertical line indicates the ROC curve. The oblique straight line indicates non-discriminating characteristics of the test. STUp-12: the ascending time; STTotal-12: the descending time.
DISCUSSION
This is the first published study to investigate the correlation between 12-step ascend and descend test times and other indicators of stroke-specific impairments, and it has been the first to establish useful STUp-12 and STTotal-12 cut-off times discriminating between healthy elderly subjects and people with stroke.
Test performance and other stroke-specific assessments
The usual number of steps in a “flight of stairs” in Hong Kong is approximately 12 (ranging from 9 to 15 steps) with a step height of less than 17.5 cm. This differs widely though in different countries. For example, the standard height of a step is 18 cm in Europe and the USA. In addition to conforming to local norms, the test protocol was adopted because 12 steps, each 17.5 cm high, impose reasonable exercise endurance demands on stroke survivors more realistic than the 2- or 3-step protocols adopted in previous studies (10, 11). The protocol better mimics the real functional needs for activities of daily living. A comparable 12-step test with similar stair dimensions has, however, been used in a previous study (8) of subjects with stroke. The similarity of the findings increases confidence in the applicability and generality of this study’s findings.
The mean STUp-12 times observed in this testing (11.39 s (SD 3.14) were slower than those with 11 steps (1.50 steps/s (SD 0.53) (7) as would be expected, but also slower than previously reported 12-step test times (10.30 s (SD 4.70)) (8). This discrepancy may be due to the different instructions given to the patients. The subjects in this study were instructed to walk comfortably, not at their fastest speed (7, 8). Also, in previous STTotal-12 functional assessments most previous studies have measured ascent or descent time only (7, 8).
The stroke subjects (mean age 57.26 years (SD 7.19)) had a mean score of 26.6 (4.46) in the FMA-LE assessment, indicating that they had moderate motor impairments in their lower extremities (12). The mean FMA-LE score was superior to that typical of chronic stroke subjects approximately 10 years older reported by Sanford et al. (13). Those older subjects were also required to undergo the full FMA instead of just the lower extremity portion, which might also have induced fatigue (13).
The mean dynamometer reading for the knee extensors of the paretic side (15.33 kg (SD 6.22)) was consistent with previous reports (16.90 kg (SD 10.50)), but the hip mean abductor strength (15.33 kg (SD 6.22)) was higher than that observed in Bohannon’s stroke study (11.60 kg (SD 6.30)) (24). The difference in dynamometer positions affected the lever arm and eventually the total force measured, which may explain the inconsistency.
The balance scores observed in this study (mean BBS score, 51.46 (SD 3.46); mean ABC score, 75.19 (SD 15.25)) were consistent with those observed in a study of age-matched, community-dwelling stroke subjects by Ng (mean BBS score, 50.1 (SD 5.1); mean ABC score, 74.0 (SD 18.3)) (25). However, the subjects in this study displayed better balance than the older subjects studied by Salbach’s group (mean age 72 years (SD 11.0); mean BBS score, 41.0 (SD 2.0); mean ABC score, 59.0 (SD 21.0)) (26). The discrepancy may be explained by the relative youth of our subjects (mean age 57.26 years (SD 7.19)), since self-confidence in balance control declines with age and unpleasant personal experiences, and with frequent observation of physical and mental declines and the diminishing health status of peers (27).
The subjects’ mean gait velocity (0.88 m/s (SD 0.27) was consistent with that reported in a previous study (28), but testing can impose anxiety and stress, and this may vary individually and environmentally. It may affect self-selected walking speed and lead to variability (8). These subjects took longer to complete the TUG test (15.97 s (SD 5.40)) than other chronic stroke subjects of similar age (13.70 s (SD 5.70)) (8). One possible reason might be that these subjects were required to perform 6 trials of the test instead of 2 as in Flansbjer’s study (8). They may have felt fatigue, boredom or a loss of attention that would affect the results of multiple repetitions, as suggested by Tyson (29). However, these subjects were faster than subjects with highly spastic plantarflexors (22.6 s (SD 8.6)) (22).
Reliability of the test times
The results clearly showed excellent intra-rater, inter-rater and test-retest reliability (all ICCs > 0.95). Excellent and consistent reliability (with ICCs > 0.92) have been reported in other studies of subjects with chronic stroke, including with an 11-step stair test by Faria et al. (7) and a 12-step stair test by Flansbjer’s group (8). Slightly lower ICC values have been reported in stair-walking tests after joint replacement by a group led by Kennedy (30) (ICC > 0.90) and by Almeida et al. (9) (ICC > 0.89), as well as with frail and healthy elderly subjects (ICC range, 0.54–0.63) (10, 11).
The excellent reliability achieved may be partly a result of the study’s design, the use of standardized instructions and the homogenous sample. Hopkins has recommended a sample size of at least 30 and that at least 3 trials should be used for a reasonable estimation of reliability (31). This study’s sample size of 35 and its 3 trials would therefore be expected to give reasonably high reliability. The use of standardized instructions probably also contributed to the excellent reliability measured. A study by Mong’s group (16) has shown that standardized instructions reduce variations in FTSTST results among subjects with chronic stroke. These subjects had had a single episode of stroke at least a year previously. Changes in motor function due to spontaneous recovery following stroke and variation in motor performance were minimized by this selection criterion.
Correlations between test times and other stroke-specific assessment results
FMA-LE scores. As expected, good to excellent negative correlation was found between mean FMA-LE scores and mean STUp-12 times (rs= –0.80, p ≤ 0.001) and STTotal-12 times (rs = –0.77, p ≤ 0.001). The FMA is well known to be a comprehensive quantitative measure of motor impairment following stroke (12). No previous study has investigated the relationship between these 2 variables, but studies have found similar significant positive correlation between Fugl-Meyer scores and walking speed and endurance (32).
Lower limb muscle strength. Surprisingly, no significant correlation was found between hip abductor strength and the STUp-12 times. Only the STTotal-12 times were significantly correlated (rs = –0.33, p ≤ 0.05). Knee extensor strength was not significantly correlated with either stair test time. Those muscles were selected because the hip abductors maintain pelvis stability during walking and help to generate abduction torque during the single limb support phase of stair-walking (33), while knee extensor strength is needed to achieve maximum knee extension velocity while climbing stairs (34). Note, however, that hip abductor strength was assessed in a gravity-eliminated position and isometric muscle strength was measured in the mid-range position only. The measured values may not correctly assess stair-walking performance, as negotiating stairs requires both concentric and eccentric contraction of both agonists and antagonists.
BBS scores. Strong negative correlation was found between the BBS scores and STUp-12 (rs = –0.68, p ≤ 0.001) and STTotal-12 times (rs = –0.70, p ≤ 0.001). The 12-step ascend and descend test requires stepping and turning movements, which involve shifting the centre of gravity in different directions, and this challenged some subjects’ balance ability. In addition, 3 among the 14 BBS test items are also components of the stair test (placing alternate feet on a stool, turning 360º and standing on one leg). The similarity tends to explain the close correlation observed between stair test times and BBS scores.
FTSTST times. Moderate-to-good positive correlation was found between FTSTST times and both STUp-12 times (rs = 0.50, p ≤ 0.05) and STTotal-12 times (rs = 0.52, p ≤ 0.01). This accords with the excellent negative correlation between FTSTST times and BBS scores (rs = –0.84, p ≤ 0.001) documented in Ng’s study (35). Since the BBS scores were strongly correlated with both STUp-12 (rs = 0.68, p ≤ 0.001) and STTotal-12 (rs = –0.70, p ≤ 0.001) times in this study, FTSTST times would also be expected to correlate strongly.
ABC scores. It is somewhat surprising that no significant correlation was found between ABC scores and stair times. Previous studies have revealed that ABC scores are usually significantly correlated with BBS scores (20). The discrepancy in this study might be explained by the fact that the ABC measures feelings of balance efficacy in the activities encountered in daily living (20), which is quite different from the physical performance measured by the BBS (17, 18). According to Clark (36), a lower education level, less monthly income and poor occupational status affect one’s sense of control and eventually of self-efficacy. The socioeconomic status of the subjects was not systematically investigated in this study. This warrants further investigation.
Gait velocity. Moderate-to-good negative correlation was found between gait velocity and both STUp-12 (rs = –0.71, p ≤ 0.001) and STTotal-12 times (rs = –0.74, p ≤ 0.001). This was expected, since gait velocity after stroke is known to correlate significantly with balance performance (37) and FMA-LE results (rs = 0.50–0.61, p ≤ 0.05) (37), and these are significantly correlated with STUp-12 & STTotal-12 times.
TUG Times. Good positive correlation was found between TUG times and both STUp-12 (rs = 0.73, p ≤ 0.001) and STTotal-12 times (rs = 0.76, p ≤ 0.001). Previous studies had already shown that TUG times are significantly correlated with FMA-LE scores (rs = –0.35, p ≤ 0.01) (26), BBS scores (rs = –0.52 to –0.72, p ≤ 0.01) (38) and gait velocity (rs = –0.57 to –0.90) (22, 23) in patients with stroke. All of these were shown to be significantly correlated with STUp-12 and STTotal-12 times in this study.
Cut-off times and sensitivity of the test
This has been the first study to investigate the best cut-off time in the 12-step ascend and descend test to distinguish between healthy elderly subjects and those with stroke. Both STUp-12 and STTotal-12 times discriminated well, with the AUC = 1.00 in both cases. The best cut-off times were 7.51 s in the STUp-12 test, and 15.22 s in the STTotal-12 test.
Study limitations
A 12-step ascend and descend protocol was used in the current study to reflect the situation in Hong Kong and in other countries with similar building standards. Slight variations, particularly in riser height, may be appropriate elsewhere. This study focused only on the time taken to complete the stairs test; walking quality was not considered. This too may be a useful enhancement.
These results should not be generalized to a general stroke population because of the selection criteria used and the relatively small sample size. The correlations observed between stair times and stroke-specific impairments do suggest, however, that further studies with larger samples are warranted in order to investigate the predictive power of such stair tests through multivariate regression analysis. The effect of turning direction and walking speed might also be investigated in a future study.
Conclusion
The 12-step ascend and descend test has excellent intra-rater, inter-rater and test-retest reliability. The test times show moderate-to-high correlation with FMA-LE scores, FTSTST times, BBS scores, gait velocity and TUG times. Cut-off scores of 7.51 s for the STUp-12 and 15.22 s for the STTotal-12 can reliably distinguish the performance of stroke survivors from that of healthy elderly subjects.
The 12-step ascend and descend test is recommended as a reliable clinical test, which is easy-to-administer and inexpensive. The significant correlations between stair test times and stroke-specific impairments indicate that the 12-step test could be used as a clinical tool to assess stair-walking ability after stroke, which is closely related to ability in activities of daily living.
ACKNOWLEDGEMENTS
The authors would like to thank to Dr Raymond C. K. Chung for his statistical advice.
This study was supported by the Health and Health Services Research Fund (reference 08091241) from the Food and Health Bureau, Hong Kong Government to Shamay S. Ng and her team.
REFERENCES

