Lauren V. Fortington, BPO, MHSc1, Pieter U. Dijkstra, PT, PhD1,2, Joline C. Bosmans, PT, PhD1, Wendy J. Post, PhD3 and Jan H. B. Geertzen, MD, PhD1
From the 1Department of Rehabilitation Medicine, 2Department of Oral and Maxillofacial Surgery, University of Groningen, University Medical Center Groningen and 3Department of Behavioural and Social Sciences, University of Groningen, Groningen, The Netherlands
OBJECTIVE: To describe changes in health-related quality of life in people with lower limb amputation, from time of amputation to 18 months, taking into consideration the influence of age and walking distance. In addition, quality of life for people with amputation is compared with the Dutch population norm values.
DESIGN: Multicentre, longitudinal study.
SUBJECTS: All people undergoing first amputation: 106 were referred, of whom 82 were included, mean age 67.8 years (standard deviation; SD 13.0), 67% men. A total of 35 remained in the study at 18 months.
METHODS: Dutch language RAND-36 questionnaire (Research and Development Corporation measure of Quality of Life) was completed at time of amputation, 6 and 18 months after amputation.
RESULTS: Over time, a significant improvement was seen in physical function, social function, pain, vitality, and perceived change in health (all p < 0.001). Subjects over 65 years of age had a poorer outcome compared with people <65 years for physical function only (p < 0.001). Walking distance was associated with improved scores in social function (p = 0.047).
CONCLUSION: Quality of life improved significantly in 5 of 7 domains investigated; most change occurred in the first 6 months. Physical function remained well below population norm values. Different domains may be affected in different ways for older and younger age groups, but this requires further research.
Key words: amputation; quality of life; mobility; prospective studies; longitudinal studies.
J Rehabil Med 2013; 45: 00–00
Guarantor’s address: Lauren V. Fortington, Department of Rehabilitation Medicine, University Medical Centre Groningen, PO Box 30.001, NL-9700 RB Groningen, The Netherlands. E-mail: l.v.fortington@umcg.nl
Accepted Dec 21, 2012; Epub ahead of print Apr 25, 2013
Introduction
Lower limb amputation (LLA) not only results in permanent physical change to an individual, but also has an impact on psychological and social well-being. It can therefore affect a range of factors that contribute to a person’s health-related quality of life (HRQoL) (1, 2). HRQoL is an important indicator of overall health. Research into subjects with LLA reflects the growing emphasis on HRQoL and its increasing use as an outcome measure (3).
HRQoL in people with LLA is generally lower than in control subjects, and lower than population norm values (4, 5), particularly with regard to physical components (6–9). HRQoL following LLA may improve over time; higher scores have been reported by individuals with a longer time since amputation (10, 11). However, most studies of HRQoL following LLA have been cross-sectional in design and have included a majority of subjects who have lived with their amputation for at least 2 years (4–7, 11–13). There remains a gap in research concerning post-operative response and adjustment early after amputation (3, 14, 15). Longitudinal studies extending beyond the post-acute period are needed to substantiate or refute previous cross-sectional findings.
Walking distance is thought to play a key role in independence and HRQoL for people with LLA (13). The ability to walk 500 m was previously proposed as the minimum walking distance needed for independent living (16). It is assumed that this independence is associated with having a positive effect on psychosocial aspects of HRQoL. However, how the influence of walking distance might change over time, and which specific aspects of HRQoL are affected, remains unknown.
Learning to walk with a prosthesis is a laborious task, requiring cognitive ability, conditioning and balance. LLA is most frequently performed in elderly people due to chronic peripheral vascular disease or diabetes (17). The co-morbidities prevalent in this population make regaining walking an even more difficult task. There are additional physical, psychological and social co-morbidities associated with both the underlying cause of the amputation, such as cardiovascular disease, contractures and infection, and with ageing, including arthritis, social isolation, and a reduced capacity for learning. Walking ability in the elderly population is highly varied (18). The elderly person with vascular LLA faces a different set of challenges on HRQoL compared with younger people or those with other causes of amputation, but it is not clear if there is an association between age and HRQoL.
The aim of this study was to describe changes in HRQoL in people with LLA from time of amputation to 18 months, taking into account the influence of age and walking distance. In addition, the HRQoL of subjects with LLA was compared with Dutch population norm values.
Methods
Vascular surgeons from all hospitals in the 3 Northern Provinces of the Netherlands were asked to refer people who were undergoing amputation to this multicentre, longitudinal study from 1 November 2003 to 30 April 2008. Inclusion criteria were: age ≥ 18 years; undergoing primary lower limb amputation (transtibial, knee-disarticulation, transfemoral); undergoing amputation due to vascular disease, infection, or diabetes. Exclusion criteria were: people who had had a previous major amputation on the ipsilateral limb; those who were unable to read/write Dutch, were unwell or showed signs of clinical dementia that prevented completion of questionnaires; and those who were recruited > 5 days after the amputation, due to the risk of recall bias.
The study protocol was approved by the medical ethics committees of participating hospitals. All participants gave informed consent.
Data collection
Questionnaires were completed 1–2 days before amputation. In acute cases, this was not possible, and patients were included up to 5 days after the operation. Questionnaires were sent to participants again at 6 and 18 months post-amputation. Patients were included up to 1 May 2007; some patients had a maximum follow-up time of 1 year due to the study end date.
Outcome measures
Baseline assessment included characteristics (sex, date of birth) and amputation details (date, level, side, cause). At baseline and post-operatively, the primary outcome measure was the Dutch-language RAND-36 (Research and Development Corporation measure of Quality of Life) (19). The RAND-36 is a self-reported questionnaire, similar to the Short-Form 36 (SF-36), which takes approximately 10 min to complete. The questionnaire addresses 9 domains that contribute to HRQoL: physical function, role limitation physical, social function, role limitation emotional, mental health, pain, vitality, general health, and perceived change in health. Scores range from 0 (worst reported health) to 100 (best reported health). The RAND-36 is valid for the Dutch population (20). Participants also answered a (non-validated) question on walking distance, choosing between: unable to walk, < 100 m walking, 100–500 m walking, 500 m to 1 km walking, and > 1 km walking. These categories were re-coded for analysis as non-walker, < 500 m, or ≥ 500 m walking distance.
A study of the Northern Dutch population provided norm values for the RAND-36 (19). The authors were contacted for their original data-set, enabling different age groups to be compared. A minimum age cut-off of 30 years in the norm data was used to correspond with our youngest included patient, who was 30.9 years of age.
Data analysis
Descriptive results are presented as means and standard deviations (SD) for continuous variables, and as number and percentage for categorical variables. Differences between the characteristics of groups were compared using independent samples t-test for age (2 groups), one-way analysis of variance for age and baseline domain scores (3 groups), and χ2 tests for categorical variables.
Changes over time for each domain of the HRQoL were evaluated using multilevel models. These models have not been widely used in amputation outcome research. Multilevel analyses are frequently used for longitudinal data, since they also take the correlation between repeated measures within individuals into account. In this type of analysis, a linear regression model is estimated for each individual, together with the variability between all individuals (21).
A random effects model with unstructured covariance was used, with individuals as the highest level and different time-points as the lowest level. Age was centred at 65 years. In case of significant time effect, predictors (age and walking distance) were added stepwise in the model. Interaction effects for time with age were explored. Walking distance was not analysed with respect to the domain physical function due to substantial overlap of the constructs; the level of amputation was considered instead.
To test for differences in HRQoL scores at 18 months, the means of the norm values were compared with the 95% confidence interval of the LLA population. For each domain, if the mean norm score fell outside this range, the LLA population was considered as significantly different.
Significance for all multilevel analyses was set at 0.05 (two-sided) and was analysed with PASW Statistics 18, mixed models.
Results
Out of 106 referred patients, 82 (77%) were included in the study (Fig. 1). Ten patients were excluded because they were referred too late (> 5 days after the amputation) and 14 patients because they had a previous ipsilateral LLA. Excluded patients were slightly younger than included patients (not significant) and more likely to have had a transfemoral amputation (p = 0.001, Table I). For 7 patients, the study period ended before their 18-month follow-up.
Fig. 1. Flow-chart of participants at each time-point. Flow-chart shows inclusion, drop-out, death and walking ability of participants at each time-point. Solid arrows show the number of people in the improved walking category; dashed arrows show the number in the maintained walking category; and dotted arrows show the number in the reduced walking category.
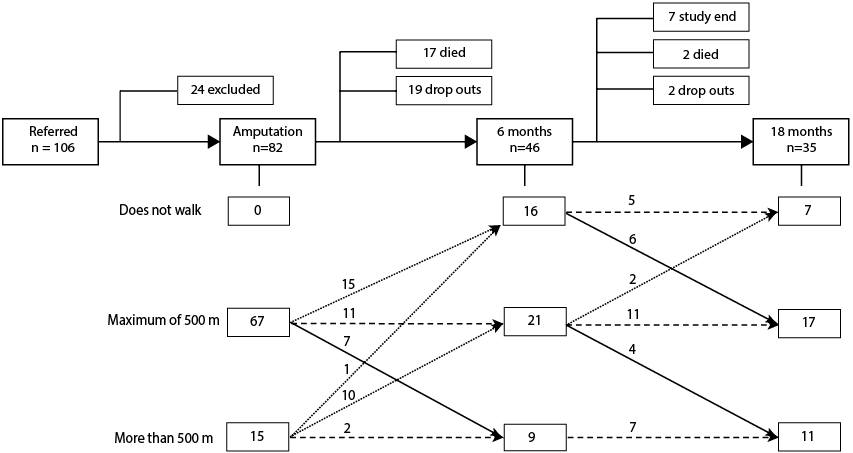
By 18 months, 21 patients had dropped out of the study. They had a median age 10.3 years older than those who remained in the study (not significant) (Table I). Reported reasons for drop-out were worsening of co-morbidities, or patients were no longer interested in participating because they experienced few or no problems. Nineteen patients died before their 18-month follow-up, 17 (90%) of whom were men (p = 0.038). There were no significant differences in age (p = 0.076) or level (p = 0.744) between patients who stayed in the study, died or dropped out.
The domains, role-limitation emotional and role-limitation physical, were not included for analysis. The responses in these domains were frequently missing, dichotomized and were not interpretable.
|
Table I. Characteristics of patients by category at time of amputation: included vs excluded patients; and patients who stayed in study, died or dropped out |
|||||||
|
Included |
Excluded |
p* |
Stayed in |
Died |
Dropped out |
p |
|
|
Patients, n (%) |
82 |
24 |
42 (51) |
19 (23) |
21 (26) |
||
|
Age, years, mean (SD) |
67.8 (13.0) |
64.7 (10.1) |
0.292 |
64.6 (14.2) |
71.4(8.2) |
70.8 (13.0) |
0.076 |
|
Men, n (%) |
55 (67) |
16 (67) |
0.577 |
27 (64) |
17 (90) |
11 (52) |
0.038 |
|
Level of amputation, n (%) |
|||||||
|
Proximal |
30 (37) |
18 (75) |
0.001 |
16 (38) |
8 (29) |
6 (42) |
0.744 |
|
Distal |
52 (63) |
6 (25) |
26 (62) |
11 (71) |
15 (58) |
||
|
RAND-36, mean (SD) |
|||||||
|
Physical function |
8.9 (12.8) |
– |
10.6 (14.3) |
5.6 (8.7) |
7.9 (11.9) |
0.398 |
|
|
Social functioning |
34.7 (31.7) |
– |
29.6 (26.9) |
50.0 (37.5) |
32.1 (34.6) |
0.101 |
|
|
Mental health |
70.7 (20.0) |
– |
68.2 (18.8) |
72.0 (26.2) |
75.7 (13.7) |
0.505 |
|
|
Pain |
26.2 (26.8) |
– |
26.4 (29.5) |
25.5 (25.5) |
26.5 (21.5) |
0.928 |
|
|
Vitality |
47.1 (23.7) |
– |
47.1 (23.2) |
48.8 (25.1) |
45.4 (24.7) |
0.992 |
|
|
General health |
60.5 (20.8) |
– |
63.0 (21.8) |
60.0 (14.9) |
54.3 (23.8) |
0.410 |
|
|
Perceived change in health |
24.3 (25.3) |
– |
26.8 (27.6) |
18.8 (21.4) |
23.2 (22.9) |
0.555 |
|
|
*χ2 for level and sex; age compared using t-test (for included vs excluded); one-way analysis of variance for age and domain scores by end status. RAND-36 (Research and Development Corporation measure of Quality of Life); SD: standard deviation. |
|||||||
There were no statistically significant differences in HRQoL domain scores at time of amputation between patients who stayed in the study, died or dropped out (Table I). In addition, there were no significant differences in domain scores at amputation when comparing by sex or level of amputation or comparing people who completed the questionnaire pre-operatively (n = 59) with those who completed the questionnaire post-operatively (n = 23) (data not shown).
Walking distance for each time-point is shown in Fig 1. All patients reported that they were able to walk at least 500 m before their amputation. In the first 6 months, 26 (32% of all participants; 57% of remaining participants) showed a reduction in walking distance. From 6 to 18 months, walking distance was stable or improved for the majority of participants, with two people declining to a non-walking status.
A statistically significant improvement in mean score from amputation to 6 months and from amputation to 18 months was seen in 5 of the 7 domains evaluated (physical function, social function, vitality, pain and perceived change in health, all p < 0.001) (Table II). Mental health and general health were consistent across all time-points.
|
Table II. Change in health-related quality of life (HRQoL) over time, according to walking ability and age |
|||||
|
Domain |
Independent |
ß |
SE |
95% CI |
p |
|
Physical function |
Constanta |
12.0 |
1.7 |
8.5 to 15.5 |
|
|
Proximal level |
–7.7 |
2.7 |
–13.1 to –2.2 |
0.007 |
|
|
6 months |
21.4 |
3.8 |
13.8 to 29.0 |
< 0.001 |
|
|
18 months |
22.6 |
4.2 |
14.2 to 31.1 |
< 0.001 |
|
|
Age |
–0.4 |
0.1 |
–0.6 to –0.2 |
< 0.001 |
|
|
Social function |
Constantb |
12.5 |
8.6 |
–5.3 to 30.3 |
|
|
6 months |
37.7 |
6.0 |
19.0 to 56.3 |
0.007 |
|
|
18 months |
38.6 |
5.9 |
26.2 to 51.0 |
< 0.001 |
|
|
< 500 m |
20.7 |
8.4 |
3.5 to 38.0 |
0.020 |
|
|
≥ 500 m |
29.6 |
9.3 |
9.3 to 49.8 |
0.008 |
|
|
Mental health |
Constantc |
70.7 |
2.3 |
66.2 to 75.2 |
|
|
6 months |
2.2 |
3.7 |
–5.1 to 9.5 |
0.553 |
|
|
18 months |
5.8 |
4.0 |
–2.1 to 13.6 |
0.148 |
|
|
Pain |
Constantc |
26.2 |
3.2 |
19.8 to 32.6 |
|
|
6 months |
47.8 |
5.2 |
37.4 to 58.2 |
< 0.001 |
|
|
18 months |
42.8 |
5.3 |
32.2 to 53.4 |
< 0.001 |
|
|
Vitality |
Constantc |
47.4 |
2.8 |
41.8 to 53.0 |
|
|
6 months |
18.8 |
3.6 |
11.5 to 26.1 |
< 0.001 |
|
|
18 months |
17.7 |
3.8 |
9.5 to 25.9 |
< 0.001 |
|
|
General health |
Constantc |
60.6 |
2.5 |
55.3 to 65.5 |
|
|
6 months |
3.9 |
3.5 |
–3.2 to –11.0 |
0.273 |
|
|
18 months |
–1.4 |
3.5 |
–8.5 to 5.7 |
0.689 |
|
|
Perceived change in health |
Constantc |
24.3 |
3.0 |
18.3 to 30.3 |
|
|
6 months |
50.0 |
5.2 |
39.5 to 60.5 |
< 0.001 |
|
|
18 months |
42.2 |
5.6 |
30.9 to 53.5 |
< 0.001 |
|
|
aConstant is people aged 65 years, time of amputation, transtibial level. Walking ability was not analysed in respect to physical function due to substantial overlap of the constructs, instead the level of amputation was included. Proximal level refers to people with knee disarticulation or transfemoral level amputation. bConstant is people who did not walk, time of amputation. cConstant is time of amputation. SE: standard error; CI: confidence interval. |
|||||
An ability to walk gave significantly improved scores in social function (p = 0.047). Age was significant factor in HRQoL for physical function (p = 0.001) (Figs 2–3). Physical function was also influenced by level of amputation, people with a knee disarticulation or transfemoral amputation reporting significantly lower scores (–7.7, p = 0.007).
Fig. 2. Change in physical function over time. Solid line shows change in physical function over time for a 65 year old with transtibial amputation. Error bars represent 95% confidence interval of the mean. For each year over 65 years of age scores are: –0.4. For each year under 65 years, scores are: + 0.4 (p < 0.001). For a knee disarticulation or transfemoral amputation scores are: –7.7 (p = 0.007). As example: dashed line represents a 70 year old, with transfemoral amputation
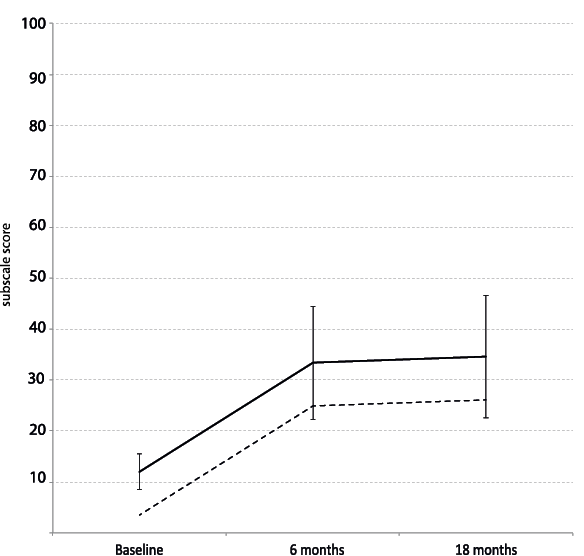
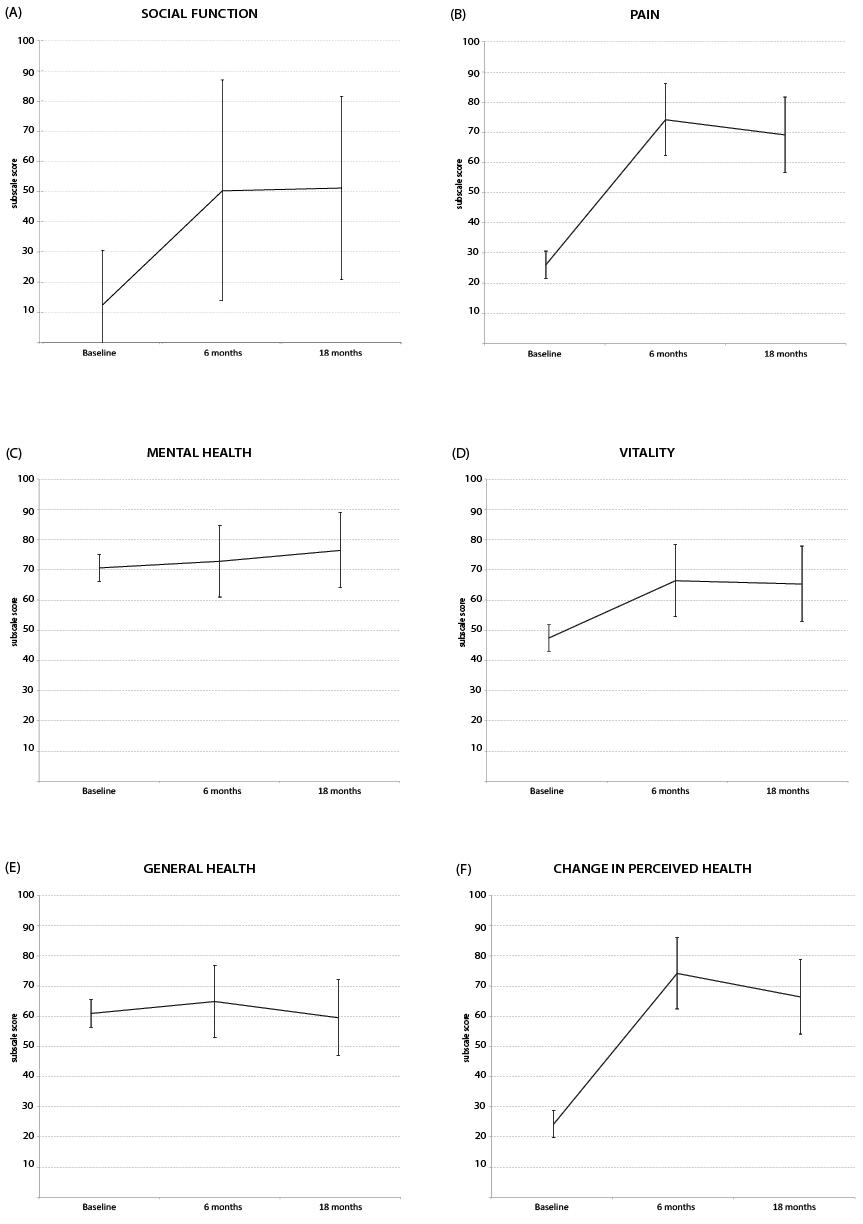
Fig. 3. (A) Change in social function score over time for non-walker with transtibial amputation, error bars represent 95% confidence interval of mean. For cases with walk ability < 500m scores are: + 20.7 (p = 0.020). For cases with walk ability >500m scores are: + 29.6 (p = 0.008). (B) Change in pain scores over time, error bars represent 95% confidence interval of mean. (C) Change in mental health score over time, error bars represent 95% confidence interval of mean. (D) Change in vitality scores over time, error bars represent 95% confidence interval of mean. (E) Change in general health score over time, error bars represent 95% confidence interval of mean. (F) Change in perceived health score over time, error bars represent 95% confidence interval of mean.
Eighteen months after their amputation, people with LLA had significantly poorer HRQoL scores compared with norm values in 3 domains and better scores in perceived change in health (Table III). Mental health, vitality and general health showed no significant differences between people with LLA and norm values. Physical function had the largest difference between mean scores, 43.7 less for people with LLA than norm values.
|
Table III. RAND-36 domain scores at 18 months for people with lower limb amputation (LLA) compared with population normal values (minimum age of 30 years used to correspond with our youngest included patient at 30.9 years) |
|||||||||||
|
All age groups |
≥ 65 years |
< 65 years |
|||||||||
|
LLA (n = 35) Mean (SD) |
95% CI of LLA Mean (SD) |
Population (n = 804) Mean (SD) |
LLA (n = 15) Mean (SD) |
95% CI of LLA Mean (SD) |
Population (n = 170) Mean (SD) |
LLA (n = 20) Mean (SD) |
95% CI of LLA Mean (SD) |
Population (n = 634) Mean (SD) |
|||
|
Physical function |
34.7 (25.8) |
25.5–43.9 |
78.4 (25.2)a |
30.0 (24.1) |
23.1 –51.6 |
62.5 (28.1)a |
37.4 (26.9) |
17.9 –42.1 |
82.6 (22.6)a |
||
|
Social function |
73.2 (26.3) |
64.4–82.0 |
85.2 (22.4)a |
75.9 (23.2) |
59.1 –83.4 |
80.8 (25.7) |
71.3 (28.7) |
63.3 –88.5 |
86.4 (21.3) |
||
|
Mental health |
76.5 (15.3) |
71.1–81.9 |
76.7 (18.5) |
76.4 (15.2) |
67.6 –85.6 |
75.5 (17.3) |
76.6 (15.7) |
69.5 –83.3 |
77.0 (18.8) |
||
|
Pain |
69.3 (24.6) |
60.8–77.8 |
78.8 (25.9)a |
68.9 (25.9) |
54.9 –84.2 |
73.3 (28.7) |
69.6 (24.5) |
58.2 –79.7 |
80.3 (25.0)a |
||
|
Vitality |
64.5 (17.1) |
58.5–70.5 |
66.8 (20.3) |
66.8 (17.8) |
52.7 –73.8 |
63.9 (21.8) |
63.3 (17.0) |
59.4 –74.3 |
67.5 (19.8) |
||
|
General health |
64.7 (16.0) |
59.1–70.3 |
69.4 (23.1) |
68.2 (14.7) |
54.1 –71.4 |
59.7 (23.7) |
62.8 (16.7) |
60.8 –75.5 |
71.9 (22.2) |
||
|
Change in health |
66.4 (28.1) |
56.7–76.1 |
51.2 (18.5)a |
68.8 (24.1) |
51.3 –78.7 |
46.9 (19.2)a |
65.0 (30.8) |
55.3 –82.2 |
52.4 (18.1)a |
||
|
aPopulation mean falls outside 95% confidence interval of LLA population at 18 months. All ages: n = 804, 35% men, median (IQR) = 50 years (38–63); ≥ 65 years: n = 170, 37% men, median (IQR) = 71 years (68–76); < 65 years: n = 634, 34% men, median (IQR) = 45 years (36–53). RAND-36 (Research and Development Corporation measure of Quality of Life); SD: standard deviation; CI: confidence interval; IQR: interquartile range. |
|||||||||||
The difference in mean scores for the all-age population was not statistically significant for social function and pain when considering the age-specific values for people aged 65 years and over.
Discussion
The results of this study show that substantial improvements in HRQoL can be achieved after LLA. HRQoL scores were reflective of the difficult situation faced at the time of amputation; with only mental health and general health scoring over 50 (out of 100). However, for people who survive, significant improvements are gained across the differing domains, with most change evident in the first 6 months. While realizing that it is not always clear who will survive the post-operative period, for those who do, their situation can improve substantially within a relatively short time. With the exception of physical function, domain scores differed little from the population norm values after 6–18 months.
Previously, this positive change could only be inferred from cross-sectional studies, which show that people with longer time since amputation report higher HRQoL than those with more recent amputation (10, 11). The impact of time has been considered in relation to depression, anxiety, problems with sex and relationships, and body image, with findings suggestive that these aspects become evident only after 6–24 months (1, 22, 23). However, those studies were all conducted in relatively young populations with LLA, with a mean age less than 60 years. The population investigated can have an important impact on the outcomes. In general, older people with LLA have different coping strategies, resilience and goals (24). During the first year after amputation, people with vascular-related LLA may undergo less change than people with traumatic LLA (25). Although HRQoL shows changes over time, the contrasting findings from this and other studies, specifically with reference to which aspects are changing and when, needs further investigation.
The increase in HRQoL over time for this population may occur as the amputation signals the end of a long period of pain, infection, immobility and hospitalization. After surgery and a period of rehabilitation, many patients are able to return home, possibly with greater mobility than prior to the amputation. Events leading up to the amputation may have had an important influence on the baseline scores, such as the number of previous procedures or the duration of hospitalization. These events could not be evaluated in the current study. The improvement in scores may also occur from a response shift, reported previously in LLA populations (1, 11, 26). After experiencing an event such as amputation, expectations and importance of different aspects of HRQoL are altered (27). Any given score at the time of amputation may not have the same meaning for an individual 6 or 18 months later. The importance given to a specific domain may also change; for example, social function may be considered less important compared with physical function at the time of amputation, increasing or decreasing in its relative importance over time. The influence that a response shift may have on longitudinal patient-reported HRQoL scores, particularly in elderly patients, is unclear (28) and may result in an over- or under-estimation of HRQoL.
Physical function for all participants remained very poor, especially in comparison with norm values. The low scores observed at the time of amputation were in accordance with those previously reported using the RAND-36 for 16 patients with vascular LLA (29). Unfortunately, important details from that study are missing (time since amputation, level of amputation), and thus further comparison is not possible. Physical function scores 18 months after LLA were lower than observed in other studies using the RAND-36. However, those studies had highly selected populations of people who walk with a prosthesis (13), a high proportion of people with LLA due to trauma and who were of working age (7). Those populations are generally healthier than a population with vascular-related LLA, so it was not surprising that participants in the current study had poorer physical scores.
Despite the low physical function, other domains were comparable with population norm values. The idea that mobility enables independence, and this in turn translates to a higher HRQoL (11, 13, 16, 30), was not seen in this population, with only social function improving with walking ability. A walking distance of more or less than 500 m was the most important determinant of HRQoL in a study investigating phantom pain and other determinants of HRQoL (13). The majority of that population were prosthetic users and only half had undergone amputation due to a vascular-related cause. Our population consisted only of people with vascular-related LLA, not all of whom walked. One explanation might be that HRQoL is linked to walking distance only when focussing on a population who actually walk, the inclusion of non-walking participants negating this link. We did not have enough non-walking participants to examine this idea with more certainty.
With the exception of physical function, no significant differences between age groups over time were seen in the regression equations. However, comparing age-specific domain scores with norm values suggests there are indeed differences in how older and younger people perceive HRQoL after LLA. For example, social function for the all-age group differed significantly from norm values, but when these results are broken into age-specific groups the differences were no longer apparent. The importance of a social network has been reported previously for people with LLA (12), but it also might be linked to age-appropriate comparisons. Age is thought to be an important determinant of many outcomes after LLA, for example walking ability, yet few studies have looked specifically at different age groups, particularly elderly people (18). It seems there may be important age-specific variations in HRQoL after LLA that warrant further attention. Looking at the influence of time on HRQoL, age should be explored further, as it may translate to different time-dependent HRQoL outcomes that can be targeted during rehabilitation and long-term care.
The lack of differences by age and walking ability seen in the regression model may also be accounted for by the small sample size (although for a longitudinal study of LLA, the sample size can be considered relatively large).
The elderly person with vascular LLA is often excluded from research, due to limitations in study designs, such as selection bias and recruitment settings (3, 5, 6, 13). Investigations of HRQoL that include the elderly person with vascular LLA would not only increase the sample size, but also enable results to be more widely generalized.
The influence of time, age and walking ability on HRQoL were considered. Previously investigated determinants of HRQoL in patients with amputation have included sex, amputation level and cause, phantom pain, stump pain, phantom sensations, sexual satisfaction, depression and social setting (3). Our findings concerning time, walking ability and age should be considered, knowing that a range of other factors might also play a role, and with research into HRQoL in people with LLA still very much in its infancy.
To incorporate a representative sample of all people undergoing vascular-related amputations, there were minimal exclusion criteria. However, a substantial number of patients were still missed from the study and selection bias was evident; the expected population for the region being 6 years older with a mean age of 74.0 years (SD 11.2) (31) (current study 67.8 years (SD 13.0) ), with 46% of amputations being transfemoral/knee disarticulations (compared with 37% in the current study). Participants were referred from hospitals across 3 provinces, and potential differences in pre- and post-amputation care may also have had an impact on HRQoL.
For longitudinal data, a multilevel model gives unbiased results if there is missing at random data (32). In our data, the baseline characteristics did not differ significantly by status (stayed in study, dropped out or died), indicating that, in the beginning, all patients had a similar risk of drop-out (due to death or other reasons). However, quality of life is likely to be related to the probability of dropping out due to morbidity or death. We are therefore aware that the assumption of missing at random might be not true in our data. The sample size of our study, however, is too small to perform more sophisticated analyses. In a post-hoc analysis of data for the 35 participants who remained in the study at 18 months, a similar pattern of improvement in HRQoL results was seen. This indicates that the improvement in HRQoL was not attributable to patients with a poorer health status dropping out or dying.
The RAND-36 is a generic health status questionnaire. Results can therefore be compared across different populations, both healthy and with pathology. However, use of a generic measure does not identify issues that are of specific importance for the LLA population. Use of the RAND-36, together with an amputation-specific measure; for example, the Trinity Amputation and Prosthesis Experience Scales (10), is encouraged. This combination will allow comparison with other populations whilst still highlighting problems that are specific for people with LLA.
The population of elderly patients with vascular-related LLA may have found some of the questions of the RAND-36 limiting, as the questionnaire is considered as potentially burdensome for the elderly population (20). In particular, the domains role-limitation emotional and role-limitation physical were unable to be evaluated due to substantial number of missing responses and floor/ceiling effects, which made the results non-interpretable. A Veteran’s version of the RAND-36 has been developed (33) and might be a better alternative for future investigations.
In this longitudinal study, we report a significant improvement in many aspects of HRQoL after LLA, with most change evident in the first 6 months. Use of multilevel analysis incorporated results from all patients, including those who later dropped out of the study or died. For elderly patients, physical function was rated very poorly, but the remaining domains of HRQoL did not differ or were better than norm values. Younger patients differed from the norm values in physical function and pain. The ability to walk was linked only to social function; the distance walked did not matter. Time, age and walking distance are just 3 of many factors to be considered when evaluating HRQoL after LLA.
Acknowledgements
The authors would like to thank all patients and clinical staff for their participation. We also extend our appreciation to the authors of the population norm values of the RAND-36 for providing us with relevant data for comparison (19).
REFERENCES

