Merel Bijleveld-Uitman, MSc1, Ingrid van de Port, PhD1,3 and Gert Kwakkel, PhD1,2
From the 1Centre of Excellence for Rehabilitation Medicine Utrecht, Rehabilitation Centre De Hoogstraat and Rudolf Magnus Institute, University Medical Centre Utrecht, Utrecht, 2Department of Rehabilitation Medicine, Research Institute Movem Amsterdam, VU University Medical Centre, Amsterdam and 3Revant Rehabilitation Centre Breda, Breda, The Netherlands
OBJECTIVE: To determine if gait speed or walking distance is a better predictor for community walking after stroke.
METHODS: Data from the FIT-Stroke trial were used in a cross-sectional design. Community walking was measured with a self-administered questionnaire. The 5-m timed walk and the 6-min walk were used to assess gait speed and walking distance. With bivariate regression analyses the association between gait speed or walking distance and community walking was tested and possible confounders were identified. Discriminative properties of gait speed and walking distance for community walking were investigated by means of receiver operating characteristic (ROC) curves.
RESULTS: 79% of 241 patients were classified as community walkers. Standing balance, fear of falling and time post-stroke were found to be significant confounders in the relationship between gait speed and community walking. No significant confounders were found for the association between walking distance and community walking. There was no significant difference between the area under the curve of the ROC curves of gait speed (0.86), walking distance (0.89) and gait speed adjusted for confounding (0.89).
CONCLUSION: Gait speed and walking distance are equally appropriate predictors for community walking after stroke, whereas the contribution of confounders is limited.
Key words: stroke; community walking; ambulation; gait speed; walking distance; confounding factors; outcome.
J Rehabil Med 2013; 45: 00–00
Correspondence address: Gert Kwakkel, Department of Rehabilitation Medicine, Research Institute Move Amsterdam, VU University Medical Centre, De Boelelaan 1117, NL-1081 HV Amsterdam, The Netherlands. E-mail: g.kwakkel@vumc.nl
Accepted Jan 7, 2013; Epub ahead of print Apr 12, 2013
Introduction
The worldwide burden of stroke is high. It is one of the leading causes of acquired disability, and in low-to-middle-income countries incidence rates have increased substantially over the past 40 years, while, on the other hand, incidence rates in high-income countries have decreased (1). Nevertheless, in the Netherlands the number of patients with a stroke is expected to rise continuously until the year 2020 (2).
A qualitative patient-centred study by Pound et al. (3) suggests that the loss of independent ambulation is perceived as the most disabling consequence of stroke, which affects almost every aspect of activities of daily living. Approximately 80% of patients regain independent gait, expressed as a Functional Ambulation Categories score of 4 or higher, suggesting that the patient can walk independently and safely on level ground (4, 5). Despite this relatively large proportion, 32% (4) to 47% (6) of patients were not able to walk unsupervised in their own community again after stroke. Obviously, patient’s ability to walk in the community is not exclusively determined by their walking ability (7, 8). For example, a number of studies has shown that gait speed is a reliable and valid measure of mobility that genuinely reflects the quality of gait (9–11) and is highly associated with different levels of community ambulation (4, 6, 12). However, it has been suggested that gait speed is often obtained over short distances and overestimates the long-distance walking capacity of stroke patients (13). With that, walking distance might be a better predictor for community walking than gait speed (14, 15). Besides this, in literature several factors are mentioned as possible confounders in the relationship between, on the one hand, gait speed or walking distance, and, on the other hand, community walking. For example balance (12, 15), motor function (12), fear of falling (16), depression (7), fatigue (17) and using walking aids (12) may prevent patients from walking in their own community again after stroke. Knowledge of these factors may enable clinicians to better identify those patients who are predicted as community walkers, but who have failed to achieve this in reality.
The main aim of the present study was to determine whether gait speed or walking distance was a more accurate predictor to establish patients’ ability to walk in their own communities. For this objective the proportion of community walkers in stroke patients who are independently living in their own home after finishing their rehabilitation was established and factors were identified that were considered to be potential confounders for the bivariate relationship between, on the one hand, gait speed or walking distance and, on the other hand, community walking.
Based on the literature we expected to find a proportion of 60–80% of the community walkers within our study population (4, 12). We hypothesized that walking distance, measured with the 6-min walk test, is a significantly better predictor for community walking compared with gait speed alone. In addition, we hypothesized that hemi-neglect, strength of the paretic leg, using walking aids, standing balance, fear of falling, anxiety, depression, fatigue and certain patient and stroke-specific characteristics, are factors that significantly confound the association between walking distance and patients’ ability to walk in the community.
Methods
Design
Data from the FIT-Stroke trial (18) were used. The FIT-Stroke trial is a multicentre randomized controlled trial studying the effect of task-oriented circuit class training compared with usual physiotherapy in terms of self-reported walking competency for patients discharged from a rehabilitation centre to their own home over 24 weeks. The study was conducted in 9 selected rehabilitation centres in The Netherlands (“De Hoogstraat”, Utrecht; “Heliomare”, Wijk aan Zee; “Rijnlands Revalidatiecentrum”, Leiden; “Sophia Revalidatie”, Den Haag; “Stichting Revalidatie Breda”, Breda; “Via Reva/Kastanjehof”, Apeldoorn; “Roessingh”, Enschede; “De Trappenberg”, Huizen; and “Vogellanden”, Zwolle). Patients were included from June 2008 until December 2010. A more detailed description of the design of the FIT-Stroke trial has been reported previously (18). The medical ethics committee of the University Medical Centre Utrecht and the participating rehabilitation centres approved the FIT-Stroke trial. The trial is registered in the Dutch Trial Register (NTR1534) (18). In the present cross-sectional analysis follow-up data of the FIT-Stroke trial, measured at 24 weeks after randomization, were used.
Subjects
All subjects completed an in- and outpatient rehabilitation programme in 1 of the 9 rehabilitation centres. Subjects who participated in the FIT-Stroke trial met the following inclusion criteria: verified stroke according to the World Health Organization definition (19), ability to walk a minimum of 10 m without physical assistance from a therapist (Functional Ambulation Categories ≥ 3), discharged home from a rehabilitation centre, need to continue physiotherapy during outpatient care to improve walking competency and/or physical condition, giving informed consent and being motivated to participate in 24 fitness training sessions over a 12-week period, or in usual care. Patients were excluded if they had severe cognitive deficits as evaluated by the Mini-Mental State Examination (< 24 points), were unable to communicate (i.e. < 4 points on the Utrechts Communicatie Onderzoek) or lived more than 30 km from the rehabilitation centre. Before discharge from an inpatient rehabilitation setting, patients were recruited by their own physician, and after they had given written informed consent, an observer verified if all inclusion criteria were met to participate in the trial.
Measurements
Three trained research assistants carried out the measurements at patients’ own homes or at the rehabilitation centre. Per patient all measurements were made by the same research assistant.
Dependent variable
Community ambulation. In the present study community ambulation served as the dependent variable in the derived association model. Community ambulation was defined as “independent mobility outside the home, which includes the ability to confidently negotiate uneven terrain, private venues, shopping centres and other public venues” (4). To establish the proportion of community walkers within our study population, patients were distinguished in community walkers vs non-community walkers on the basis of a short, self-administered questionnaire, which was used before by Lord et al. (4) and van de Port et al. (12). According to the questionnaire patients were classified into 4 categories: (i) the patient was unable to walk outside; (ii) the patient could walk outside, e.g. as far as the car or post-box in front of the house without physical assistance or supervision; (iii) the patient could walk in the immediate environment (e.g. down the road, around the block) without physical assistance or supervision; (iv) the patient could walk to shops, friends’ houses or activities in the vicinity without physical assistance or supervision. Subsequently, the results were dichotomized to apply them to the association model. Like in earlier studies (4, 12) only patients who could walk to shops, friends’ houses or activities in the vicinity without help (category (iv)) were considered to be independent community walkers, while patients in the other categories were classified as non-community walkers.
Independent variables
Gait speed. Gait speed served as one of the independent variables in the regression analysis and was measured by means of the 5-m timed walk (20). The mean speed of 3 repeated measurements was calculated. Patients were instructed to walk at a comfortable speed. Using a digital stopwatch that records time within 0.01 s, timing was manually started at the “go” instruction and stopped when the subject crosses the 5-m mark. The 5-m timed walk has been shown to be a reliable method to asses gait speed (20).
Walking distance. Walking distance served as another independent variable in the regression analysis and was assessed by the 6-min walk test (6MWT) (21). Patients were instructed to walk 6 min at comfortable speed and to rest or stop walking when needed, but they were encouraged to re-start walking as soon as possible. Furthermore, they were instructed not to run or jog. The 6MWT has been shown to be reliable and responsive and is related to other measures of walking ability and function (22). Furthermore, it is also highly reproducible and responsive when used in the patient’s own home environment (23).
Tested covariates
On the basis of literature mentioned in the introduction, and clinical grounds, the following variables were considered to be factors that may distort the relationship between gait speed or walking distance and community walking: age, gender, type of stroke, affected hemisphere, strength of paretic leg, standing balance, hemi-neglect, fear of falling, depression and anxiety, fatigue, physical activity before stroke, number of co-morbidities, time post-stroke, place of residence (rural vs urban), living status (with or without partner) and use of walking aids.
Part of the data was collected from medical dossiers: age, gender, type of stroke, affected hemisphere and time post-stroke. Subjects were asked about their place of residence, living status, use of walking aids and physical activity before stroke, i.e. conducting sports before stroke. The number of co-morbidities was determined by use of the Cumulative Illness Rating Scale (24). The other data are described elsewhere (18) and summarized below.
Strength of paretic leg. Strength of the lower extremity was determined with the Motricity Index (MI) of the leg (25). The MI contains an ordinal 6-point scale with scores ranging from 0 (no activity) to 33 (maximum muscle force). The MI is valid and reliable (25).
Standing balance. The Timed Balance Test (TBT) was used to assess balance. The TBT consists of 5 different components on an ordinal scale and involves timed balance on progressively diminishing support surfaces.
Hemi-neglect. Hemi-neglect will be measured by the letter cancellation task (26) and will be scored positive when patients score 3 omissions or more on one side, compared with the other side.
Fear of falling. The Falls Efficacy Scale (FES) was used to measure fear of falling. The operational definition of this fear is “low perceived self-efficacy at avoiding falls during essential, non-hazardous activities of daily living” (27). The confidence in completing each activity without falling is rated on a 10-point scale, varying from “not at all confident” to “completely confident”. The FES has been shown to be reliable (28).
Anxiety and depression. Anxiety and depression were measured with the Hospital Anxiety and Depression Scale (HADS). The HADS contains two 7-item scales: one for anxiety and one for depression, both with a score range of 0–21. HADS has been shown to be valid, reliable and sensitive to change; furthermore, it is widely used as a screening questionnaire for depression (29, 30).
Fatigue. The impact of fatigue was assessed with the Fatigue Severity Scale (FSS). It contains 9 questions with scores ranging from 1 to 7. The FSS was originally developed for use in patients with multiple sclerosis, but has been used previously in stroke patients (17, 31).
Statistics
First the proportion of patients classified as community walker was counted and the strength of association between gait speed or walking distance to classify community walkers from non-community walkers was determined by a bivariate logistic regression analysis. Subsequently, the discriminative properties of gait speed and walking distance for community walking were investigated by applying a receiver operating characteristic (ROC) curve (32). For this purpose, the area under the curve (AUC), sensitivity, specificity, positive predictive value (PPV), negative predictive value (NPV) and accuracy were calculated. The ROC curves of both models were graphically displayed and tested to assess if the AUC for gait speed was significantly different from that of walking distance. Models were significantly different if z ≥ 1.96. The paired z-score between both models was calculated by the equation: z = AUC1–AUC2/√(SE12+SE22–2rSE1SE2), with r as the Pearson product moment correlation coefficient between the model for gait speed compared with the model for walking distance (33).
In order to investigate confounders in the bivariate relationship between, on the one hand, gait speed or walking distance, and, on the other hand, community walking, each candidate covariate, was separately added to the bivariate regression model that included gait speed or walking distance. If the regression coefficient of gait speed or walking distance with community walking changed by more than 10% the variable was classified as significant (34). Finally, for the model including the relevant covariates (i.e. adjusted model) a ROC curve was derived and discriminative properties were calculated.
A two-tailed significance level of 0.05 was used for all tests. All data analyses were performed with SPSS version 18.
Results
A total of 250 stroke patients were included in the FIT-Stroke trial (35). Twenty-four weeks after randomization 8 patients were lost to follow-up or discontinued the intervention, because they died (n = 2), had a recurrent stroke (n = 2), or for unknown reasons (n = 4) (35). One patient was not able to carry out the 6MWT, due to cardiac complaints. Because of that all data for the present study were complete for 241 cases. In total, 66% of these subjects were male and the mean age was 58.1 years with a standard deviation (SD) of 10.3. The right hemisphere was affected most (46.5%) and the majority of patients had had an infarction (81.3%). Mean time post-stroke was 8.7 months (SD 1.5). An overview of these and other characteristics is given in Table I.
|
Table I. Patient characteristics of the 241 patients |
|
|
Characteristics |
|
|
Gender, female/male, n |
83/158 |
|
Age, years, mean (SD) |
58.1 (10.3) |
|
Living status, alone/with partner, n |
42/199 |
|
Place of residence, urban/rural, n |
216/25 |
|
Type of stroke, infarction/haemorrhage, n |
196/45 |
|
Affected hemisphere, right/left/othera, n |
112/87/42 |
|
Co-morbidities, n, mean (SD) |
3.2 (1.7) |
|
Time post-stroke, months, mean (SD) |
8.7 (1.5) |
|
Hemi-neglect, n (%) |
18 (7.5) |
|
MI paretic leg, mean (SD) |
72.5 (20.5) |
|
Use of walking aid, n (%) |
75 (31.1) |
|
Physical activity before stroke, n (%) |
140 (58.1) |
|
TBT score, mean (SD) |
3.6 (1.5) |
|
FES score, mean (SD) |
104.1 (21.3) |
|
HADS anxiety score, mean (SD) |
3.7 (3.3) |
|
HADS depression score, mean (SD) |
4.4 (3.8) |
|
FSS score, mean (SD) |
4.1 (1.7) |
|
Gait speed, m/s, mean (SD) |
1.0 (0.4) |
|
6MWT, m, mean (SD) |
391.7 (136.7) |
|
a”Other”, strokes located in brainstem, cerebellum or both hemispheres. SD: standard deviation; MI: Motricity Index (range 0–100); TBT: Timed Balance Test (range 0–5); FES: Falls Efficacy Scale (range 0–130); HADS: Hospital Anxiety and Depression Scale (both subscales range 0–21); FSS: Fatigue Severity Scale (range 1–7); 6MWT: 6-min walk test. |
|
According to the questionnaire concerning community ambulation 191 subjects (79.3%) were classified as community walkers, whereas 50 subjects (20.7%) were classified as non-community walkers.
Table II shows the statistically significant associations between gait speed and community walking and between walking distance and community walking (p < 0.001).
|
Table II. Bivariate logistic regression analysis |
||||||
|
Variables in the model |
Confounder ß (SE) |
Gait speed ß (SE) |
Proportional change in coefficient of gait speed % |
Confounder ß (SE) |
Walking distance ß (SE) |
Proportional change in coefficient of walking distance % |
|
Gait speed |
4.981 (0.712)* |
|||||
|
Walking distance |
0.014 (0.002)* |
|||||
|
Covariates |
||||||
|
Gender |
–0.749 (0.407) |
5.011 (0.728)* |
< 1.0 |
–0.872 (0.434)* |
0.015 (0.002)* |
7.1 |
|
Age |
–0.002 (0.019) |
4.980 (0.712)* |
< 1.0 |
–0.001 (0.020) |
0.014 (0.002)* |
0 |
|
Living status |
–0.777 (0.593) |
4.937 (0.708)* |
< 1.0 |
–0.773 (0.616) |
0.014 (0.002)* |
0 |
|
Place of residence |
–0.234 (0.706) |
4.963 (0.711)* |
< 1.0 |
–0.333 (0.723) |
0.014 (0.002)* |
0 |
|
Type of stroke |
–0.668 (0.575) |
5.091 (0.724)* |
2.2 |
–0.851 (0.646) |
0.015 (0.002)* |
7.1 |
|
Affected hemispherea |
0.369 (0.459) |
5.478 (0.848)* |
1.6 |
0.401 (0.476) |
0.015 (0.002)* |
0 |
|
Number of co-morbidities |
–0.182 (0.115) |
5.052 (0.725)* |
1.4 |
–0.137 (0.118) |
0.015 (0.002)* |
7.1 |
|
Time post-stroke |
–0.341 (0.146)* |
4.295 (0.746)* |
13.8 |
–0.304 (0.151) |
0.013 (0.002)* |
7.1 |
|
Hemi-neglect |
–0.720 (0.606) |
5.011 (0.717)* |
< 1.0 |
–0.613 (0.629) |
0.015 (0.002)* |
7.1 |
|
Strength of paretic leg |
0.008 (0.012) |
4.643 (0.851)* |
6.8 |
0.002 (0.012) |
0.014 (0.002)* |
0 |
|
Use of walking aid |
–0.214 (0.498) |
4.751 (0.881)* |
4.6 |
–0.017 (0.503) |
0.014 (0.002)* |
0 |
|
Physical activity before stroke |
0.055 (0.411) |
4.990 (0.715)* |
< 1.0 |
0.114 (0.432) |
0.015 (0.002)* |
7.1 |
|
Standing balance |
0.413 (0.156)* |
4.094 (0.758)* |
17.8 |
0.399 (0.160)* |
0.013 (0.002)* |
7.1 |
|
Fear of falling |
0.020 (0.010)* |
4.473 (0.745)* |
10.2 |
0.014 (0.010) |
0.014 (0.002)* |
0 |
|
Anxiety |
–0.163 (0.058)* |
4.926 (0.723)* |
1.1 |
–0.128 (0.061)* |
0.014 (0.002)* |
0 |
|
Depression |
–0.115 (0.048)* |
4.924 (0.726)* |
1.1 |
–0.095 (0.052) |
0.014 (0.002)* |
0 |
|
Fatigue |
–0.182 (0.123) |
5.100 (0.726)* |
2.4 |
–0.119 (0.130) |
0.015 (0.002)* |
7.1 |
|
*p < 0.05. an = 199, proportional change compared with ß adjusted for number of patients. In Bold: change of the regression coefficient of more than 10%. MI: Motricity Index; SE: standard error. |
||||||
Fig. 1 shows the ROC curves of gait speed and walking distance for community walking. Table III shows the discriminative properties in terms of AUC, accuracy, sensitivity, specificity, PPV and NPV of these variables, where community walking is considered positive and non-community walking negative. Optimal cut-off scores for community walking of 0.78 m/s for gait speed and 367.5 m for walking distance were found, with a sensitivity of 0.89 (95% confidence interval (CI): 0.85–0.91) and 0.75 (95% CI: 0.72–0.77), respectively. Specificity ranged from 0.70 (95% CI: 0.58–0.80) for gait speed to 0.86 (95% CI: 0.74–0.94) for walking distance (Table III).
Comparison of the derived ROC curves showed that the AUC was not significantly different between gait speed and walking distance (Z = 1.59, p = 0.1).
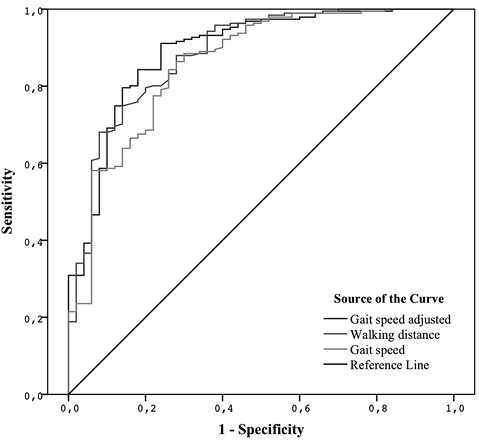
Fig. 1. Receiver operating characteristic (ROC) curve analyses of assessment of dichotomized community ambulation with gait speed, walking distance and the adjusted model for gait speed. No significant covariates were found that influenced the bivariate association between walking distance and community walking.
Table II shows the covariates that changed the significant bivariate association between gait speed and community walking and walking distance and community walking. Time post-stroke, standing balance and fear of falling gave a more than 10% change in the regression coefficient of gait speed. There were no factors found that influenced the regression coefficient of walking distance with community walking by more than 10%. Again, Fig. 1 and Table III show the ROC curve and the discriminative properties of the adjusted model for gait speed after adding the significant covariates.
|
Table III. Predictive value of gait speed, walking distance and the adjusted model for gait speed |
||||||||||
|
Measurement |
True negatives |
False negatives |
True positives |
False positives |
Area under the curve (95% CI) |
Accuracy (95% CI) |
Sensitivity (95% CI) |
Specificity (95% CI) |
PPV (95% CI) |
NPV (95% CI) |
|
Gait speed |
35 |
22 |
169 |
15 |
0.86 (0.80–0.92) |
0.85 (0.80–0.89) |
0.89 (0.85–0.91) |
0.70 (0.58–0.80) |
0.92 (0.89–0.95) |
0.61 (0.51–0.70) |
|
Walking distance |
43 |
48 |
143 |
7 |
0.89 (0.83–0.94) |
0.77 (0.72–0.80) |
0.75 (0.72–0.77) |
0.86 (0.74–0.94) |
0.95 (0.91–0.98) |
0.47 (0.41–0.51) |
|
Adjusted model for gait speed |
38 |
17 |
174 |
12 |
0.89 (0.84–0.95) |
0.88 (0.83–0.92) |
0.91 (0.88–0.93) |
0.76 (0.64–0.85) |
0.94 (0.90–0.96) |
0.69 (0.59–0.77) |
|
CI: confidence interval; PPV: positive predictive value; NPV: negative predictive value. |
||||||||||
The AUC between gait speed and the adjusted model for gait speed (Z = 1.70, p = 0.09) and walking distance and the adjusted model for gait speed (Z = 0.33, p = 0.7) showed no significant differences.
Discussion
The present study shows that gait speed is an equally accurate predictor for community walking as walking distance in mildly to moderately affected patients approximately 9 months post-stroke. Obviously, both outcomes for measuring walking competency after stroke (i.e. gait speed as well as walking distance), are strongly associated with community walking, with an accuracy ranging from 77% to 85%. In addition, it was found that time post-stroke, standing balance and fear of falling are factors that may significantly confound the association between gait speed and community walking. However, the impact of these factors was small, and less than 18% in terms of proportional change. The discriminative ability of gait speed, expressed as the AUC, to predict community walking as a classifier was affected less than 4%. Consequently, the hypothesis that walking distance is a better predictor for community walking after stroke, as was suggested in other studies (14, 15), is not supported by the present study. A possible explanation for this is that gait speed and walking distance, at least partly, measure the same domains in stroke patients (11, 36). However, in the studies of Donovan et al. (14) and Fulk et al. (15) gait speed was measured over a distance of 10 m, which might have resulted in a higher overestimation of the mean gait speed compared with the gait speed over 5 m as used in the present study. The lack of discriminative ability between gait speed and walking distance may be related to the high number of patients with moderate and mild strokes and relatively low number of severe strokes. In particular, in patients with a severe hemiplegia, gait is less efficient and more dependent on patients’ cardio-respiratory fitness (37). Furthermore, earlier studies have suggested that, next to gait speed, other factors, such as balance (12, 15), motor function (12), fear of falling (16), depression (7), fatigue (17) and using walking aids (12) need to be taken into account. Our study suggests that time post-stroke, standing balance and fear of falling significantly influence the relationship of gait speed and community walking. However, after addition of the confounding factors to the regression model there is no significant difference between the AUC of the adjusted model including the covariates and the model including gait speed alone. Therefore, from a pragmatic point of view the use of gait speed to predict community walking is preferred in patients with mild to moderate stroke who are able to walk 10 m independently. Gait speed is easier to measure than walking distance and can also be measured easily when space is limited, for instance at the patient’s home.
It should be noted that the proportion of community walkers in our group of subjects was relatively high (i.e. 79.3%), but in accordance with the percentage van de Port et al. (12) found by using the same definition and questionnaire for community walking in a group of patients 3 years after stroke. Lord et al. (4) used the same classification before and found a percentage of 60.7% community walkers shortly after discharge home. The optimal cut-off point of gait speed for community walking of 0.78 m/s is in line with velocities in prior studies ranging from 0.66 to 1.2 m/s (12, 38, 39). For walking distance a cut-off point of 367.5 m for community walking was found. This corresponds with the mean distance of 367 m, which community-dwelling elderly people walk during a trip outside their homes according to Shumway-Cook et al. (40). No cut-off points for walking distance for community walking were found in the literature, but other studies reported means for the 6MWT of between 216 and 348.6 m (15, 41) in small groups of community-dwelling subjects post-stroke; this is far less than the mean distance of 391.7 m we found. A possible explanation for this difference is the group of relatively well-recovered patients in our study population. However, 391.7 m is still less than the mean distance of 500–700 m that healthy adults walk in 6 min (42, 43).
The present study has some limitations. First, the possible covariates were selected based on the literature and clinical experience, but not all of the potential covariates were measured in the FIT-Stroke trial, for example, cardiorespiratory fitness, cognition and personal factors, such as motivation are considered to be potential covariates, but were not measured. Secondly, the 5-m timed walk was chosen to measure gait speed because measurements were frequently made at the subject’s home, where space was limited. On the one hand it is possible that the short distance overestimated the long-distance walking capacity of subjects, while, on the other hand, starting and stopping within 5 m may lead to an underestimation of gait speed. Thirdly, the classification of community walkers was arbitrary, based on a questionnaire that needs further validation. Only patients who could walk to shops, friends’ houses or activities in the vicinity without help (category iv) were classified as community walkers, this rather strict classification was made because of the relatively mildly affected group of patients and based on prior studies (4, 12), but obviously another classification would have influenced the results. The predictive value of gait speed and walking distance for community walking was statistically analysed by the use of ROC curves, which graphically shows clear differences between these factors. These differences were tested by the method described by Hanley & McNeil (33), which is a well-known method for comparison of ROC curves; however, other methods are available. Finally, as addressed, our results might not be generalizable to other patients with stroke, acknowledging that the present study contained a selected, relatively well-recovered group of patients tested approximately 9 months post-stroke.
In conclusion, gait speed, as well as walking distance, is a good marker to predict community walking after stroke. Time post-stroke, standing balance and fear of falling are factors that may confound the relationship between gait speed and community walking. However, the contribution of these factors is limited and, from a practical point of view, a choice of gait speed to predict community walking is recommended for mildly to moderately affected patients discharged to their own home setting in the community approximately 9 months post-stroke.
ACKNOWLEDGEMENTS
This study is part of the FIT-Stroke trial, which is supported by ZonMw (grant number 80-82310-98-08303).
The authors would like to thank the participants for their willingness to participate and Hanneke Roelse, Lenneke van Kats, and Lotte Wevers for their contributions to the present study.
Conflicts of interest. None of the authors had any financial or personal interest that could inappropriately influence or bias their work.
References

