Eivind Aadland, MSc1, Randi Jepsen, MSc1, John Roger Andersen, PhD1,2 and Sigmund Alfred Anderssen, PhD3,4
From the 1Sogn og Fjordane University College, Faculty of Health Studies, 2 Førde Central Hospital, Department of Surgery, 3Norwegian School of Sport Sciences, Department of Sports Medicine, Oslo and 4Sogn og Fjordane University College, Faculty of Teacher Education and Sports, Sogndal, Norway
OBJECTIVE: To determine the relationship between change in physical activity level and change in directly measured maximal aerobic fitness in severely obese subjects participating in a 1-year lifestyle intervention, and to determine whether change in 6-min walk test (6MWT) could be used as an indicator of change in aerobic fitness.
METHODS: Complete data on aerobic fitness (maximal oxygen consumption (VO2max) and time to exhaustion on the VO2max test), 6MWT, and physical activity (Actigraph GT1M accelerometer) were obtained for 21 subjects (mean age 42.6 years (standard deviation (SD) 11.0 years); mean body mass index 39.6 (SD 4.5) kg/m2). Multiple linear regression (controlling for change in body mass index) was used to analyse the relationships for changes in: (i) physical activity vs aerobic fitness and 6MWT; and (ii) aerobic fitness vs 6MWT.
RESULTS: Change in physical activity level was related to VO2max and time to exhaustion (partial r > 0.63, p < 0.003). No significant relationships were found between changes in aerobic fitness and 6MWT (partial r < 0.22, p > 0.351) or between changes in physical activity level and 6MWT (partial r = 0.15, p = 0.531).
CONCLUSION: Increased physical activity level over 1 year resulted in increased aerobic fitness in severely obese subjects. Although the sample size was small, these results suggest that change in 6MWT might not be a good indicator of maximal change in aerobic fitness in this population.
Key words: physical fitness; cardio-respiratory fitness; 6-minute walk test; exercise; obesity.
J Rehabil Med 2013; 45: 00–00
Correspondence address: Eivind Aadland, Sogn og Fjordane University College, Faculty of Health Studies, Box 523, NO-6803 Førde, Norway. E-mail: eivind.aadland@hisf.no
Accepted May 3, 2013; Epub ahead of print Aug 27, 2013
Introduction
For longevity, aerobic fitness (AF) is more important than obesity (1–3). There is good evidence that physical activity (PA) increases AF (4), among other effects. Interventions that incorporate PA may therefore have a profound effect on health, although, many obese subjects experience a very modest weight loss from PA (5, 6). However, lack of compliance with prescribed PA is probably an important source of variation in the effect of such interventions, and has been shown to undermine the reported effects of weight loss (7, 8). Thus, accurate measurement of completed PA is critical in order to separate the question of whether the intervention was implemented successfully from that of whether a change in PA affects different outcomes. PA should be measured objectively, as there is wide disagreement between self-reported and objective measurements (9, 10).
To the best of our knowledge, only one study has evaluated the relationship between PA and AF in subjects with severe obesity participating in a lifestyle intervention (r = 0.51 between PA intensity and change in AF over 10 months) (11). However, severely obese subjects might achieve smaller improvements in AF than their overweight counterparts (12). Both studies used submaximal measures of AF and relied on subjectively reported PA. The relationship between PA and AF therefore needs to be determined using an objective measure of PA and a direct maximal exercise test.
Simple walk tests are feasible measures of functional walking capacity. The 6-min walk test (6MWT) was developed for use with populations with heart or lung diseases (13), but is now widely used in a variety of groups. In obese subjects, the 6MWT correlates well with relative maximal oxygen consumption (VO2max) (ml/kg/min) (14) and has demonstrated acceptable reliability (15, 16). Thus, this test has been suggested as a useful measure of functional capacity in clinical studies and clinical care. Because the 6MWT is a simple test that is easy to administer, submaximal, non-invasive and inexpensive, it would be useful to determine whether it could be used as a reliable indicator of change in AF in lifestyle interventions for obese adults. A strong relationship (r = 0.85) between change in VO2max and change in 6MWT is shown in obese children over a 2-month intervention period (17); however, these results might be flawed by the application of a submaximal test for estimation of VO2max and the lack of controlling for change in body weight.
Weight loss per se will increase both relative VO2max and walking performance independently of any qualitative PA-induced changes in the muscular, cardio-respiratory or vascular systems (i.e. factors that alter the body’s maximal capacity to perform aerobic work and that may be responsible for protection against cardiovascular disease and mortality (1, 3, 18)). As a result, it may be difficult to determine change in AF beyond the direct effect of weight loss. Consequently, this challenge pertains specifically to weight loss interventions, in which weight loss will systematically bias the results towards improved AF. For example, severely obese patients who had undergone bariatric surgery substantially improved their walking distance on the 6MWT (19, 20); however, they might not have improved their AF beyond what would be expected from their weight loss. Because the protective effect of AF against cardiovascular disease and mortality is independent of obesity (1–3), the evaluation of lifestyle interventions and exercise programmes should aim to determine the effects of AF beyond those due to weight loss.
The main aim of this study was to determine the relationship between change in accelerometer-determined PA level and directly measured AF (VO2max and time to exhaustion (TEX) on the VO2max test) in severely obese subjects participating in a 1-year lifestyle treatment programme. A secondary aim was to determine whether the change in 6MWT could be used as a reliable indicator of change in AF in lifestyle interventions by validating the 6MWT against AF and comparing associations with PA between these measures.
Methods
Subjects
A total of 49 severely obese subjects participated in a lifestyle treatment programme at the Red Cross Haugland Rehabilitation Center (RCHRC) in Flekke, Norway between February 2010 and October 2011. Inclusion criteria were: age between 18 and 60 years, and body mass index (BMI) ≥ 40 kg/m2 with or without comorbidities, or ≥ 35 kg/m2 with comorbidities. Exclusion criteria were: pregnancy, heart disease, drug or alcohol abuse, previous bariatric surgery, and mental or physical health problems that could reduce the subject’s ability to comply with the programme. Written informed consent was obtained from each subject before inclusion in the study. The study met the standards of the Declaration of Helsinki and was approved by the Regional Committee for Medical Research Ethics.
Intervention programme
The intervention consisted of 3 intermittent inpatient periods (the first of 6 weeks duration; followed by 2 periods of 3 weeks duration) over the course of 1 year. The time line of the study was an inpatient period from baseline to 6 weeks, a home period of approximately 14 weeks, an inpatient period from weeks 20 to 23, a home period of approximately 27 weeks and an inpatient period from weeks 50 to 53.
An interdisciplinary team of health professionals (dietician, nurse, physician, physiotherapist and exercise specialist) was responsible for the programme at RCHRC, which had 3 main components: diet, PA and cognitive behavioural therapy. Both theoretical and practical sessions were incorporated. The main goal regarding diet was to introduce a healthy diet and eating pattern to provide each subject with tools to improve the quality of their diet in the long-term. Thus, each subject followed a high-fibre, low-fat, reduced-energy meal plan based on the Nordic Nutrition Recommendations (21), which included 3 main meals and 2–3 snacks each day, and group lessons were taught on how to prepare healthy meals. As such, no specific diet or severe energy restriction was applied. Regarding PA, subjects participated in a supervised, structured exercise programme, consisting of 20–30 min brisk walking before breakfast and 2 exercise sessions of 45–60 min duration (e.g. swimming, aerobics, ball games, hiking or strength training) performed individually or in groups 5 days per week at the RCHRC. No specific target regarding intensity was specified. In addition, subjects were encouraged to perform PA on their own. Together with a team member, each subject developed a plan for PA to be performed at home, adjusted to the subject’s home situation and based on each subject’s opportunities and preferences. The subjects were not offered any systematic follow-up at home, but they could contact the RCHRC or their general practitioner if needed. Thus, no supervised exercise was performed between the in-patient periods.
Procedures
Body weight, waist circumference, body composition and 6MWT were measured every 3 weeks during the inpatient periods, which yielded a total of 7 measurements (baseline and weeks 3, 6, 20, 23, 50 and 53). Height was measured during the first week of the first inpatient period. Maximal oxygen consumption was measured during the first week of inpatient periods 1 and 3. The PA level was measured 1 month prior to the first inpatient period (baseline), during the first inpatient period (week 4), and approximately 1 month before inpatient periods 2 (week 16) and 3 (week 46). To be comparable with VO2max measurements, data obtained at baseline and week 50 were used for BMI and 6MWT in the regression analyses.
Body weight and body composition were measured with subjects in the fasting state, wearing light clothes, in the morning and after voiding. Values were reported to the nearest 0.1 kg using bioelectrical impedance analysis (BC 420 S MA, Tanita Corp, Tokyo, Japan). Height was measured to the nearest 0.5 cm using a wall-mounted stadiometer. The 6MWT was performed in a standardized manner in a 30-m hallway according to established guidelines (13). Maximal oxygen consumption was measured using a modified Balke-protocol. The subjects walked on a treadmill at a constant speed of 4.5 km/h, while the inclination increased 2% every minute, starting at 1%. If a maximal inclination of 15% was reached, the treadmill speed increased by 0.3 km/h every minute thereafter until exhaustion. The protocol was tailored to this group of severely obese subjects to be able to use the same protocol for all subjects to arrive at meaningful comparisons of performance (TEX) between subjects and was pilot-tested in several severely obese subjects prior to the study. Oxygen consumption was measured using the Metamax I and the Metasoft v. 1.11.05 software (Cortex Biophysic, Leipzig, Germany). Barometric pressure was calibrated each test day, and a 1-point gas calibration using ambient air and a volume calibration using a 3 l syringe (SensorMedics Corporation, CA, USA) were performed between tests. The Metamax 1 analyser has been shown to have no systematic error and a random error of 4% compared with the Douglas bag technique (22). A valid test fulfilled 2 out of 4 of the following criteria: a maximal heart rate (HRmax) ≥ 95% of the age-predicted maximum (220–age); a respiratory exchange ratio (RER) ≥ 1.05; a rating of perceived exertion (RPE) (Borg 6–20 scale) ≥ 18; and a plateau (increase of less than 50% of the expected value over ≥ 2 min). This resulted in exclusion of 5 and 1 subjects at the pre- and post-test, respectively. The obtained values (median, 95% confidence interval (CI)) for RPE, HRmax and RER of 19.0 (19.0–20.0) and 20.0 (19.0–20.0); 98.3 (95.9–102.5) and 100.0 (95.4–100.8); 1.07 (1.05–1.09) and 1.11 (1.06–1.11) for the pre- and post-test, respectively, and the corresponding numbers of subjects who achieved a plateau were n = 9 and n = 8. The results are reported as the highest oxygen uptake obtained over a 30-s period (l/min and ml/kg/min) and TEX (s).
Physical activity was measured using an Actigraph GT1M accelerometer (Actigraph, Fort Walton Beach, FL, USA) and analysed with the Actigraph software ActiLife v. 5.3. Each measurement was performed over a 7-d period. Subjects were instructed to wear the accelerometer at all times, except during water activities or while sleeping. A sampling epoch of 10 s was used. A wear-time of ≥ 10 h/day for ≥ 4 days was used as the criterion for a valid measure, whereas periods of ≥ 60 min of consecutive zero counts (allowing for ≤ 2 min of non-zero counts) were defined as non-wear time (23, 24). PA was reported as total PA level (mean counts/min), PA duration and PA intensity. PA duration was reported as min of moderate to vigorous PA per day (MVPA/day) (≥ 3 metabolic equivalents (METs)) using a previously defined cut-off point of ≥ 852 counts/min in these severely obese subjects (25). The applied cut-off point is slightly higher than that reported previously, due to the use of a slightly different model. Data on PA duration were corrected for self-reported duration of swimming, bicycling and resistance training by adding min reported on these activities to the accelerometer-determined min of MVPA/day (26). The intensity of PA was reported as counts/min in bouts of MVPA. The time spent in bouts of MVPA was defined as consecutive time in MVPA of ≥ 10 min duration (allowing for a reduction of ≤ 2 min below the cut-off point).
Because of the small sample size only the change in total PA level was used to determine associations with changes in AF and the 6MWT. These differences were reported as the change from baseline to the mean of measurements 3 and 4. However, data on one measurement (difference from baseline to measurement 3 or 4) were used for those subjects who did not provide data for both measurements (n = 5).
Statistical analysis
The data on subject characteristics and changes over time were normally distributed and are presented as mean (standard deviation (SD)). A repeated linear mixed model based on restricted maximum likelihood estimation was used to analyse changes over time. An unstructured covariance structure was used for PA, whereas an autoregressive structure was used for the anthropometric measures. Post-hoc analyses comparing each time-point against baseline were performed using the Sidak post-hoc test. Maximal exertion on the VO2max tests and group values in the attrition analyses were reported as median and 95% bootstrapped CI because data were skewed. The Mann-Whitney test was used for analysing differences between groups in the attrition analyses.
A linear mixed model based on restricted maximum likelihood estimation was used in the analysis for change in AF. We defined a repeated measures model, and compound symmetry was used as the covariance structure. The difference over time was reported as: (i) the unadjusted effect of time (main effect of time); and (ii) the effect of time adjusted for changes in BMI (the main effect of BMI was included in the model).
A linear regression model was used to evaluate bivariate relationships between variables and relationships between variables controlled for change in BMI. The results are reported as partial correlations (partial r) and p-values. Residuals were normally distributed in all models.
All analyses were performed using SPSS vs 19.0 (SPSS Inc., Chicago, USA). A p-value ≤ 0.05 indicated statistically significant findings.
Results
Subject characteristics
Eleven subjects (4 men and 7 women) were lost to follow-up during the intervention: 1 due to pregnancy, 4 dropped out (of whom, 1 underwent bariatric surgery, 1 had reached his weight goal, and 2 dropped out for unknown reasons), and 6 withdrew from the study (of whom, 4 had problems with the study protocol, and 2 left for unknown reasons). Thus, the following numbers of subjects had valid pre- and post-tests for the different measures: n = 27 for VO2max, n = 35 for the 6MWT, and n = 34 for PA. A final total of 21 subjects provided complete data (5 men and 16 women) (Table I), which formed the basis of all analyses in the present study.
|
Table I. Baseline subject characteristics (n = 21) |
|
|
Total Mean (SD) |
|
|
Age, years |
42.6 (11.0) |
|
Height, cm |
172.8 (7.5) |
|
Weight, kg |
118.2 (14.4) |
|
WC, cm |
124.9 (12.1) |
|
BMI, kg/m2 |
39.6 (4.5) |
|
Fat mass, kg |
58.2 (11.7) |
|
Lean mass, kg |
63.3 (10.3) |
|
VO2max, l/min |
3.32 (0.64) |
|
VO2max, ml/kg/min |
28.3 (5.3) |
|
6MWT, m |
606 (56) |
|
PA levela |
316 (77) |
|
PA durationa |
105 (34) |
|
PA intensitya |
2,347 (693) |
|
aUnits are min of MVPA/day for PA duration, counts/min in bouts of MVPA for PA intensity and counts/min for total PA level. PA: physical activity; MVPA: moderate to vigorous physical activity; WC: waist circumference; BMI: body mass index; VO2max: maximal oxygen consumption; 6MWT: 6-min walk test; SD: standard deviation. |
|
Attrition analyses showed that subjects who did not provide data for the analyses of AF had a greater BMI (median [CI]: 43.7 [40.7–49.3] vs 39.0 [37.5–42.0], p = 0.025), exhibited reduced PA durations (74.7 [49.9–100.1] vs 96.5 [83.3–107.4] min of MVPA/day, p = 0.040) and PA intensities (1,585 [1,105–2,123] vs 2,239 [1,959–2,480] counts/min in bouts of > MVPA, p = 0.001) (PA level was 230 [175–324] vs 302 [275–323] counts/min, p = 0.051), and achieved a shorter walking distance on the 6MWT (530 [479–586] vs 593 [573–637] m, p = 0.006), compared with the study sample. Maximal oxygen consumption did not differ between the groups (p > 0.254).
Changes in anthropometry, physical activity and aerobic fitness over time
Body weight, BMI, waist circumference and fat mass decreased significantly from baseline to all subsequent time-points during the intervention period, whereas lean mass differed significantly from baseline only at week 20 (Table II).
|
Table II. Change in anthropometry over the 1-year intervention |
||||||||
|
Baseline Mean (SD) |
Week 3 Mean (SD) |
Week 6 Mean (SD) |
Week 20 Mean (SD) |
Week 23 Mean (SD) |
Week 50 Mean (SD) |
Week 53 Mean (SD) |
p for change over time |
|
|
Body weight, kg |
116.8 (13.1) |
115.1 (14.4)* |
112.6 (14.4)* |
108.6 (15.9)* |
106.9 (15.8)* |
110.3 (16.1)* |
107.3 (15.9)* |
< 0.001 |
|
BMI, kg/m2 |
39.4 (4.5) |
38.6 (4.5)* |
37.7 (4.4)* |
36.4 (4.8)* |
35.8 (4.7)* |
36.9 (4.6)* |
36.0 (4.3)* |
< 0.001 |
|
WC, cm |
124.9 (12.1) |
122.5 (12.7)* |
119.5 (13.0)* |
116.3 (11.7)* |
115.6 (12.2)* |
118.7 (12.5)* |
116.3 (11.4)* |
< 0.001 |
|
Fat mass, kg |
53.9 (10.3) |
52.0 (11.5)* |
49.6 (12.1)* |
47.2 (12.1)* |
45.3 (11.9)* |
48.7 (11.5)* |
46.1 (11.1)* |
< 0.001 |
|
Lean mass, kg |
62.9 (10.4) |
63.1 (10.6) |
63.0 (11.3) |
61.4 (11.0)* |
61.6 (12.1) |
61.6 (11.0) |
61.2 (11.7) |
0.001 |
|
*p < 0.01 compared with baseline. BMI: body mass index; SD: standard deviation; WC: waist circumference. |
||||||||
Physical activity increased significantly from baseline to week 4 (during the in-patient period), whereas the free-living PA during the intervention period did not differ from baseline at any time-point (Table III). The total PA level at week 16/46 (combined) was 324 counts/min (SD 88).
|
Table III. Change in physical activity over the 1-year intervention |
|||||
|
Baseline Mean (SD) |
Week 4 Mean (SD) |
Week 16 Mean (SD) |
Week 46 Mean (SD) |
p for effect of time |
|
|
Total PA levela |
316 (77) |
499 (125)** |
307 (87) |
349 (93) |
< 0.001 |
|
PA durationa |
105 (34) |
181 (28)** |
97 (29) |
116 (35) |
< 0.001 |
|
PA intensitya |
2,347 (693) |
2,814 (662)* |
2,760 (920) |
2,395 (730) |
0.019 |
|
*p < 0.05; **p < 0.01. aUnits are min of MVPA/day for PA duration, counts/min in bouts of MVPA for PA intensity and counts/min for total PA level. PA: physical activity; MVPA: moderate to vigorous physical activity; n = 21, 20, 18 and 19 at baseline, weeks 4, 16 and 46, respectively. |
|||||
Table IV shows change in VO2max and change in 6MWT over 1 year. The unadjusted differences over time were significant for VO2max measured relative to body weight (10.6% increase), TEX (15.2% increase) and the 6MWT (16.5% increase). However, controlling for change in BMI led to a substantial reduction in the effect on relative VO2max (2.8% increase) and TEX (5.8% increase), whereas a significant effect of time persisted for the 6MWT (11.5% increase).
|
Table IV. Baseline and follow-up values for VO2max, TEX and distance walked on the 6MWT and estimated changes over time (regression coefficients and confidence intervals (CI)). Values for the adjusted changes are the main effect of time when the main effect of BMI is included in a repeated linear mixed model |
||||
|
Baseline Mean (SD) |
Follow-up Mean (SD) |
Unadjusted change (95% CI, p) |
Change adjusted for change in BMI (95% CI, p) |
|
|
VO2max, l/min |
3.32 (0.64) |
3.37 (0.68) |
0.05 (–0.06 to 0.17, p = 0.347) |
0.06 (–0.11 to 0.24, p = 0.449) |
|
VO2max, ml/kg/min |
28.3 (5.3) |
31.4 (6.2) |
3.0 (1.4 to 4.6, p = 0.001) |
0.8 (–0.9 to 2.5, p = 0.323) |
|
TEX, s |
565 (130) |
651 (138) |
86 (45 to 127, p < 0.001) |
33 (–9 to 74, p = 0.123) |
|
6MWT, m |
606 (56) |
685 (81) |
100 (65 to 135, p < 0.001) |
70 (37 to 103, p < 0.001) |
|
∆: change; BMI: body mass index; VO2max: maximal oxygen consumption; TEX: time to exhaustion on the VO2max test; 6MWT: 6-min walk test; CI: confidence interval. |
||||
|
Table V. Regression models showing the relationships between change in BMI and change in 6MWT (independent variables) and change in VO2max and change in TEX (dependent variables) over 1 year. Effects are reported as partial correlations (p). Models a and b are bivariate; model c is a multiple regression model |
||||
|
Model |
Change in VO2max (l/min) |
Change in VO2max (ml/kg/min) |
Change in TEX |
|
|
a |
Change in BMI |
–0.19 (0.408) |
–0.65 (0.001) |
–0.65 (0.001) |
|
b |
Change in 6MWT |
0.14 (0.539) |
0.41 (0.067) |
0.47 (0.032) |
|
c |
Change in BMI |
–0.14 (0.557) |
–0.57 (0.009) |
–0.55 (0.013) |
|
Change in 6MWT |
0.06 (0.815) |
0.13 (0.589) |
0.22 (0.351) |
|
|
BMI: body mass index; 6MWT: 6-min walk test; VO2max: maximal oxygen consumption; TEX: time to exhaustion on the VO2max test. |
||||
Relationships between measures of aerobic fitness and the 6MWT
The correlation between the 6MWT and relative VO2max was r = 0.66 (p = 0.001), and the correlation between the 6MWT and TEX was r = 0.79 (p < 0.001) at baseline. The correlation between the 6MWT and absolute VO2max (r = 0.30, p = 0.195) was weak and non-significant.
The longitudinal relationships between change in 6MWT and change in AF were weaker than the cross-sectional relationships (Table V, Fig. 1). In the multiple regression models, change in BMI was significantly related to change in VO2max (ml/kg/min) and change in TEX, whereas change in 6MWT showed no association with change in AF.
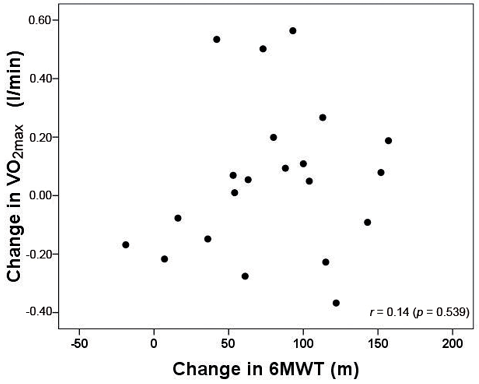
Fig. 1. Scatter-plot showing the relationship between change in the 6-min walk test (6MWT) and absolute maximal oxygen consumption (VO2max) (l/min) over the 1-year intervention.
Relationships between change in physical activity vs aerobic fitness and the 6MWT
The longitudinal relationships between change in PA and change in VO2max (Fig. 2) and 6MWT (Fig. 3) are shown in Table VI. Change in PA level correlated significantly with change in AF (change in VO2max and change in TEX) in both the bivariate and multiple regression models. Change in BMI correlated with both change in VO2max (ml/kg/min) and change in TEX, and it was the only variable that correlated significantly with change in 6MWT (bivariate relationship). Control for gender did not change any findings (interactions between gender and change in PA level were not analysed as the sample size was small).
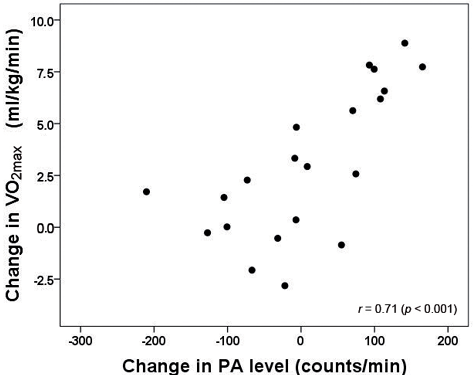
Fig. 2. Scatter-plot showing the relationship between change in physical activity (PA) level and relative maximal oxygen consumption (VO2max) (ml/kg/min) over the 1-year intervention.
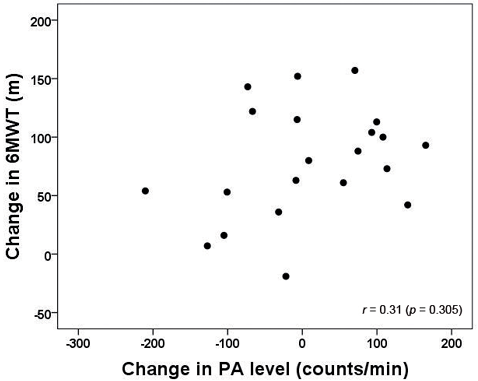
Fig. 3. Scatter-plot showing the relationship between change in physical activity (PA) level and the 6-min walk test (6MWT) over the 1-year intervention.
|
Table VI. Regression models showing the relationships between change in BMI and change in PA level (counts/min) (independent variables) and change in VO2max, change in TEX and change in 6MWT (dependent variables). Effects are reported as partial correlations (p). Models a and b are bivariate; model c is a multiple regression model |
|||||
|
Model |
Change in VO2max (l/min) |
Change in VO2max (ml/kg/min) |
Change in TEX |
Change in 6MWT |
|
|
a |
Change in BMI |
–0.19 (0.408) |
–0.65 (0.001) |
–0.65 (0.001) |
–0.50 (0.022) |
|
b |
Change in PA |
0.65 (0.002) |
0.71 (< 0.001) |
0.68 (0.001) |
0.31 (0.305) |
|
c |
Change in BMI |
0.07 (0.760) |
–0.59 (0.006) |
–0.58 (0.007) |
–0.43 (0.057) |
|
Change in PA |
0.63 (0.003) |
0.66 (0.001) |
0.63 (0.003) |
0.15 (0.531) |
|
|
Model R2 (p) |
0.422 (0.007) |
0.676 (<0.001) |
0.649 (<0.001) |
0.263 (0.064) |
|
|
BMI: body mass index; PA: physical activity; AF: aerobic fitness; VO2max: maximal oxygen consumption; TEX: time to exhaustion on the VO2max test; 6MWT: 6-min walk test. |
|||||
Discussion
Two main findings emerged from this study: firstly, an increased PA level led to increased directly measured maximal AF in severely obese subjects participating in the 1-year lifestyle intervention. Secondly, the 6MWT was a poor indicator of change in AF.
A dose–response relationship was found between change in PA level and change in AF over 1 year in the severely obese subjects. Although not surprising, as improved VO2max has been shown in several lifestyle interventions in overweight and obese subjects (27); this finding demonstrates that severely obese subjects who increase their PA level can achieve important health benefits beyond weight loss. To the best of our knowledge, only one previous study (11) has reported similar findings in severely obese subjects.
Improved AF, whether caused by PA or weight loss, would be desirable to increase performance in various demanding daily activities. However, because the protective effect of AF against cardiovascular disease and mortality is independent of obesity (1–3), the effects in AF beyond weight loss should be determined if the rationale for increasing AF is to increase life expectancy. For example, Maniscalco et al. (20) showed that 6-min walk distance increased from 476 to 626 m from before bariatric surgery to one year afterwards. However, the expected walking distance at follow-up directly caused by the weight loss (28 kg) in that study would have been 628 m (28); thus, no increased AF beyond that of direct weight loss was observed. Similarly, no significant change was found in relative VO2max and TEX at the 1-year follow-up when controlling for change in BMI. Considering that the PA level did not change over time, no PA-induced improvements in AF would be expected.
Because the results for the 6MWT differed from those for directly measured AF, a discussion of the measurement properties for the 6MWT is needed. Although no learning effect on the 6MWT has been shown in obese subjects (15, 16), several studies with other populations suggest that a couple of practice sessions should be performed, due to a significant learning effect (29–31). Therefore, the persisting effect of time for the 6MWT after controlling for change in BMI in the present study could possibly be ascribed to a learning effect, as we did not include any practice sessions prior to testing. In comparison, an inconsistent learning effect has been found for VO2max (32). Moreover, several criteria are usually applied in order to verify that VO2max is achieved (33), whereas no such criteria can be applied to the 6MWT. Thus, considering that the 6MWT is clearly submaximal (14, 16, 20), increased effort is a plausible cause of improved performance.
In addition to a possible systematic bias over time, random variation between repeated 6MWTs may have influenced our findings. However, high test-retest correlations (r > 0.94) (15, 16) and a coefficient of variation (CV) of 4.7% (16) have been reported for the 6MWT in obese subjects, similar to results obtained in healthy normal-weight subjects (30). In comparison, CVs in the range of 1–7% have been reported for VO2max (32). Thus, there is no clear indication that the 6MWT is unreliable, aside from a possible learning effect. Nevertheless, a change in the mean walk distance over time would not influence the relationships with change in VO2max, change in TEX or change in PA. Thus, the disparate findings when applying directly measured AF and the 6MWT may present a question of validity.
Maximal oxygen consumption is regarded as the gold-standard measure for maximal aerobic capacity, and differs from the 6MWT, which is a submaximal measure of functional exercise capacity. Thus, the correlation with functional exercise capacity (assessed by questionnaires) has been shown to be superior for 6MWT compared with VO2max (34). This result is somewhat expected, because most leisure activities (for example, work, shopping and gardening) are performed at submaximal intensities. Thus, we can hypothesize that the weak correlations found between change in 6MWT and change in AF could be ascribed to the measurement of different domains of physical fitness. However, this hypothesis implies that our finding of a relationship between change in PA and change in AF, but not change in 6MWT, is indicative of PA as important for increasing maximal aerobic capacity, but of little importance for the subjects’ function in everyday life. In contrast to this finding, a high correlation (r = 0.85) between change in VO2max and change in 6MWT was detected in a study of weight loss in children (17). However, this study might be flawed by the application of a submaximal test for estimation of VO2max and the lack of controlling for change in weight.
Nevertheless, our results indicate that change in 6MWT might not be useful to evaluate change in maximal AF in lifestyle interventions for severely obese subjects. Despite this, the assessment of walking capacity could work well in the clinic as a feasible measure of gross physical function and be a good source of motivation for exercise for individuals attempting to change their lifestyle. If one need a more feasible measure of AF than measurement of O2 consumption, the present study suggests that performance (time to exhaustion) on a standardized maximal treadmill protocol will provide comparable findings to VO2max.
We observed values for VO2max and the 6MWT that were in the upper end compared with previous studies in the (severely) obese population. This may have several causes. The attrition analyses showed that the 21 subjects who provided data for these analyses were a selected group of individuals exhibiting increased PA levels and 6MWT walk-distance, compared with the rest of the sample. The median distance walked on the 6MWT was 530 m for the subjects not providing data, which is very similar to the result of others studies (14). However, both 6MWT results (19, 20) and PA levels (10, 35, 36) indicate that the subjects included in the present study were inherently a selected group of severely obese individuals screened for inclusion in the lifestyle treatment programme. Variation between studies might also reflect somewhat different instructions given to subjects performing the 6MWT (14). Regarding VO2max, the total sample of women providing data (n = 28) obtained values of 25.6 ml/kg/min (SD 4.3) or 50.7 ml/kg lean mass/min (SD 6.9) (results not shown), which is very similar to values reported in somewhat less obese (BMI 32–34) women by direct maximal treadmill testing (37, 38).
Strengths and limitations of the study
The strengths of the present study are the inclusion of direct measurements of AF and PA, and a 1-year follow-up period of the lifestyle intervention. Furthermore, the use of the mean PA level at 3 and 11 months might reflect the subjects’ normal free-living PA level better than a 1-time measurement and thereby increased the reliability of the assessment.
The main limitation of this study is the small sample size, which makes it difficult to draw any firm conclusions about the findings. Further research is required to validate our findings in a larger sample of overweight to severely obese subjects participating in lifestyle interventions.
Conclusion
We found a dose–response relationship between change in PA level and directly measured maximal AF over 1 year in severely obese subjects participating in a lifestyle intervention. Hence, we conclude that severely obese subjects who increase their PA level can achieve important health benefits beyond weight loss. However, it should be noted that the results are based on a small sample, and that our study sample was probably a selected group compared with the general population of severely obese subjects. Furthermore, our results suggest that change in 6MWT was a poor indicator of change in maximal AF in this population.
Acknowledgements
The authors would like to thank the staff and participants at the Red Cross Haugland Rehabilitation Centre for their collaboration and cooperation during data collection, and The Western Norway Regional Health Authority for funding the study.
The authors have no conflicts of interest to declare.
References

