Manon Fens, Msc1,2, Caroline M. van Heugten, PhD3,4, George Beusmans, MD, PhD2,5, Job Metsemakers, MD, PhD2,5, Arnold Kester, PhD2,6 and Martien Limburg, MD, PhD7
From the 1Department of Patient & Care, Maastricht University Medical Centre+, 2CAPHRI School for Public Health and Primary Care, 3Department of Psychiatry and Neuropsychology, School for Mental Health and Neuroscience, 4Department of Neuropsychology and Psychopharmacology, Faculty of Psychology and Neurosciences, Maastricht University, 5Department of General Practice, Maastricht University Medical Centre+, 6Department of Methodology and Statistics, Maastricht University, Maastricht and 7Department of Neurology, Flevo Hospital, Almere, The Netherlands
OBJECTIVE: To evaluate the effectiveness of a stroke-specific follow-up care model on quality of life for stroke patients, being discharged home, and their caregivers.
DESIGN: A non-randomized, controlled trial, comparing an intervention group with a control group (usual care).
SUBJECTS: Stroke patients and their caregivers.
METHODS: Intervention involved 5 home visits by a stroke care coordinator over a period of 18 months, using a structured assessment tool. Outcome measures were conducted at baseline (T0) and every 6 months thereafter (T6, T12 and T18) in the domains of quality of life (primary), activities of daily living, social activities, depression, anxiety and caregiver strain.
RESULTS: The intervention group (n = 62) had significantly increased its social activities after 18 months, whereas the control group (n = 55) showed significantly decreased levels of social activities. In the first 6 months, levels of depression decreased significantly in caregivers of the intervention group. No differences were found for quality of life and the other outcome measures.
CONCLUSION: The intervention was not effective in improving quality of life, but was effective in improving levels of social activities. The intervention may have focussed too much on screening for stroke-related problems and not as much on adequate follow-up care and referral.
Key words: stroke; follow-up studies; long-term care; needs assessment; quality of life.
J Rehabil Med 2013; 45: 00–00
Correspondence address: Caroline van Heugten, Maastricht University, Department of Psychiatry and Neuropsychology, PO Box 616, NL-6200 MD Maastricht, The Netherlands. E-mail: c.vanheugten@maastrichtuniversity.nl
Accepted Jul 3, 2013; Epub ahead of print Nov 13, 2013
Introduction
Stroke survivors often experience problems in many different areas of functioning after being discharged home after hospitalization or inpatient rehabilitation. Stroke patients can have physical limitations (1), but cognitive and emotional problems can also occur (2, 3), which can lead to limitations in daily life and social activities (4). The lives of their caregivers can also be affected by the consequences of the stroke, as they often take partial or full responsibility for care provision, which can lead to caregiver burden or depression (5). These stroke-related problems are mostly long-lasting, requiring the provision of chronic care to patients and their caregivers (6). However, suitable long-term care is often lacking. New problems can emerge over time when patients no longer have contact with stroke care professionals.
Chronic care for stroke patients is complex because of the many domains of functioning affected, the occurrence of new problems over time, and the involvement of many different stroke care professionals. There does not currently seem to be consensus about the organization of chronic care services. In addition, patients are often unaware that certain problems may be stroke-related and therefore do not seek specific help (7). We believe that all stroke patients should be monitored regularly for more than 1 year after being discharged home and that those with needs should receive suitable follow-up care.
With regard to type of care, several researchers have highlighted the importance of regularly monitoring stroke patients for issues other than somatic complaints, such as cognitive, psychological and social functioning (6, 7). This may be achieved by using a comprehensive assessment tool covering all stroke-related problems to detect the needs of stroke patients and their caregivers. Such an assessment was developed by Murray and colleagues (8), but this tool cannot yet be recommended for clinical use. The person carrying out the assessment, should preferably have sufficient knowledge of stroke, and the care professional should be able to provide multifaceted stroke care and be able to work with a multidisciplinary team. The preferred care professionals for this type of care might be general practitioners (GPs), but stroke care coordinators (SCC) and social liaison workers can also provide equal or even better care than GPs on a wide range of chronic health problems (9).
Provision of this multifaceted care, considering the many affected functions, should be organized in a multidisciplinary system. This aspect has been studied more during the last 10 years. There are many studies investigating the effectiveness of multidisciplinary care for stroke patients at home. Only a few interventions however, were effective (10, 11), and these were very heterogeneous in terms of care provider, type of care provided and duration of care provision, and no specific factors can be identified that contributed to their effectiveness.
Aims and hypothesis
To our knowledge, there have been no studies evaluating a model of chronic care for stroke patients and their caregivers that included all the important long-term care aspects as described above; regular monitoring, use of an assessment tool, coordinating follow-up care by a single healthcare professional, multidisciplinary care and follow-up care for more than 1 year. We therefore developed a new long-term care model for stroke patients and caregivers living at home after hospitalization or inpatient rehabilitation. This model involved the availability of long-term care for all stroke patients. A coordinating stroke care professional who collaborates with a multidisciplinary team, provided a structured assessment procedure by using an assessment tool, including 5 regular home visits over a period of 18 months leading to further follow-up care (such as advice, healthcare facilities and physical aids) or referral to other healthcare professionals (such as a physiotherapist or an occupational therapist). The present study evaluated the effectiveness of this long-term care model in terms of the quality of life (QoL) of stroke patients and their caregivers. We expected that the QoL (primary outcome) would be higher and more improved in the group of patients and caregivers receiving the intervention (i.e. according to our chronic care model) than in the control group receiving care as usual. We also expected a difference in favour of the intervention group in terms of the secondary outcome domains of daily life functioning, social activities, emotional functioning and caregiver’s burden.
Methods
Design
The study used a non-randomized, controlled trial design, comparing 2 regional stroke services (intervention vs control) over a period of 18 months. No changes to the methods were made after trial commencement.
Study participants
Consecutive stroke patients being discharged home from hospital or inpatient rehabilitation in the regions of Maastricht (intervention) and Eindhoven (control), both in the Netherlands, were eligible for participation in the study. Participants in the intervention group were included between 14 April 2008 and 31 December 2009, and participants in the control group were included between 1 September 2008 and 30 June 2010. Inclusion criteria were: a diagnosis of stroke (confirmed by a neurologist); aged 50 years or older; living in the catchment area of the regional home care organization; and having sufficient command of Dutch. Exclusion criteria for patients were: living in a nursing home before the stroke and a life expectancy of less than 3 months. The caregivers of the stroke patients were also asked to participate, based on the following criteria; being the primary caregiver of the stroke patient, being 18 years or older and having sufficient command of Dutch. The follow-up measurements were ended if the patient or caregiver refused to participate further, or if the patient moved to a nursing home or outside of the catchment area of the home care organization.
Intervention
The model for long-term care after stroke was developed for the Maastricht region, involving the following elements. All stroke patients were referred to a stroke care coordinator after being discharged home from hospital or inpatient rehabilitation. The SCCs were nurses from home care services specialized in stroke. The SCC visited the stroke patients at home 1–2 weeks and 3, 6, 12 and 18 months after discharge. More home visits were offered as needed. During each home visit the SCC administered a structured assessment tool (which we developed for the study) to assess a broad spectrum of stroke-related problems (activities of daily living, instrumental activities of daily living, social activity, cognition, communication, psycho-emotion, fatigue, secondary prevention, medical consumption, medical condition, caregivers’ strain and provision of information). Based on these assessments, the SCC provided suitable follow-up care during the home visits, such as giving information and advice or referred the patient to physiotherapists, occupational therapists and other healthcare professionals. After each home visit the SCC sent a written report to the patient’s general practitioner. The SCC could consult a multidisciplinary team of the nursing home (physician, physiotherapist, occupational therapist, speech therapist, social worker and psychologist) for advice as needed. The actual care for the included patients was recorded during the study period.
Control
The participants in the control group received the usual care provided in the Eindhoven region. Stroke patients with few or no residual effects were discharged home without follow-up care. Patients with more severe residual effects were discharged home and referred to a SCC of the home care service or of the stroke aftercare centre. Patients who were referred to the SCC of the home care service received their first home visit 6 weeks after being discharged home. Patients referred to the stroke aftercare centre had their first consult with a SCC at the centre after 3 months. Subsequently, one or more home visits or consultations could be provided as needed. No structured assessment procedure and pre-defined follow-up measurements were available. The actual care for the included patients was recorded during the study period.
Procedure
Shortly after being discharged home from hospitalization or inpatient rehabilitation, a SCC or nurse recruited the patient and their caregiver for the study. Patients and caregivers who agreed to participate were asked to give informed consent. After consent, patients and their caregivers were interviewed by the researcher to administer the outcome measures at baseline. The first interview with the researcher was arranged within 2–4 weeks at the patient’s home after being discharged home (T0) and 6 (T6), 12 (T12) and 18 months (T18) later. The measurements of the study were performed independently and unrelated to the home visits of the care model, but they could affect each other, considering the time periods of the home visits and the study measurements. Medical records of the hospital were explored to gather information about the stroke and previous stroke history. This study was approved by the medical ethics committee of Maastricht University Medical Centre.
Outcome measures
The primary outcome measure for patients was the Stroke Adapted Sickness Impact Profile-30 (SASIP-30) as a measure of QoL (0–30; ≥ 10 representing reduced QoL) (12). Secondary outcome measures were the Barthel Index (BI) to measure activities of daily living (ADL) (13) (0–20; < 10 representing ADL dependency), the Frenchay Activities Index (FAI) to measure social activities (14) (0–45; 0–15 representing inactivity), and the Hospital Anxiety Depression Scale (HADS) to measure depression and anxiety (15) (0–21; ≥ 11 representing depression or anxiety disorder). The primary outcome measure for caregivers was the Life Satisfaction questionnaire-9 (LiSAT-9) as a measure of the QoL (1–9; no norms were available, therefore we used the reference values of stroke patients in a study with a mean of 4.5 and standard deviation of 0.8; a higher score representing greater satisfaction) (16). The secondary outcome measures were the HADS and the Caregivers Strain Index (CSI) to measure caregiver’s burden (17) (0–13; > 7 representing caregiver’s strain). All measures have good reliability and validity. No outcome measures were changed after trial commencement.
Statistical analysis
Means, standard deviations or percentages were used to describe participants’ and disease characteristics. Differences in these characteristics between the intervention and control group were analysed by independent samples t-tests and χ2 tests, where appropriate. Non-parametric tests were used, in case normality assumptions were violated, by which medians and percentiles were presented. To determine the effects of the intervention, mean change scores were calculated using baseline measures as a reference. Due to skewed distributions and a small number of participants, the median change scores were presented. Differences in median change scores were tested using Mann-Whitney U tests. In addition, within group differences were analysed using Wilcoxon signed-rank tests. Patients and caregivers were included in the analyses when they had taken part in one or more follow-up measurements.
To check for possible confounding, participant characteristics were entered as covariates in linear regression analyses where the mean change score was the dependent variable and the group was the primary independent variable, for each follow-up measurement. The influences of the following patient characteristics were checked stepwise for confounding: sex, age, comorbidity, marital status, education, type of stroke, institution of discharge, and time between stroke and discharge. The following caregiver characteristics were checked stepwise for confounding: sex, age, number of hours of caregivers’ activities, relationship, and education. A variable was considered a strong confounder when inclusion of the variable in the linear regression model changed the coefficient of the independent variable group by more than half of its standard error. When the covariate was not a strong confounder, the covariate was removed and other covariates were entered in the model. When a confounder was identified at one of the 3 mean change scores (T6–T0, T12–T0 or T18–T0) of a dependent variable, a correction was applied to all 3 mean change scores of this dependent variable.
A power calculation, assuming an independent samples t-test, indicated a minimal sample size of 76 patients per group to obtain a power of 80% for an effect size of 0.5 on the scores of the SASIP-30 (medium effect) (18), with 2-sided alpha of 0.05. This calculation accounts for an expected drop-out rate of 15%. SPSS (version 18) was used for all statistical analyses. Two sided p-values smaller than 0.05 were considered significant.
Results
Participant’s characteristics
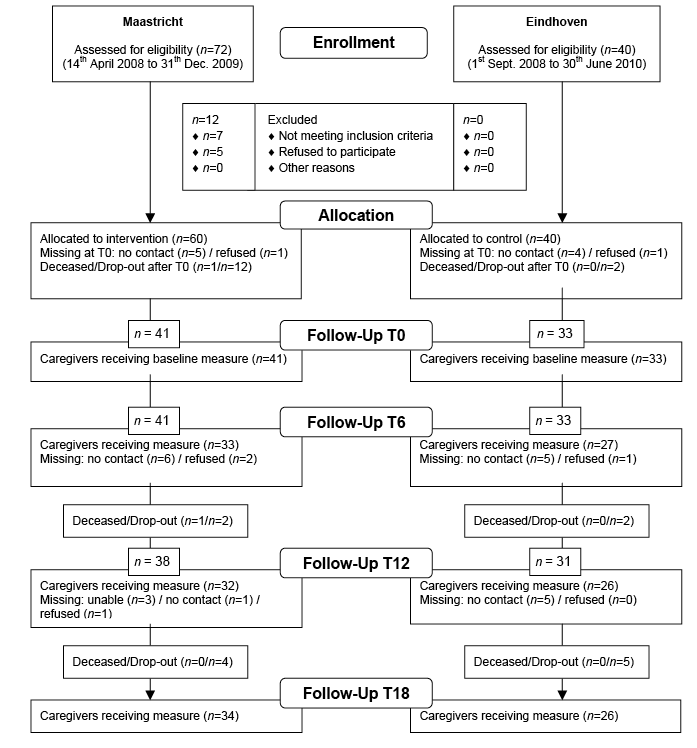
In the Maastricht region, the results of 62 patients and 41 caregivers were included in the analyses. In the Eindhoven region, the results of 55 patients and 33 caregivers were included in the analyses. Fig. 1 shows the inclusion process of the patients and their follow-up measurements and Fig. 2 presents the inclusion process and follow-up measurements of the caregivers. Patient characteristics are given in Table I. The patients in the intervention group had more comorbidity than the control group, particularly with regard to locomotor apparatus. Table II summarizes the caregiver characteristics and showed that caregivers in the control region provided more care regarding transfer and mobility to stroke patients than caregivers in the intervention region. There were no differences found in the baseline characteristics and scores of the dropped-out patients.
Table III shows the 6 major problems that were identified using the structured assessment tool by the SCC during the follow-up visits in the intervention group. Fatigue, cognitive complaints and instrumental activities of daily living problems were mentioned by more than half of the patients during the first 2 visits in the first 6 months and by more than one-third of the patients at later visits.
Fig. 1. Inclusion of stroke patients and follow-up measurements.
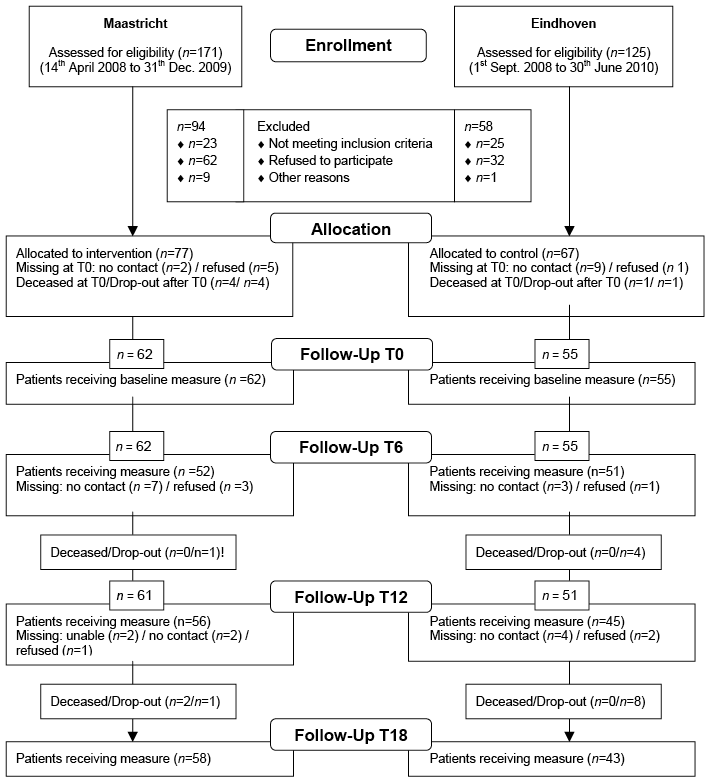
Fig. 2. Inclusion of caregivers and follow-up measurements
|
Table I. Patient characteristics |
|||
|
Intervention (n = 62) |
Control (n = 55) |
p-value |
|
|
Age, years, mean (SD) |
72.7 (10.0) |
71.1 (8.4) |
0.364 (t) |
|
Gender, male, n (%) |
32 (51.6) |
31 (56.4) |
0.607 (χ2) |
|
Time since stroke, months, median [IQR] |
2.0 [1–3] |
1.0 [1–3] |
0.955 (U) |
|
Marital status, n (%) |
|||
|
Couple |
32 (51.6) |
32 (58.2) |
0.476 (χ2) |
|
Single |
30 (48.4) |
23 (41.8) |
|
|
Education, n (%) |
|||
|
Low |
29 (47.5) |
23 (41.8) |
0.722 (χ2) |
|
Middle |
21 (34.4) |
19 (34.5) |
|
|
High |
11 (18.1) |
13 (23.6) |
|
|
Missing |
1 |
– |
|
|
Stroke type, n (%) |
|||
|
Infarction |
51 (82.3) |
48 (90.6) |
0.199 (χ2) |
|
Bleeding |
11 (17.7) |
5 (9.4) |
|
|
Missing |
– |
2 |
|
|
Thrombolyses |
9 (14.8) |
8 (14.5) |
0.993 (χ2) |
|
Stroke location, n (%) |
|||
|
Left hemisphere |
26 (41.9) |
27 (50.0) |
0.294 (χ2) |
|
Right hemisphere |
24 (38.7) |
22 (40.7) |
|
|
Others |
12 (19.4) |
5 (9.3) |
|
|
Missing |
– |
1 |
|
|
Previous history, n (%) |
|||
|
Patients with other diseases |
51 (83.6) |
37 (67.3) |
0.040 (χ2) |
|
Cardiovascular diseases |
24 (38.7) |
18 (32.7) |
0.233 (χ2) |
|
Locomotor apparatus |
16 (25.8) |
3 (5.5) |
0.001 (χ2) |
|
Previous cerebrovascular event |
8 (12.9) |
8 (14.5) |
0.823 (χ2) |
|
Pulmonary diseases |
5 (8.1) |
7 (12.7) |
0.540 (χ2) |
|
Diabetes |
5 (8.1) |
7 (12.7) |
0.479 (χ2) |
|
Patient > 1 other diseases |
25 (40.3) |
16 (29.6) |
0.006 (U) |
|
Discharged from, n (%) |
|||
|
Hospital |
44 (71.0) |
47 (85.5) |
0.060 (χ2) |
|
Inpatient rehabilitation |
18 (29.0) |
8 (14.5) |
|
|
Baseline outcome |
|||
|
Primary outcome |
|||
|
SASIP-30 |
|||
|
n |
61 |
55 |
|
|
Median |
8.0 |
6.0 |
0.135 (U) |
|
IQR |
5–13 |
3–6 |
|
|
n (% above cut-off score (≥ 10)) |
26 (41.9) |
17 (30.9) |
|
|
Secondary outcome |
|||
|
BI |
|||
|
n |
62 |
55 |
|
|
Median |
20.0 |
20.0 (5–20) |
0.267 (U) |
|
IQR |
18.5–20 |
19–20 |
|
|
n (% below cut-off score (< 10)) |
4 (6.5) |
1 (1.8) |
|
|
FAI |
|||
|
n |
62 |
55 |
|
|
Median |
17.5 |
27.0 |
< 0.001 (U) |
|
IQR |
9–25 |
20–32 |
|
|
n (% below cut-off score (< 15)) |
25 (40.3%) |
6 (10.9) |
|
|
HADS anxiety |
|||
|
n |
61 |
55 |
|
|
Median |
4.0 |
4.0 |
0.643 (U) |
|
IQR |
1–8 |
2–7 |
|
|
n (% above cut-off score (≥ 11)) |
4.0 (6.5) |
5 (9.1) |
|
|
HADS depression |
|||
|
n |
61 |
55 |
|
|
Median |
4.0 |
3.0 |
0.376 (U) |
|
IQR |
2–7.5 |
2–7 |
|
|
n (% above cut-off score (≥ 11)) |
5.0 (8.1) |
3 (5.5) |
|
|
SD: standard deviation; t: t-test; χ2: chi-square test; U: Mann-Whitney U test; SASIP-30: Stroke Adapted Sickness Impact Profile-30; BI: Barthel Index; FAI: Frenchay Activities Index; HADS: Hospital Anxiety Depression Scale; IQR: interquartile range. |
|||
|
Table II. Caregivers’ characteristics |
||||||
|
Intervention (n = 41) |
Control (n = 33) |
p-value |
||||
|
Age, years, mean (SD) |
63.7 (14.5) |
64.9 (11.1) |
0.638 (t) |
|||
|
Gender, male, n (%) |
10 (24.4) |
9 (27.3) |
0.097 (χ2) |
|||
|
Relationship, n (%) |
||||||
|
Spouse |
29 (70.7) |
27 (81.8) |
– |
|||
|
Child |
9 (22) |
5 (15.2) |
||||
|
Other |
3 (7.3) |
1 (3) |
||||
|
Marital status, n (%) |
||||||
|
Couple |
35 (85.4) |
29 (87.9) |
– |
|||
|
Single |
6 (14.6) |
4 (12.1) |
||||
|
Education, n (%) |
||||||
|
Low |
17 (41.5) |
10 (30.3) |
0.471 (χ2) |
|||
|
Middle |
17 (41.5) |
14 (42.4) |
||||
|
High |
7 (17.1) |
9 (27.3) |
||||
|
Caregivers’ activities |
||||||
|
Hours a week, median |
10 |
8.5 |
0.677 (U) |
|||
|
IQR |
4.8–17.5 |
1–18.8 |
||||
|
Type of activity performed, n (%) |
||||||
|
Personal care |
10 (24.4) |
5 (15.2) |
0.359 (χ2) |
|||
|
Mobility and transport |
20 (48.8) |
24 (72.7) |
0.006 (χ2) |
|||
|
House holding activities |
26 (63.4) |
22 (66.7) |
0.502 (χ2) |
|||
|
Finances and mail |
14 (34.1) |
16 (48.5) |
0.132 (χ2) |
|||
|
Others |
6 (14.6) |
1 (3.0) |
– |
|||
|
Baseline outcome |
||||||
|
Primary outcome |
||||||
|
LiSAT-9 |
||||||
|
n |
41 |
33 |
||||
|
Median |
4.9 |
5.1 |
0.036 (U) |
|||
|
IQR |
4–5.2 |
4.8–5.4 |
||||
|
n (% below cut-off score (< 4.5)) |
14 (34.1) |
4 (12.1) |
||||
|
Secondary outcome |
||||||
|
HADS anxiety |
||||||
|
n |
41 |
33 |
||||
|
Median |
5.0 |
3.0 |
0.003 (U) |
|||
|
IQR |
3–9 |
1–6 |
||||
|
n (% above cut-off score (≥ 11)) |
5 (12.2) |
4 (12.1) |
||||
|
HADS depression |
||||||
|
n |
41 |
33 |
||||
|
Median |
4.0 |
2.0 |
0.035 (U) |
|||
|
IQR |
2–7 |
0.5–5 |
||||
|
n (% above cut-off score (≥ 11)) |
6 (14.6) |
2 (6.1) |
||||
|
CSI |
||||||
|
n |
37 |
33 |
||||
|
Median |
4.0 |
4.0 |
||||
|
IQR |
1–6 |
1–6.5 |
0.781 (U) |
|||
|
n (% above cut-off score (> 7)) |
7 (18.9) |
8 (24.2) |
||||
|
SD: standard deviation; t: t-test; χ2: chi-square test; U: Mann-Whitney U test; LiSAT-9: Life Satisfaction questionnaire-9; HADS: Hospital Anxiety Depression Scale; CSI: Caregivers Strain Index; IQR: interquartile range. |
||||||
|
Table III. The 6 major problems identified during the follow-up home visits |
|||||
|
Problem |
0–1 months % |
2–4 months % |
5–7 months % |
11–13 months % |
17–19 months % |
|
Fatigue |
78 |
64 |
44 |
48 |
39 |
|
Instrumental ADL |
61 |
61 |
41 |
41 |
28 |
|
Medical status |
50 |
43 |
32 |
– |
28 |
|
Cognition |
46 |
50 |
29 |
38 |
33 |
|
Social activity |
46 |
50 |
– |
41 |
– |
|
Lack of information |
41 |
– |
– |
– |
– |
|
Communication |
– |
43 |
24 |
38 |
33 |
|
ADL |
– |
– |
29 |
– |
– |
|
Psycho-emotional |
– |
– |
– |
34 |
17 |
|
ADL: activities of daily living. |
|||||
Received care
Patients in the intervention group received a mean of 3.9 home visits and 11% received care longer than 18 months. In the control group, 30 patients received no follow-up care, 15 patients received care from the SCCs (mean 2.4 home visits over a mean period of 5.5 months) and 10 patients received care from the stroke care centre (mean 1.1 consults over a mean period of 3.5 months).
Primary outcome
Patients. Table IV lists the median scores of the patients in both groups, for each follow-up measurement. The intervention group had a higher score on the SASIP than the control group at 18 months follow-up, although the difference was not significant. Median change scores showed a decline over time in both groups on the SASIP, but the difference between the 2 groups regarding these changes was not significant (T6–T0, p = 0.055; T12–T0, p = 0.354; T18–T0, p = 0.416) (Table V).

|
Table IV. Median scores of the outcomes of patients at baseline and the follow-up measures |
||||||||
|
T0 |
T6 |
T12 |
T18 |
|||||
|
Intervention n (median) [IQR] |
Control n (median) [IQR] |
Intervention n (median) [IQR] |
Control n (median) [IQR] |
Intervention n (median) [IQR] |
Control n (median) [IQR] |
Intervention n (median) [IQR] |
Control n (median) [IQR] |
|
|
Primary outcome |
||||||||
|
SASIP-30 |
61 (8.0) [5 to 13] |
55 (6.0) [3–6] |
52 (5.0) [2–13] |
51 (5.0) [2–11] |
56 (6.5) [3–12] |
45 (5.0) [2.5–129] |
58 (6.0) [3–10] |
43 (4.0) [1–9] |
|
Secondary outcomes |
||||||||
|
BI |
62 (20.0) [18.5–20] |
55 (20.0) [19–20] |
52 (20.0) [19–20] |
51 (20.0) [19–20] |
56 (20.0) [18–20] |
45 (20.0) [19.5–20] |
58 (20.0) [19–20] |
43 (20.0) [20–20] |
|
FAI |
62 (17.5) [9–25]* |
55 (27.0) [20–32]* |
51 (24.0) [20–31] |
51 (24.0) [16–31] |
55 (22.0) [16–30] |
45 (25.0) [19–31] |
58 (24.0) [14–28] |
43 (23.0) [17–30] |
|
HADS A |
61 (4.0) [1–8] |
55 (4.0) [2–7] |
52 (3.0) [1–7] |
51 (2.0) [1–6] |
55 (2.0) [0–6] |
45 (3.0) [1–6.5] |
58 (2.0) [1–5] |
43 (2.0) [1–5] |
|
HADS D |
61 (4.0) [2–7.5] |
55 (3.0) [2–7] |
52 (3.5) [1–8] |
51 (3.0) [1–7] |
55 (3.0) [1–7] |
45 (4.0) [1–8] |
58 (3.0) [1–7] |
43 (2.0) [0–6] |
|
*Significant differences between groups. SASIP-30: Stroke Adapted Sickness Impact Profile-30; BI: Barthel Index; FAI: Frenchay Activities Index; HADS A: Hospital Anxiety Depression Scale – Anxiety subscale; HADS D: Hospital Anxiety Depression Scale – Depression subscale; IQR: interquartile range. |
||||||||


|
Table V. Median change scores of the outcomes of patients at the follow-up measures |
||||||
|
T6–T0 |
T12–T0 |
T18–T0 |
||||
|
Intervention n (median) [IQR] |
Control n (median) [IQR] |
Intervention n (median) [IQR] |
Control n (median) [IQR] |
Intervention n (median) [IQR] |
Control n (median) [IQR] |
|
|
Primary outcome |
||||||
|
SASIP-30 |
51 (–2.0) [–5 to 0] |
51 (0.0) [–3 to 2] |
55 (–2.0) [–4 to 1] |
45 (0.0) [–3.5 to 2] |
57 (–2.0) [–4 to 1] |
43 (–1.0) [–5–2] |
|
Secondary outcomes |
||||||
|
BI |
52 (0.0) [0 to 0.8] |
51 (0.0) [0 to 0] |
56 (0.0) [–1 to 0] |
45 (0.0) [0 to 0] |
58 (0.0) [0 to 0] |
43 (0.0) [0 to 0] |
|
FAI |
51 (6.0) [0 to 13]* |
51 (–3.0) [–8 to 4]* |
55 (3.0) [–4 to 10]* |
45 (–1.0) [–5.5 to 2]* |
58 (3.5) [–3.3 to 9.3]* |
43 (–4.0) [–9 to 0]* |
|
HADS A |
51 (0.0) [–3 to 2] |
51 (–1.0) [–3 to 1] |
54 (–1.0) [–3 to 1] |
45 (–1.0) [–3 to 1] |
57 (–1.0) [–3.5 to 1] |
43 (–1.0) [–3 to 1] |
|
HADS D |
51 (–1.0) [–3 to 1] |
51 (0.00) [–2 to 2] |
54 (0.0) [–2.3 to 1]* |
45 (0.0) [–1 to 3]* |
57 (–1.0) [–2.5 to 1] |
43 (0.0) [–2 to 1] |
|
*Significant differences between groups. SASIP-30: Stroke Adapted Sickness Impact Profile-30; BI: Barthel Index; FAI: Frenchay Activities Index; HADS A: Hospital Anxiety Depression Scale – Anxiety subscale; HADS D: Hospital Anxiety Depression Scale – Depression subscale; IQR: interquartile range. |
||||||


Caregivers. Table VI shows that there was a significant difference in caregiver’s median scores on the LiSAT-9 at the 18 months follow-up, in favour of the control group (p = 0.005). Median change scores for the LiSAT-9 showed no change from baseline over time in either of the groups (Table VII).

|
Table VI. Median scores of the outcomes of caregivers at baseline and the follow-up measures |
||||||||
|
T0 |
T6 |
T12 |
T18 |
|||||
|
Intervention n (median) [IQR] |
Control n (median) [IQR] |
Intervention n (median) [IQR] |
Control n (median) [IQR] |
Intervention n (median) [IQR] |
Control n (median) [IQR] |
Intervention n (median) [IQR] |
Control n (median) [IQR] |
|
|
Primary outcome |
||||||||
|
LiSAT-9 |
41 (4.9) [4–5.2]* |
33 (5.1) [4.8–5.4]* |
33 (4.9) [4.5–5] |
27 (5.0) [4.8–5.2] |
32 (5.0) [4.6–5.2] |
26 (5.0) [4.4–5.4] |
34 (4.7) [4.4–5]* |
26 (5.0) [4.9–5.3]* |
|
Secondary outcomes |
||||||||
|
HADS A |
41 (5.0) [3–9]* |
33 (3.0) [1–6]* |
30 (5.0) [3–11] |
27 (4.0) [1–8] |
31 (4.0) [1–6] |
26 (3.0) [1.8–6] |
34 (4.0) [1–9.3] |
26 (2.0) [1–5] |
|
HADS D |
41 (4.0) [2–7]* |
33 (2.0) [0.5–5]* |
30 (2.5) [1–8] |
27 (3.0) [1–5] |
31 (2.0) [0–5] |
26 (2.0) [1–4.3] |
34 (2.0) [1–7] |
26 (2.0) [0.8–3.3] |
|
CSI |
37 (4.0) [1–6] |
33 (4.0) [1–6.5] |
32 (2.0) [1–4] |
27 (3.0) [1–5] |
31 (3.0) [1–5] |
26 (3.5) [0.8–7.3] |
34 (2.0) [0.8–5] |
26 (2.0) [0–6] |
|
*Significant differences between groups. LiSAT-9: Life Satisfaction questionnaire-9; HADS: Hospital Anxiety Depression Scale; HADS A: Hospital Anxiety Depression Scale – Anxiety subscale; HADS D: Hospital Anxiety Depression Scale – Depression subscale; CSI: Caregivers Strain Index; IQR: interquartile range |
||||||||


|
Table VII. Median change scores of the outcomes of caregivers at the follow-up measures |
||||||
|
T6–T0 |
T12–T0 |
T18–T0 |
||||
|
Intervention n (median) [IQR] |
Control n (median) [IQR] |
Intervention n (median) [IQR] |
Control n (median) [IQR] |
Intervention n (median) [IQR] |
Control n (median) [IQR] |
|
|
Primary outcome |
||||||
|
LiSAT-9 |
33 (0.0) [–0.2 to 0.4] |
27 (–0.1) [–0.3 to 0.2] |
32 (0.0) [–0.2 to 0.6] |
26 (–0.1) [–0.7 to 0.2] |
34 (0.0) [–0.5 to 0.6] |
26 (–0.1) [–0.2 to 0.1] |
|
Secondary outcomes |
||||||
|
HADS A |
30 (0.0) [–2.3 to 3] |
27 (1.0) [–1 to 2] |
31 (–2.0) [–5 to 1] |
26 (0.0) [–1.3 to 2.3] |
34 (–2.5) [–4.3 to 1] |
26 (0.0) [–2.3 to 2.3] |
|
HADS D |
30 (–1.0) [–2.3 to 0]* |
27 (0.0) [0 to 1]* |
31 (–1.0) [–2 to 1] |
26 (0.0) [–1 to 1] |
34 (–1.0) [–4 to 0] |
26 (0.0) [–2.3 to 1] |
|
CSI |
30 (–1.0) [–3.3 to 1] |
27 (–1.0) [–4 to 0] |
28 (–1.0) [–2 to 1] |
26 (0.0) [–3 to 1] |
31 (–1.0) [–4 to 1] |
26 (–0.5) [–3.3 to 1] |
|
*Significant differences between groups. LiSAT-9: Life Satisfaction questionnaire-9; HADS A: Hospital Anxiety Depression Scale – Anxiety subscale; HADS D: Hospital Anxiety Depression Scale – Depression subscale; CSI: Caregivers Strain Index; IQR: interquartile range. |
||||||


Secondary outcomes
Patients. Median changes in the outcomes of the FAI scores indicated significant changes from baseline at 6 (p < 0.001), 12 (p = 0.006) and 18 months (p < 0.001). Patients in the intervention group showed a positive change, whereas the control group showed a negative change. Sub-analyses of the median scores at baseline and T6 within the 2 groups showed that the levels of social activities improved significantly within the first 6 months in the region of Maastricht (p < 0.001), but a significant decrease was found in the region of Eindhoven (p = 0.033). After 6 months, the median FAI scores of both group were stable (i.e. no significant changes) and comparable. The median BI scores were high at each follow-up measure in both groups (60–85% having the maximum score), which shows that the majority of patients were (almost) fully independent in terms of ADL. With regard to median changes over time, there were no significant differences between the groups as regards the BI outcome. There were no differences between the 2 groups in terms of the HADS anxiety scale. There was a significant change in the HADS depression scale scores between T12 and T0 (p = 0.048) in favour of the intervention group.
Caregivers. Table VI shows the median scores for the secondary outcome measures for caregivers, and Table VII shows the median change scores. Caregivers in the intervention group had higher median scores on the HADS anxiety and depression scale at most of the follow-up measures compared with the control group, but the differences were not significant. The CSI scores remained low at each follow-up measurement and there were no significant differences between the groups.
The changes in the caregiver’s scores on the HADS depression scale between baseline and 6 months follow-up differed significantly between the groups in favour of the intervention group (p = 0.028). There were no other significant differences between the 2 groups as regards the changes over time.
Confounding factors
Patients. The analyses to identify confounding factors indicated that comorbidity and the institution of discharge had a strong influence on the outcome in terms of SASIP scores. The effect of the intervention on the BI outcome was changed when the institution of discharge was included in the analysis. The HADS anxiety scale score was influenced by comorbidity and type of stroke. There were no patient characteristics that influenced the effect of group on the FAI score or the HADS depression scale score. The correction for confounding patient characteristics did not change the differences in outcomes between the 2 groups.
Caregivers. The effect of the intervention on the LiSAT-9 scores was not influenced by any of the caregiver characteristics. The effect of the intervention on the outcome in terms of the HADS anxiety and depression scale and the CSI were all influenced by the number of hours of caregivers’ activities. The difference in outcome between the groups did not change after correction for the confounding variable.
Discussion
The results of our study showed that the QoL of the patients has improved over time in both groups. However, there were no significant differences in the change over time between the 2 groups. The QoL of the caregivers in the control group was higher than in the intervention group after 18 months, but there was no significant difference in the changes since baseline between the groups. Patients in the intervention group showed a significant increase in social activities after 18 months compared with baseline, whereas the social activities of the patients in the control group decreased. The levels of depression of the caregivers in the intervention group changed positively and differently from the levels of depression of the caregivers in the control group within the first 6 months after baseline.
The positive effects on the levels of social activities in the intervention group, of which most effects were shown in the first 6 months, are consistent with earlier studies that showed an improvement in social activities within the first year after a stroke (19, 20). This increased level of social activities is an important gain, because it remains stable over time: approximately 76% of the stroke patients maintained their level of social activities 3 years post-stroke (21). Moreover, other studies have indicated that social inactivity is positively associated with depression and lower levels of QoL (22). The differences in changes in the level of social activities between the intervention and control group within the first 6 months could also be explained by difference in comorbidity. Patients in the intervention group had more locomotor problems and could therefore be more inactive at baseline than patients in the control group. Follow-up care in the intervention could have been more focused on improving the physical condition of patients, which might have led to being more socially active. Jansen and colleagues (21) have recommended that stroke care professionals should direct special attention to patients who are inactive at an early stage after stroke (21). The level of social activities of both groups after 6 months seems to be in line with other studies that have measured social activity in stroke patients at home (1, 21).
The lack of effect could also have a methodological explanation, because the total number of participating patients was lower that the calculated sample size. Lack of effect on the QoL of stroke patients was also found by Boter and colleagues (22) studying the effect of follow-up care by means of telephone follow-up consultations performed by specialized stroke nurses (23). They concluded that follow-up consultations and giving attention and advice alone may not have been enough, and adequate follow-up care should be offered in addition to assessing problems in daily functioning. In the present study, follow-up care was offered to the patients and their caregivers, but the patients received a mean of 3.9 visits instead of the intended 5, 23% received care for 18 months and the follow-up initiated by the SCC after assessment was not as good as intended. This could have reduced the effect of the intervention on the QoL. Perhaps, more attention should have been paid to the follow-up care in addition to assessment. More details about organizational limitations will be discussed in the process evaluation, which was performed in parallel with this study. In addition, part of our control group also received intensive follow-up care, which was developed during the study period, because of the increasing emphasis on more follow-up care for stroke patients in the Netherlands. Interestingly, many patients with relatively good functional outcomes participated in our study.
This study has several strengths and limitations, which should be considered when interpreting the results. A strength is that this study is one of the first controlled studies on long-term care for stroke patients. Furthermore, this study addresses a broad spectrum of stroke-related problems, which were not measured previously in other intervention studies. Thirdly, stroke patients in the primary care setting participated in the study and the study had a reasonable sample size. There are also several limitations. First, the study did not have a randomized design and the results of 2 groups from 2 different regions could be affected by regional differences, which could explain the baseline differences between groups. Next, there may be a population bias because patients with good functional recovery consented to participate. Furthermore, we lost several data due to drop-out of patients and caregivers during the study period. Most patients dropped-out at the beginning of the study because the study put too much burden on the patients early after stroke. This drop-out could have caused a selection bias. In the control region, there was also drop-out due to difficulties during the inclusion period and 8 patients were not interviewed, due to organizational problems. In addition, the follow-up care was developed in the control region during the study period, and this might have decreased the contrast between the 2 groups in our study. Such changes over time cannot be prevented in studies with a longitudinal design, but researchers should be aware of this. Based on our study, we would suggest tight organization in the control region, with rapid inclusion, consistent contact persons and intensive monitoring during the inclusion period.
Our study shows that the long-term care model is effective in terms of social activities but not QoL of stroke patients. We would like to highlight that screening of stroke-related problems could be the first step in providing adequate care. A more structured guideline for referral to stroke care professionals could be necessary in order to gain a substantial additional improvement in the QoL of patients and caregivers. Future research should therefore investigate adequate follow-up care in addition to problem assessment as part of the integrated care pathway. Specific programmes have already been evaluated and showed positive results, such as cognitive rehabilitation (24) for cognitive problems and cognitive behavioural therapy for the treatment of fatigue (25), which are 2 of the main long-term problems.
Acknowledgement
Source of funding. This study was funded by Foundation Annadal, Foundation Elisabeth Strouven, health insurance company VGZ and CZ.
References

