Maxime Gilliaux, PT1, Thierry M. Lejeune, MD, PhD1,2, Christine Detrembleur, PhD1,
Julien Sapin, PhD3, Bruno Dehez, PhD3, Clara Selves, MD2 and Gaëtan Stoquart, MD, PhD1,2
From the 1Université catholique de Louvain, Institute of Neuroscience, 2Université catholique de Louvain, Cliniques universitaires Saint-Luc, Physical Medicine and Rehabilitation Department, Brussels and 3Université catholique de
Louvain, Institute of Mechanics, Materials and Civil Engineering, Louvain-la-Neuve, Belgium
OBJECTIVE: To validate a protocol assessing upper limb kinematics using a planar robot among stroke patients.
DESIGN: Prospective cohort study.
SUBJECTS: Age-matched healthy subjects (n = 25) and stroke patients (n = 25).
METHODS: Various kinematic indices (n = 44) were obtained from 4 tasks performed by subjects with REAplan, a planar end-effector robotic device. The metrological properties of this protocol were studied.
RESULTS: In stroke patients, 43 kinematic indices showed moderate to excellent reliability (intraclass correlation coefficients (ICC) range 0.40–0.95; and minimal detectable changes range 9.9–121.1%). In healthy subjects, 25 kinematic indices showed moderate to excellent reliability (ICC range 0.40–0.91) and 3 indices showed a laterality effect (p < 0.05). Many of these indices (27 of 44) were altered in stroke patients in comparison with healthy subjects (p < 0.05). The Box and Block test (manual dexterity) and Upper Limb Sub-score of the Fugl-Meyer Assessment (motor control) showed moderate to good correlations with, respectively, 13 and 4 indices (r > 0.40). Finally, a principal component analysis allowed the elaboration of a short version of the protocol, reducing the number of indices to 5 (i.e. Amplitude, CVstraightness, Speed Metric, CVjerk metric and CVspeed metric).
CONCLUSION: This study provides a standardized, valid, reliable and sensitive protocol to quantify upper limb impairments in stroke patients, using a planar robot.
Key words: robotics; outcome assessment; biomechanics; stroke; upper extremity; reproducibility of results; reference standards.
J Rehabil Med 2014; 46: 00–00
Correspondence address: Thierry Lejeune, Université catholique de Louvain, Cliniques, universitaires Saint-Luc, Physical Medicine and Rehabilitation Department, Avenue Hippocrate, 10, 1200 Brussels, Belgium. E-mail: thierry.lejeune@uclouvain.be
Accepted Aug 20, 2013; Epub ahead of print Nov 8, 2013
INTRODUCTION
Fifteen million people worldwide experience cerebral vascular accidents each year and one-third of them display permanent neurological impairments (1). Recent recommendations have described the necessity of intensive and prolonged rehabilitation (2) and regular assessments (3) in stroke patients. Robotic devices have the potential to achieve these recommendations because they are able both to intensively rehabilitate (4) and to assess (3, 5) the damaged upper or lower limb.
Several systematic reviews (3, 5) have recommended the use of kinematic measures to assess active movements of the upper limb in stroke patients. These measures can be computed by robotic devices while stroke patients carry out standardized movements with their affected upper limb. Following various treatments, some clinical trials have shown kinematic improvements, using tasks such as reaching to a single target (6, 7), multiple targets (8, 9), moving as far as possible in specific directions (10, 11), or performing hand to mouth movements (7). Among all the kinematic indices computed by these authors, the amplitude (10, 11), speed (7–11), smoothness (6–9), straightness (8, 11) and accuracy (6) of movements showed improvements after treatment in stroke patients.
The metrological properties of kinematic indices can be analysed using several methods, such as construct validity, minimal detectable change (MDC) and reliability. Construct validity examines correlations between different assessment tools (5). Indeed, several kinematic indices seem to be correlated with upper limb motor control (for review, see 3). However, previous studies have not established any correlation between kinematic indices and gross manual dexterity. This relationship could be suggested because motor control of the proximal upper limb, as assessed with kinematics, is important in order to initiate and control the movement to reach the object, when exercising manual dexterity. For example, in the Box and Block test (BB), the subject has to reach the cube before grasping it (12).
The MDC determines if a variable modification corresponds to a true functional change or to a measurement error (13), while reliability assesses the ability of a tool to provide the same results on repeated measures (14). Finley et al. (15) have demonstrated excellent reliability for repeated kinematic assessments with a planar robotic device (MIT-Manus) in healthy adults. Wagner et al. (16) have shown moderate to excellent reliability of various kinematic indices in stroke patients and have computed their MDCs. These indices were obtained from simple forward-reaching tasks using an optical tracking system. No study has examined the reliability and MDC of a protocol assessing kinematics in stroke patients with a robotic device.
Previously, Gilliaux et al. (17) proposed a preliminary protocol including kinematic indices obtained in various tasks, underlining the lack of a gold standard to quantify upper limb movements in stroke patients. REAplan, a planar end-effector robotic device allowing the mobilization of the upper limb in a horizontal plane (18), was used to compute these indices.
The objectives of the present study were as follows: to verify the intra-rater reliability of kinematic indices in stroke patients and healthy subjects; to calculate the MDC in stroke patients; to assess the laterality effect in healthy subjects; to identify which kinematic indices are altered in stroke patients; and to study the construct validity of the protocol.
The secondary objective of this study was to provide a short version of this protocol, allowing researchers and clinicians easily to assess stroke patients’ upper limb kinematics in clinical and research settings, as recommended by Balasubramanian et al. (3).
Methods
Subjects
A total of 50 subjects participated in the study: 25 healthy subjects (control group) and 25 stroke patients (stroke group). The patient’s characteristics are described in Table I. Patient’s inclusion criteria were: a history of ischaemic or haemorrhagic stroke (with no restriction of localization); the ability to understand verbal instructions; and the capacity actively to move the planar end-effector robot without assistance; beyond this capacity, sensitive deficits, muscle strength and spasticity of the affected upper limb were not considered. The patient’s exclusion criterion was the presence of secondary cognitive disorders (i.e. hemineglect, apraxia or comprehension aphasia) that could alter the task execution. In both groups, the exclusion criteria were any other significant orthopaedic (e.g. upper limb fracture, muscle tears, or shoulder and elbow pain) or neurological disease that could alter active mobility of the upper limbs. Both groups were matched for age and body mass index (Table I). Stroke patients were recruited in the rehabilitation department of our Faculty hospital. The study was approved by Ethics Board of our Faculty of Medicine. Each subject freely participated in the study and signed an informed consent.
|
Table I. Characteristics of healthy subjects and stroke patients |
||
|
Characteristics |
Stroke (n = 25) |
Healthy (n = 25) |
|
Gender, male/female, n |
18/7 |
15/10 |
|
Age, years, mean (SD) |
64.8 (15.9) |
63.1 (16.0) |
|
BMI, kg/m2, mean (SD) |
25.6 (2.8) |
23.7 (4.3) |
|
Dominant arm, right/left, n |
24/1 |
23/2 |
|
Affected arm, right/left, n |
5/20 |
N/A |
|
Post-stroke time, months, mean (SD) |
31.5 (55.0) |
N/A |
|
USFMA (0–66), median (IQR) |
51 (37–62) |
N/A |
|
Box and Block test, mean (SD) |
19.7 (14.6) |
N/A |
|
BMI: body mass index; USFMA: Upper Limb Sub-score of the Fugl-Meyer Assessment; N/A: not applicable; IQR: interquartile range; SD: standard deviation. For the age and BMI, there is no significant difference between groups (p-value = 0.70 and 0.07, respectively). |
||
Clinical assessments
In stroke patients, neurological impairments of the affected upper limb were assessed by the Upper Limb Sub-score of the Fugl-Meyer Assessment (USFMA) (19, 20) and the BB (12). The first scale assesses motor control and muscle tone, and the second test assesses the gross manual dexterity of the patient’s upper limb. The results of these assessments are shown in Table I.
Kinematic assessments
Apparatus. The robot used in the present study was the research prototype of a rehabilitation robot named REAplan, which is illustrated in Fig. 1 (18). REAplan is a planar end-effector robot capable of mobilizing the patient’s upper limb in a horizontal plane via a handle that the patient can grasp, or to which the upper limb may be attached via a brace or an orthosis if the hand is too weak.
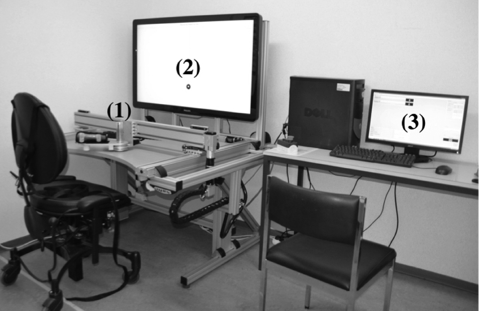
Fig. 1. REAplan. (1): planar end-effector robot; (2): visual interface for the subject; (3): physiotherapist’s interface.
Like most rehabilitation robots, REAplan is equipped with force and position sensors. The former are intended to measure the interaction force between the patient and the robot to determine a reference force through a force controller. The position sensors measure the kinematics of the patient’s hand in order to determine the reference force on a positional basis and on the basis of the specific exercise to be performed with the robot. For this study, the only reference force used was a slightly viscous friction force to avoid the strange sensation of moving the hand on a frictionless surface. For the purposes of the study, the kinematic information provided by the position sensors was recorded during the exercise, allowing us to produce our analyses off-line (acquisition frequency 100 Hz). The planar robot is also equipped with a screen positioned in front of the patient to provide them with visual feedback during the exercise.
Position of subjects. All subjects were installed in an ergonomic and standardized sitting position. The start position of each task was placed at 13 cm in front of the subject. The angle between each subject’s hip and trunk was maintained at 120º to limit lumbar constraints. The subjects’ feet were placed on a footrest to stabilize them, and their trunk was secured in order to minimize compensatory movements.
Tasks. All subjects were requested to perform 4 different tasks with REAplan at spontaneous speeds. The tasks, illustrated in Fig. 2, were presented to subjects via the visual interface (Fig. 1). Movements were performed by the affected arm in stroke patients (n = 25) and the dominant arm in healthy subjects (n = 25). A subgroup of these healthy subjects (n = 15) also performed the tasks with the non-dominant arm to study the effect of laterality on the protocol.
Fig. 2. Requested tasks presented on the visual interface (left-hand graphs), the tasks performed by a healthy subject (middle graphs) and a stroke patient (right-hand graphs).
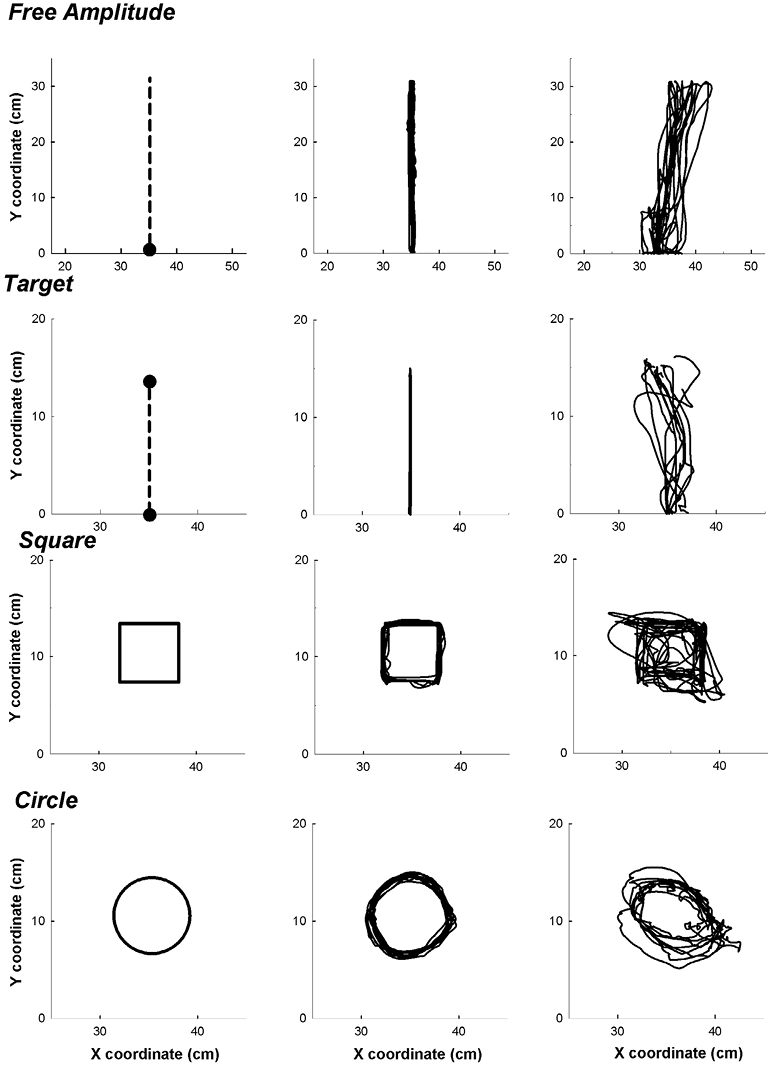
For the Free Amplitude task, the subject had to reach straight out in front of them as far as they could and then bring the arm back to the starting position. For the Target task, the subject made movements in the most precise and direct manner toward a specific target placed at a distance of 14 cm from the starting position and in front of the subject (6). After performing this task, the planar robot brought the subject’s arm back to the starting position. For the Square and Circle tasks, the subject had to draw 2 geometric shapes: a square of 6 cm side and a circle of 4 cm radius. These shapes were drawn in a clockwise direction with the right upper limb, and anti-clockwise with the left upper limb. To summarize this protocol, the subjects performed rhythmic (i.e. Free Amplitude and Circle tasks) and discrete (i.e. Target and Square tasks) movements.
The experiment started with a 10-min training phase in order to limit learning bias. For the data-acquisition phase, the order of tasks was randomly assigned. Each task was performed 10 consecutive times. The rest period between each task was 1 min.
Kinematic analyses. For each task, the elapsed time of the end-effector position was recorded by the planar robot. These variables were analysed for each task by a specific customized program in a LabWindows/CVI (8.5) environment. Each index mentioned below was computed for each of the 10 cycles of movement and then the mean was calculated.
For the Free Amplitude task, the amplitude, speed, straightness, peak speed and 2 smoothness indices (the speed and jerk metrics (21)) were computed. For the Target task, the amplitude index was replaced by an accuracy index. For the Square and Circle tasks, the speed, peak speed, speed metric, jerk metric and shape accuracy indices were computed. The coefficient of variation (CV), calculated from the subjects’ 10 cycles of movement, was computed for each index. Some of these indices are described below.
Straightness corresponds to the amplitude divided by the path length covered by the subject (11) (ratios closer to 1 indicate more rectilinear paths, whereas ratios closer to 0 indicate longer paths to realize the movement). The speed metric (21) corresponds to the ratio of the mean speed and the peak speed (ratios closer to 0 indicate less smooth movements). The jerk metric (21) corresponds to the ratio of the absolute mean jerk (corresponding to the variations of acceleration in function of time) and the peak speed (ratios closer to 0 indicate smoother movements). Accuracy (6) corresponds to the distance between the target position that the subject had to reach and the end position achieved by the subject (higher scores indicate more inaccurate movements). Shape accuracy quantifies the subject’s ability to draw a square or a circle posted on the visual interface. This index corresponds to:
|
∑ni = 1√(Rxi – Pxi)2 + (Ryi – Pyi)2 |
|
n |

where n corresponds to the number of positions acquired during the exercise and related to the analysed shape, Pxi and Pyi correspond to the X and Y coordinates of its positional data point and Rxi and Ryi correspond to the X and Y coordinates of the orthogonal projection of its point on the reference shape (cf. illustration in Fig. 3). Thus, the shape accuracy index corresponds to the mean of the distances between the measured performance points and their corresponding reference points (higher scores indicate less accurate movements).
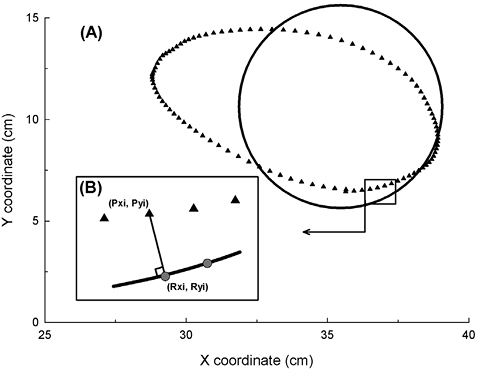
Fig. 3. (A) The circle of reference (black circle) and a circle performed by a stroke patient (black triangle symbols) and of (B) the calculation of the shape accuracy index. Each reference point (grey circle symbol, [Rxi, Ryi]) corresponds to the minimal orthogonal projection of the performance point (Pxi, Pyi) on the shape of reference. The distances between all the related reference and performance points were measured and the mean was calculated to obtain the shape accuracy result.
Statistical analysis
For each section, the normal distribution and equality of variance were verified for all comparisons, and the significance level was 0.05. Statistical tests were performed using SigmaStat 3.5 software (WPCubed GmbH, Munich, Germany), except for reliability (SPSS 16.0 software; SPSS Inc., Chicago, IL, USA) and principal component analysis (PCA) (StatView 5.0 software; SAS Institute, Cary, NC, USA).
Learning effects. The learning effect was assessed through 10 consecutive cycles of movement in 15 stroke patients. Each cycle of movement was analysed separately, and the data were then submitted to a one-way repeated measures analysis of variance (ANOVA).
Intra-rater reliability in stroke patients and healthy subjects. Intra-rater reliability represents the ability to provide the same results on repeated measures in the same subjects using the planar robotic device (14). Some stroke patients (n = 15) and healthy subjects (n = 15) performed all tasks twice, 1–7 days apart.
For each group, we assessed intra-rater reliability with the intraclass correlation coefficient (ICC). The ICC is related to the variability of results across repeated measures within the subjects (i.e. between-subjects variability) and to the measurement error (i.e. within-subject variability) (22). ICC consistency parameters were calculated in a two-way mixed model. Reliability was rated as excellent, moderate or poor, with ICC scores > 0.75, 0.40–0.75 and < 0.40, respectively (14).
Minimal detectable change in stroke patients. The MDC corresponds to the minimal change that exceeds the measurement error in the score. A small MDC corresponds to a better ability to detect a real change in patients (13). The MDC at 95% confidence level (MDC95) was calculated from the data obtained during the intra-rater reliability section for stroke patients and at a 95% confidence interval (95% CI), as follows (16):
|
MDC95 = SEM × 1.96 × √2 |

where 1.96 is the 2-sided z-table value for the 95% CI and is used to account for the variance between 2 measurements. The lower the MDC95, the lower the probability of observing a change related to a measurement error. The standard error of measurement (SEM) is related to the measurement error across repeated measures and was calculated as (16):
|
SEM = SD××√(1 – R×) |

where SDx is the standard deviation for all observations from test sessions 1 and 2, and Rx corresponds to the calculated ICC.
The MDC95 unit is the same as that of the original measurement. To facilitate comparisons between kinematic indices, the MDC% was calculated as (16):
|
MDC% = |
MDC |
×100 |
|
mean |
where the mean is the average of all the observations in stroke patients between the 2 sessions. The lower the MDC%, the lower the probability will be of observing a change related to a measurement error.
Laterality effect in healthy subjects. Fifteen healthy subjects performed the tasks described above with the dominant and non-dominant hands. The dominant hand corresponded to the main hand used in activities of daily living, such as writing. For each kinematic index, a paired t-test was performed to assess which kinematic indices were influenced by laterality.
Comparisons between stroke and healthy subjects. Age-matched stroke patients (n = 25) and healthy subjects (n = 25) performed the tasks described above with their impaired and dominant upper limb, respectively. For each kinematic index, a one-way ANOVA was performed to determine the kinematic indices that were altered in stroke patients.
Construct validity. Correlations between each kinematic index and clinical assessments were analysed by: (i) a Pearson correlation test for the BB; and (ii) a Spearman’s correlation test for the USFMA in 25 patients. A correlation was good, moderate or poor if the correlation coefficient (r) was > 0.60, 0.30–0.60 or < 0.30, respectively (14).
Principal component analysis (PCA). PCA determines several orthogonal axes (Varimax), called principal components, composed of a set of correlated kinematic indices. The number of principal components was the smallest one representing at least 75% of the variance. Correlations between the 44 indices assessed in 25 stroke patients were established in 2 steps.
First, for each individual task, the kinematic indices were included in a PCA to provide the index most correlated to each principal component. Secondly, from all the indices selected in the first step, a PCA was performed to provide, for all merged tasks, those that were the most correlated to each principal component. These last selected indices were put together to provide a short version of the protocol.
Results
Among the 25 patients, 2 could not perform the geometric tasks because of limited motor control (i.e. USFMA = 7 and 8/66). All results are shown in Tables II–IV and are illustrated in Fig. 2.
No learning effect was found for the different tasks (data not shown). Indeed, for each index, the results of the 10 consecutive cycles of movement were similar (p-value > 0.05). A laterality effect was shown in only 3 indices of the Free Amplitude task. Indeed, the amplitude and the straightness indices were, respectively, 1.6 cm and 0.02 lower for the non-dominant upper limb in healthy subjects, and the jerk metric index was 4.8/s2 higher for this limb (p-value < 0.04).
In stroke patients, all indices of the Free Amplitude and Target tasks had a moderate to excellent reliability (ICC range 0.50–0.95, Table II), except the CVpeak speed index of the Target task, which presented poor reliability (ICC=0.04). All indices of the 2 geometric shapes had a moderate to excellent reliability (ICC range 0.40–0.93). In healthy subjects and for all merged tasks, 25/44 kinematic indices had moderate to excellent reliability (ICC range 0.40–0.91).
|
Table II. Results of intra-rater reliability and MDC in 15 stroke patients for each task and index |
|||||
|
Stroke patients (n = 15) |
ICC |
MDC95 |
MDC% |
||
|
Session 1 Mean (SD) |
Session 2 Mean (SD) |
||||
|
Free amplitude |
|||||
|
Amplitude, cm |
29.8 (2.9) |
29.5 (3.4) |
0.84 |
3.4 |
11.6 |
|
CVamplitude, % |
3.6 (2.5) |
3.6 (2.3) |
0.82 |
2.8 |
77.4 |
|
Speed, cm/s |
10.9 (5.5) |
9.7 (5.7) |
0.95 |
3.4 |
33.2 |
|
CVspeed, % |
17.4 (6.0) |
16.2 (7.1) |
0.80 |
8.0 |
47.8 |
|
Straightness |
0.90 (0.11) |
0.88 (0.09) |
0.90 |
0.09 |
9.9 |
|
CVstraightness, % |
5.7 (6.2) |
6.5 (5.3) |
0.78 |
7.4 |
121.6 |
|
Peak speed, cm/s |
30.8 (11.3) |
28.7 (11.3) |
0.95 |
6.8 |
22.7 |
|
CVpeak speed, % |
22.0 (16.0) |
25.5 (25.0) |
0.88 |
19.8 |
83.5 |
|
Jerk metric, 1/s2 |
30.3 (7.0) |
32.4 (10.7) |
0.88 |
8.6 |
27.4 |
|
CVjerk metric, % |
20.5 (7.7) |
19.2 (5.8) |
0.57 |
12.2 |
61.7 |
|
Speed metric |
0.35 (0.09) |
0.33 (0.09) |
0.77 |
0.12 |
33.7 |
|
CVspeed metric, % |
18.2 (6.3) |
19.0 (8.6) |
0.72 |
10.9 |
58.3 |
|
Target |
|
||||
|
Accuracy, cm |
1.7 (0.8) |
1.5 (0.9) |
0.80 |
1.0 |
63.0 |
|
CVaccuracy, % |
37.6 (12.8) |
37.3 (12.2) |
0.50 |
24.0 |
64.2 |
|
Speed, cm/s |
6.9 (4.0) |
6.5 (4.2) |
0.88 |
3.8 |
57.6 |
|
CVspeed, % |
25.2 (11.8) |
23.2 (8.4) |
0.53 |
19.3 |
79.5 |
|
Straightness |
0.89 (0.09) |
0.91 (0.08) |
0.69 |
0.13 |
14.6 |
|
CVstraightness, % |
7.9 (6.3) |
7.1 (5.8) |
0.82 |
7.0 |
93.5 |
|
Peak speed, cm/s |
16.9 (8.0) |
15.4 (8.4) |
0.87 |
8.1 |
50.3 |
|
CVpeak speed, % |
26.0 (8.1) |
26.6 (9.9) |
0.04 |
24.2 |
91.9 |
|
Jerk metric, 1/s2 |
55.9 (17.3) |
59.2 (30.0) |
0.85 |
25.9 |
44.9 |
|
CVjerk metric, % |
22.0 (6.9) |
24.2 (12.2) |
0.73 |
14.1 |
60.9 |
|
Speed metric |
0.41 (0.08) |
0.42 (0.06) |
0.77 |
0.09 |
22.4 |
|
CVspeed metric, % |
19.8 (5.8) |
15.1 (4.3) |
0.61 |
9.6 |
54.7 |
|
Square |
|
||||
|
Speed, cm/s |
9.5 (3.7) |
8.7 (4.5) |
0.93 |
3.0 |
32.8 |
|
CVspeed, %) |
21.3 (9.7) |
17.7 (7.5) |
0.59 |
15.5 |
79.4 |
|
Peak speed, cm/s |
30.7 (7.3) |
29.5 (9.5) |
0.93 |
6.1 |
20.4 |
|
CVpeak speed, % |
19.5 (5.4) |
19.5 (6.8) |
0.44 |
12.6 |
64.6 |
|
Jerk metric, 1/s2 |
33.2 (6.4) |
32.5 (8.8) |
0.74 |
10.7 |
32.5 |
|
CVjerk metric, % |
20.1 (7.0) |
21.6 (4.7) |
0.60 |
10.3 |
49.6 |
|
Speed metric |
0.31 (0.08) |
0.30 (0.06) |
0.80 |
0.09 |
29.0 |
|
CVspeed metric, % |
18.6 (7.5) |
20.2 (7.4) |
0.51 |
14.2 |
73.2 |
|
Shape accuracy, cm |
1.7 (0.5) |
1.5 (0.3) |
0.45 |
0.8 |
52.0 |
|
CVshape_accuracy, % |
17.8 (9.5) |
15.6 (6.9) |
0.46 |
16.5 |
99.2 |
|
Circle |
|
||||
|
Speed, cm/s |
14.8 (7.6) |
14.2 (8.3) |
0.89 |
7.2 |
49.6 |
|
CVspeed, % |
19.5 (10.4) |
16.3 (8.2) |
0.87 |
9.4 |
52.3 |
|
Peak speed, cm/s |
35.4 (13.6) |
33.7 (12.9) |
0.87 |
13.0 |
37.7 |
|
CVpeak speed, % |
17.4 (8.4) |
17.3 (7.4) |
0.81 |
9.4 |
54.0 |
|
Jerk metric, 1/s2 |
35.2 (10.0) |
34.1 (13.4) |
0.80 |
14.4 |
41.7 |
|
CVjerk metric, % |
19.9 (7.7) |
21.4 (8.0) |
0.49 |
15.4 |
74.6 |
|
Speed metric |
0.41 (0.08) |
0.41 (0.10) |
0.76 |
0.12 |
29.5 |
|
CVspeed metric, % |
15.2 (5.2) |
15.7 (9.8) |
0.57 |
13.9 |
90.0 |
|
Shape accuracy, cm |
1.0 (0.3) |
0.9 (0.5) |
0.77 |
0.5 |
57.8 |
|
CVshape_accuracy, % |
29.1 (8.8) |
27.7 (12.9) |
0.40 |
23.4 |
82.4 |
|
Indices that showed a moderate to excellent reliability are shown in bold (ICC > 0.4). CV: coefficient of Variation; MDC: minimal detectable change; MDC95: MDC at 95% confidence level; SD: standard deviation; ICC: intraclass correlation coefficients. |
|||||
The MDC% was calculated for each index (Table II). The indices the most likely to detect a change in patients were:
• the amplitude, speed, straightness, peak speed, jerk metric and speed metric indices of the Free Amplitude task (MDC% range 9.9–33.7%);
• the straightness and speed metric indices of the Target task (MDC% were 14.6% and 22.4%, respectively);
• the speed, peak speed, jerk metric and speed metric indices of the Square task (MDC% range 20.4–32.8%);
• the peak speed and speed metric indices of the Circle task (MDC% were 37.7% and 29.5%, respectively).
For the 4 merged tasks, 27 of 44 indices were significantly altered in stroke patients (p-value < 0.05) (Table III). This result was partly related to the fact that the 10 cycles of movements were less identical in stroke patients than in healthy subjects. Indeed, the significantly altered CV indices were higher (difference range 2.4–12.8%) in the stroke group. Secondly, the stroke patients’ movements were less smooth for all tasks. Indeed, the jerk metric (excepting for the Square task) was higher (difference range 5.7–14.5/s2) and the speed metric was lower (difference range 0.06–0.10) in the stroke group. Thirdly, movements of unidirectional tasks were less rectilinear in patients: ratios were 0.09 (Target task) and 0.10 (Free Amplitude task) lower in the stroke group. Finally, movements were less accurate by 1.6 cm for the Target task and by 0.4 cm (Circle task) and 0.6 cm (Square task) for the geometric tasks in the stroke group. The movements of the Target and Square tasks had a higher peak speed of 5.5 cm/s and 5.9 cm/s in the stroke group, respectively.
The construct validity studied the correlation between each kinematic index and clinical scales. The indices that showed moderate to good correlations with the manual dexterity assessed with BB were (Table III):
• CVspeed and straightness indices of the Free Amplitude task (r = –0.41 and 0.42, respectively);
• the speed, CVspeed, straightness, accuracy, peak speed, CVpeak speed and CVspeed metric indices of the Target task (r range –0.60 to –0.41);
• the shape accuracy index of the Square task (r = –0.41);
• the CVspeed, CVpeak speed and the CVjerk metric indices of the Circle task (r range –0.46 to –0.61).
|
Table III. Results of the one-way repeated measures analysis of variance (ANOVA) test comparing 25 stroke patients and 25 healthy subjects, the Pearson correlation test (BB) and the Spearman’s correlation test (USFMA) in 25 stroke patients for each task and index |
||||
|
Stroke (n = 25) Mean (SD) |
Healthy (n = 25) Mean (SD) |
Correlation coefficient (r) |
||
|
BB |
USFMA |
|||
|
Free amplitude |
||||
|
Amplitude, cm |
26.2 (7.3) |
29.2 (3.0) |
0.30 |
0.22 |
|
CVamplitude, % |
4.5 (3.1)*** |
2.1 (1.6) |
–0.35 |
–0.34 |
|
Speed, cm/s |
10.2 (6.4) |
10.5 (3.9) |
–0.30 |
–0.16 |
|
CVspeed, % |
18.3 (8.2)** |
12.1 (5.7) |
–0.41 |
–0.32 |
|
Straightness |
0.89 (0.1)*** |
0.98 (0.02) |
0.42 |
0.28 |
|
CVstraightness, % |
5.5 (5.3)*** |
1.6 (1.4) |
–0.27 |
–0.31 |
|
Peak speed, cm/s |
27.6 (12.7) |
23.6 (6.8) |
–0.34 |
–0.20 |
|
CVpeak speed, % |
22.9 (17.7) |
15.7 (10.3) |
0.06 |
0.08 |
|
Jerk metric, 1/s2 |
33.0 (9.0)*** |
26.0 (3.9) |
–0.38 |
–0.31 |
|
CVjerk metric, % |
21.1 (6.9) |
17.5 (6.9) |
–0.24 |
–0.21 |
|
Speed metric |
0.36 (0.09)*** |
0.44 (0.06) |
0.04 |
0.02 |
|
CVspeed metric, % |
18.2 (6.1)*** |
11.4 (5.2) |
–0.27 |
–0.23 |
|
Target |
||||
|
Accuracy, cm |
2.6 (2.8)** |
1.0 (0.4) |
–0.51 |
–0.20 |
|
CVaccuracy, % |
39.4 (16.5) |
47.3 (15.6) |
–0.07 |
0.06 |
|
Speed, cm/s |
6.5 (3.8) |
5.1 (1.7) |
–0.44 |
–0.38 |
|
CVspeed, % |
30.2 (15.3) |
27.0 (18.4) |
–0.57 |
–0.51 |
|
Straightness |
0.88 (0.11)** |
0.98 (0.3) |
0.41 |
0.33 |
|
CVstraightness, % |
9.8 (12.2)** |
1.7 (1.4) |
–0.37 |
–0.32 |
|
Peak speed, cm/s |
15.9 (7.7)** |
10.4 (2.5) |
–0.52 |
–0.47 |
|
CVpeak speed, % |
29.8 (10.3) |
30.0 (16.5) |
–0.60 |
–0.37 |
|
Jerk metric, 1/s2 |
52.9 (17.3)** |
38.4 (12.8) |
–0.24 |
–0.30 |
|
CVjerk metric, % |
26.8 (12.5) |
35.5 (16.3) |
–0.03 |
–0.06 |
|
Speed metric |
0.41 (0.07)*** |
0.49 (0.07) |
0.13 |
0.21 |
|
CVspeed metric, % |
22.7 (10.0)** |
15.5 (5.6) |
–0.53 |
–0.31 |
|
Square |
||||
|
Speed, cm/s |
8.7 (3.9) |
8.5 (2.6) |
–0.06 |
–0.01 |
|
CVspeed, % |
21.1 (9.1)*** |
8.3 (2.3) |
–0.36 |
–0.13 |
|
Peak speed, cm/s |
29.2 (8.1)** |
23.3 (5.3) |
–0.31 |
–0.14 |
|
CVpeak speed, % |
19.6 (6.2) |
14.1 (14.0) |
–0.11 |
–0.01 |
|
Jerk metric, 1/s2 |
31.4 (7.0) |
31.9 (7.5) |
0.03 |
–0.13 |
|
CVjerk metric, % |
20.5 (7.9) |
17.4 (5.3) |
0.23 |
0.12 |
|
Speed metric |
0.30 (0.08)*** |
0.36 (0.05) |
0.25 |
0.12 |
|
CVspeed metric, % |
18.6 (6.7)*** |
12.3 (4.8) |
–0.28 |
–0.12 |
|
Shape accuracy, cm |
1.8 (1.0)** |
1.2 (0.1) |
–0.41 |
–0.14 |
|
CVshape_accuracy, % |
18.5 (10.3)** |
11.7 (5.9) |
–0.30 |
–0.13 |
|
Circle |
||||
|
Speed, cm/s |
13.7 (7.5) |
13.8 (5.4) |
0.05 |
–0.28 |
|
CVspeed, % |
19.7 (9.7)*** |
9.9 (4.4) |
–0.61 |
–0.49 |
|
Peak speed, cm/s |
34.1 (13.8) |
27.6 (8.3) |
–0.04 |
–0.31 |
|
CVpeak speed, % |
16.5 (7.3)*** |
10.0 (3.5) |
–0.46 |
–0.31 |
|
Jerk metric, 1/s2 |
34.3 (10.4)* |
28.6 (7.9) |
–0.23 |
–0.41 |
|
CVjerk metric, % |
19.1 (7.6 |
16.7 (5.6) |
–0.60 |
–0.61 |
|
Speed metric |
0.39 (0.10)*** |
0.49 (0.06) |
0.32 |
–0.11 |
|
CVspeed metric, % |
14.8 (5.5)*** |
9.3 (3.7) |
–0.32 |
–0.32 |
|
Shape accuracy, cm |
1.0 (0.6)** |
0.6 (0.3) |
–0.13 |
–0.15 |
|
CVshape_accuracy, % |
29.1 (13.8)** |
19.7 (6.7) |
–0.19 |
–0.06 |
|
*Corresponds to the indices significantly altered in stroke patients (*p < 0.05; **p < 0.01; ***p < 0.001). Indices with a significant correlation (p < 0.05) are in bold. USFMA: Upper Limb Sub-score of the Fugl-Meyer Assessment; BB: Box and Block test; CV: coefficient of variation; SD: standard deviation. |
||||
The indices that showed moderate to good correlation with motor control assessed with the USFMA were (Table III) the CVspeed and peak speed indices of the Target task (r = –0.51 and –0.47, respectively); the CVspeed and the CVjerk metric indices of the Circle task (r = –0.49 and –0.61, respectively).
A PCA was carried out to determine a short version of the protocol (Table IV). The first step of the PCA enabled us to select 4 representative kinematic indices of the Free Amplitude task and 3 indices for each of the other tasks. It enabled us to determine the 5 most representative indices, obtained from all tasks, allowing 79% of the variance. There were the amplitude and the CVstraightness of the Free Amplitude task, the peak speed of the Target task, the CVjerk metric of the Square task and the CVspeed metric of the Circle task.
|
Table IV. Results of the second step of the principal component analysis (PCA) in 25 stroke patients for the 13 kinematic indices selected in the first step of the PCA |
|||||
|
PC 1 (r) |
PC 2 (r) |
PC 3 (r) |
PC 4 (r) |
PC 5 (r) |
|
|
Free amplitude |
|||||
|
Amplitude, cm |
0.06 |
0.18 |
0.34 |
0.79 |
0.07 |
|
CVstraightness, % |
0.00 |
–0.86 |
0.01 |
–0.23 |
0.05 |
|
Peak speed, cm/s |
0.81 |
0.33 |
0.02 |
0.32 |
–0.11 |
|
CVspeed metric, % |
–0.20 |
–0.56 |
0.46 |
–0.14 |
–0.08 |
|
Target |
|||||
|
Peak speed, cm/s |
0.93 |
0.07 |
0.13 |
0.06 |
–0.18 |
|
CVjerk metric, % |
–0.60 |
–0.09 |
–0.15 |
0.38 |
0.21 |
|
Speed metric |
0.83 |
–0.15 |
–0.17 |
–0.05 |
0.17 |
|
Square |
|||||
|
Speed, cm/s |
0.36 |
0.61 |
–0.08 |
0.44 |
–0.36 |
|
CVjerk metric, % |
–0.08 |
0.00 |
0.09 |
0.14 |
0.92 |
|
CVshape_accuracy, % |
0.24 |
0.64 |
0.36 |
–0.36 |
0.36 |
|
Circle |
|||||
|
CVspeed, % |
–0.06 |
–0.21 |
0.37 |
–0.71 |
–0.13 |
|
Jerk metric, 1/s2 |
0.86 |
0.28 |
–0.04 |
0.08 |
0.05 |
|
CVspeed metric, % |
0.06 |
–0.02 |
0.86 |
0.04 |
0.12 |
|
Variance proportions, % |
33 |
17 |
12 |
9 |
8 |
|
PC: principal component; CV: coefficient of variation. For each principal component, the correlated indices are in bold, and the most correlated index is underlined. |
|||||
Discussion
Main objective: metrological properties of a standardized protocol
The objective of pursuing the development of a preliminary protocol (17), designed to quantitatively assess upper limb kinematics in stroke patients by using the REAplan robotic device was reached by analysing a number of metrological properties for the protocol.
Our results showed that some indices appear to be particularly useful in discriminating between patients and healthy subjects. The straightness (unidirectional tasks) and the smoothness (all tasks) of movements were altered in patients, confirming the results of several authors (8, 11, 17, 21, 23). The coefficient of variation was also abnormal in patients, and appears to be useful in assessing the ability to maintain a similar pattern of movement in repetitive tasks. Even if some patients (n = 19) performed movements with their affected but non-dominant upper limb, it did not influence the comparison between groups. Indeed, our results showed that almost all the kinematic indices (41/44) were not influenced by laterality.
In stroke patients, the demonstration of a high reliability of kinematic indices obtained from various tasks is in agreement with Wagner et al. (16). Indeed, these authors have also shown moderate to excellent reliability of kinematic indices obtained from a simple forward-reaching task measured with an optical tracking system. Only one index, the coefficient of variation of peak speed index (free amplitude task), should be excluded from the present protocol because of its poor reliability. However, many indices (19/44) showed poor reliability in healthy subjects. De Vet et al. (22) thought that ICC analyses in healthy subjects could be negatively influenced by the small variability between healthy subjects. A paired t-test was carried out and revealed no significant difference between the 2 sessions for each kinematic index (p-value > 0.05). This analysis suggests that all the indices may be reliable in healthy subjects.
The MDC was used to determine the minimal change that exceeds the measurement error in each index score (13, 16). A real improvement in upper limb kinematic indices in stroke patients could only be suggested when this improvement exceeds the MDC values given in our results (Table II).
The construct validity of our protocol was determined by showing some correlations between kinematic indices and clinical scales. A recent review has reported correlations with the USFMA, but has not reported any correlation with the BB (3). The present study confirms that some kinematic indices could have correlations with the motor control of the upper limb, as assessed by the USFMA (3). However, our study demonstrates that an even larger number of kinematic indices have correlations with gross manual dexterity assessed by the BB. The proximal motor control of the upper limb, involved in USFMA and BB, could explain these correlations. However, the better correlation observed with the BB test could be related to the parametric statistics used, which was not the case for the USFMA. Correlations could have been better if the proximal and distal items of the USFMA had been split up. However, the whole score of USFMA was chosen because no study has validated a subscale of the Fugl-Meyer scale for the proximal upper limb only (5).
The poor correlation of some indices (e.g. smoothness in all tasks) could be because our protocol is able to reflect some specific movement characteristics that are otherwise difficult to quantify and that are not traditionally assessed by clinical scales. The kinematics, BB and USFMA assess the body functions and structures domain of the International Classification of Functioning Disability and Health (ICF) (5). Further studies should determine the correlations between kinematics and the other ICF domains, such as activity (e.g. ABILHAND (24)) and social participation (e.g. SATIS-Stroke (25)).
The kinematic results were compared between the dominant and non-dominant hand in healthy subjects. Surprisingly, the majority of the variables were not affected by hand dominance. A difference between the dominant and non-dominant sides was found in only 3 of 44 indices. This difference was slight and lower than the MDC assessed in stroke patients (Table II). This symmetry could be related to the major contribution of the shoulder and elbow when using REAplan. Greater involvement of the wrist and the hand could lead to a larger laterality effect. Indeed, Ozcan et al. (26) suggested that the digital dexterity (as assessed by the VALPAR Component Work Sample-4) was better for the dominant hand than for the non-dominant one.
Second objective: a standardized short protocol
The second objective of this study was to provide a short version of this protocol. Our study investigated a large variety of tasks and indices that involved elements of unidirectional (i.e. free amplitude and target tasks) or multidirectional/graphical (i.e. Circle and Square tasks) movements. Moreover, these tasks could be rhythmic (i.e. Free Amplitude and Circle tasks) or discrete (i.e. Target and Square tasks), which involves different neuronal mechanisms (27–29).
The short version of the protocol requires all tasks and 5 indices. However, for the Target task, the Peak Speed index should be replaced by the Speed Metric index for the 2 following reasons. First, these 2 indices are highly correlated with the first principal component (Table IV). Secondly, the Speed Metric index shows higher alteration in stroke patients and higher change after a treatment than the Peak Speed one (8, 17, 21). The final short protocol and its metrological properties are shown in Table V. This short version could facilitate the use and acceptance of robotic assessment in routine clinical practice, as recommended by Balasubramanian et al. (3). Indeed, clinicians could use this short protocol to monitor the patients’ improvements easily during their rehabilitation. This protocol could also help clinicians to define and adapt the patients’ rehabilitation programme. Further studies should be conducted to determine the sensitivity to change of this short version by assessing upper limb improvements in stroke patients during recovery.
|
Table V. Metrological properties of the short kinematic protocol |
||
|
ICC |
MDC% |
|
|
Free amplitude |
||
|
Amplitude, cm |
0.84 |
11.6 |
|
CVstraightness, %* |
0.78 |
121.6 |
|
Target |
|
|
|
Speed metric* |
0.77 |
22.4 |
|
Square |
|
|
|
CVjerk metric, % |
0.60 |
49.6 |
|
Circle |
|
|
|
CVspeed metric, %* |
0.57 |
90.0 |
|
Indices that showed a moderate to excellent reliability are in bold (ICC > 0.4). *Indices significantly altered in stroke patients (p < 0.001). No index is significantly altered in the non-dominant upper limb (p > 0.05). No index is correlated with BB and USFMA. CV: coefficient of variation; USFMA: Upper Limb Sub-score of the Fugl-Meyer Assessment; BB: Box and Block test; ICC: intraclass correlation coefficients; MDC%: minimal detectable change %. |
||
Limitations and perspectives
There were several limitations to the present study. First, the REAplan conception allows end-effector movements in 2 spatial dimensions only (2D), which could limit its benefits in kinematic assessment and in rehabilitation. However, from planar distal movements, the shoulder and elbow movements involve 3D displacements. Further studies could apply this protocol to a 3D exoskeleton robotic device (18, 30) or assess upper limb movements in 3D with an optical tracking system (31).
Secondly, 3 tasks (i.e. Circle, Square and Target tasks) were made in a short workspace, which could limit their relevance. This choice is justified for the following reasons: previous studies showed that reaching targets placed at a distance of 14 cm in front of the subject was enough to objectify altered movements in stroke patients (21). The shapes were smaller than in a previous study (17) in which the most severely affected patients had difficulty drawing the shapes because of their large size.
Conclusion
This study provides a standardized, valid, reliable, sensitive and concise kinematic protocol for the objective and quantitative assessment of upper limb impairments in stroke patients using a planar robotic device such as REAplan. A short protocol was provided, reducing the number of indices to 5 (i.e. Amplitude, CVstraightness, Speed Metric, CVjerk metric and CVspeed metric). Future studies should extend the use of this assessment tool to other patient populations, such as those with cerebral palsy, orthopaedic trauma, or Parkinson’s disease. This protocol is independent of the REAplan and could be implemented with other devices. A robot is not only a rehabilitation tool, but also an assessment tool. It offers more specific and accurate kinematic indices than we could obtain with pencil movements performed on a sheet of paper. This device enables easy and rapid evaluation of upper limb kinematics, which could be useful both in daily clinical practice and in clinical research.
Acknowledgements
This work was supported by the Saint-Luc Foundation. The authors would like to thank Martin Vanderwegen, Florence Leborne and Emeline Bruyr for their collaboration and all the subjects for their participation in this study.
REFERENCES

