Maria Borland, MSc1,2,3, Agneta Rosenkvist, BSc1 and Åsa, CiderPhD3,4
From the 1NärRehab Physiotherapy Unit, Primary Health Care, 2Research and Development Center, Primary Health Care, Södra Älvsborg, Region Västra Götaland, 3Institute of Neuroscience and Physiology/Physiotherapy, Sahlgrenska Academy, University of Gothenburg and 4Department of Physiotherapy and Occupational Therapy, Sahlgrenska University Hospital, Gothenburg, Sweden
OBJECTIVE: To investigate how group-based exercise affects the levels of physical activity, physical fitness and health- related quality of life (HRQoL) in patients with chronic heart failure and comorbidities.
DESIGN: Randomized controlled trial.
Patients: A total of 48 patients (10 women, 38 men), mean age 71 years (standard deviation 8 years), ejection fraction 27% (standard deviation 10%), and New York Heart Association functional class II–III.
METHODS: A bicycle test, 6-min walk test (6MWT) and muscle endurance tests were performed. Physical activity was assessed with a pedometer and the International Physical Activity Questionnaire (IPAQ), HRQoL was evaluated with the Short Form-36 (SF-36). Patients were randomized to control or intervention groups. Intervention consisted of an individually designed group-based exercise programme twice a week, for a period of 3 months. Subjects in the control group were asked to continue with their usual lives.
RESULTS: A total of 42 patients completed the study, and 6 dropped-out. Steps/day did not increase significantly after intervention (p = 0.351), but IPAQ score did (p = 0.008). Exercise tolerance (p = 0.001), 6MWT (p = 0.014), shoulder abduction (p = 0.028), heel lift (p < 0.0001) and HRQoL (p = 0.018) improved significantly in the intervention group compared with the control group.
CONCLUSION: Group-based exercise did not improve the level of physical activity in patients with chronic heart failure and comorbidity; however, physical fitness and HRQoL were significantly improved.
Key words: physical fitness; pedometer; IPAQ; HRQoL; physical activity; exercise.
J Rehabil Med 2014; 46: 00–00
Correspondence address: Maria Borland, Närhälsan Sörhaga rehabmottagning, Sörhaga, SD-441 83 Alingsås, Sweden. E-mail: maria.borland@vgregion.se
Accepted Dec 16, 2013; Epub ahead of print Mar 28, 2014
Introduction
Chronic heart failure (CHF) is a severe and common disease. Due to improved medical care and increased longevity, it is increasing in prevalence globally, especially among the elderly population (1). CHF markedly impairs physical function and health-related quality of life (HRQoL), which results in negative consequences for all domains of patients’ activities of daily living (2). Several studies during the last two decades have shown that exercise, along with optimal medical treatment, has a beneficial impact on signs and symptoms of CHF (3). It is also common for patients with CHF to have comorbidities. Dahlström et al. (4) showed that > 40% of the patients had more than 5 non-cardiac co-morbidities except for the CHF (4). The 4 most common were chronic obstructive pulmonary disease, hypertension, diabetes and anaemia, which occurred in 20–30% of CHF patients. Properly tailored exercise in patients with CHF increases maximal oxygen uptake, walking distance and muscle mass. These variables are of the utmost importance, whereby they are negatively correlated with morbidity and mortality in CHF (3).
It is well known in healthy people that sufficiently high levels of physical activity reduce and postpone the development of several diseases, and reduce the risk of premature mortality (5). An association was recently shown between prolonged sitting and all-cause mortality in healthy people, as well as in patients with chronic afflictions such as cardiovascular disease and diabetes. This association remained strong even when the healthy person or patients were physically active (6). Physical activity differs from exercise, although the two concepts are often erroneously used as synonyms among healthcare professionals. Physical activity is any bodily movement produced by skeletal muscles that results in energy expenditure, and exercise is defined as “Physical activity that is planned, structured, repetitive and purposive in the sense that improvement or maintenance of one or more components of physical fitness is an objective” (7). Physical fitness is a set of attributes that are either health- or skill-related. These attributes can be either native or acquired and contribute to the performance of a physical activity. Physical fitness is defined as “a set of attributes that people have or achieve that relates to the ability to perform physical activity” (7).
In several chronic illnesses, including CHF, a low level of physical activity is not uncommon. One review showed that healthy elderly adults took approximately 6,000–8,000 steps/day compared with 3,500–5,000 steps/day for individuals living with disabilities and chronic illnesses (8). A more recent review shows that an individual with disabilities and chronic illness took 1,214–8,008 steps/day compared with healthy adults who took approximately 2,000–9,000 steps/day. The wide range of steps/day might indicate that living with a disability or chronic illness may not always reduce a person’s ability to be physically active (9). It has not yet been investigated whether an increased level of physical activity positively impacts persons with CHF as does individually prescribed exercise. Furthermore, it is not known whether exercise per se can increase physical activity levels in individuals with CHF.
The difficulty of measuring physical activity is often discussed among researchers (8, 10). Pedometers have been used in several studies to measure steps/day, which is one dimension of activities of daily living. However, others have failed to show a correlation between improvements in exercise tolerance and pedometer-assessed steps/day (11, 12). This might indicate that individuals have adapted their lifestyle without changing their daily number of steps, despite improvements in exercise tolerance. Furthermore, low pedometer scores have been shown to be a strong predictor of death (13).
When pedometers are compared with self-reported, physical activity questionnaires the correlation is low between pedometer output and self-reported physical activity. However, even if correlation is low, this provides an opportunity to study objective and subjective measurements of physical activity (10, 14). Several authors have discussed the need for different protocols for measuring a patient’s daily physical activity level (11, 13).
HRQoL is often reduced in CHF due to experienced limitations in physical activity, breathlessness and fatigue (2). In studies investigating exercise and HRQoL, improvements have been seen to be associated with increased as well as decreased physical fitness (15). It has been discussed whether parameters other than physical fitness influence HRQoL (2).
The primary aim of this study was to investigate the impact of group-based exercise on physical activity levels in patients with CHF. The secondary aim was to study the impact of group-based exercise on physical fitness and whether there was an association between baseline values for physical activity, physical fitness, sitting time and HRQoL.
Methods
Patients
Patients (n = 53) with stable CHF in the New York Heart Association (NYHA) functional class II–III were recruited from hospitals and primary healthcare in south-western Sweden between 2009 and 2011. Inclusion criteria were: a stable CHF, NYHA functional class II–III. Exclusion criteria were: difficulties in carrying out the study exercise protocols, and insufficient command of the Swedish language. After baseline testing, patients were randomized to an intervention or control group in a 1:1 ratio in a stratified order with respect to gender, age and distance walked in the 6-min walk test (6MWT).
The intervention group received a 3-month, group-based exercise. Subjects in the control group were asked to continue with their usual lives during the 3-month control period, and thereafter were invited to take part in a 3-month exercise programme.
An independent physiotherapist performed the tests below at baseline and post-test. Randomization was carried out by a person uninvolved in the study at the NärRehab Physiotherapy Unit, Primary Health Care, Södra Älvsborg, Sweden. Plots were kept in signed envelopes made by a person who was not involved in the study.
The investigation conformed to the principles of the Declaration of Helsinki. The Regional Ethics Committee of Gothenburg approved the research protocol and written informed consent was obtained from the subjects.
Training programme
The group-based exercise programme comprised 60-min sessions twice a week for 3 months. The exercise regime included an individual exercise programme focused on peripheral muscle training; aerobic exercise performed on an ergometer cycle and balance exercises. The individual exercise programme was designed after the performed physical fitness tests, and consisted of 15 min of ergometer cycling, including a warm-up/cool-down period, with an intensity of 12–13 on Borg’s scale for ratings of perceived exertion (RPE scale 6–20) and/or Category Ratio scale, dyspnoea 2–3 (20), exercises for lower and upper body, such as heel lift, seated quadriceps exercise and leg press, and dumbbell exercises for elbow flexion- and extension, and seated rowing for shoulder and scapula muscles. Each training programme consisted of a total of 8–12 exercises, 10–12 repetitions, and 2 sets, with an intensity of 12–13 on the RPE 6–20 scale and or Category Ratio scale, dyspnoea 2–3 (20). For balance, individual exercises were also included; for example, standing with feet close together, one leg standing, standing on different surfaces with or without closed eyes. The programme was intended to improve physical fitness and the amount of physical activity in daily life.
Test procedures
Physical activity. Physical activity was measured by the following tests: to measure daily physical activity patients were instructed to use a KeepWalking LS2000 pedometer (KeepWalking Scandinavia, Kalmar, Sweden), attached at the waist for 7 days at baseline and at 3 months. Overweight patients were instructed to place the pedometer on their ankles. Patients were instructed to wear the pedometer throughout the day and register the total number of steps on a log sheet at bedtime, and reset the device to zero each morning (8). The validity and reliability of this pedometer has been proven satisfactory in adult populations (16).
Self-reported physical activity was measured by means of the short-form International Physical Activity Questionnaire (IPAQ), which was developed to compare measurements of self-reported physical activity levels across countries. Together with an objective measurement it can be used in an attempt to describe an individual physical activity level. However, a recently published review showed that the use of the IPAQ-SF questionnaire as an indicator for physical activity is weak (17). In the IPAQ 3 types of physical activity are registered; walking, moderate-intensity activities and vigorous-intensity activities, undertaken in 4 domains of leisure-time physical activity, domestic and gardening (yard) activities, work-related physical activity, and transport-related physical activity. Furthermore, the intensity of physical activity was also classified as: 3 = a high level, meaning 1 h of at least moderate intensity activity above a basal level of physical activity or half an hour of vigorous activities, e.g. 12,500 steps/day or the equivalent in moderate or intense activities; 2 = a moderate level, defined as performing some activities more often than in the lowest category or the equivalent of “half an hour of at least moderately intense physical activity on most days”; 1 = a low level of physical activity, defined as “not meeting any of the criteria for either of the previous categories” (18).
Physical fitness. Physical fitness was measured with the following tests:
• Symptom-limited ergometer cycle test. Exercise tolerance was measured with a symptom-limited ergometer test, adapted after Michalesen et al. (19) performed on a Monark Ergomedic 829 E (Monark, Varberg, Sweden) at baseline and again after 3 months. The workload began at 25 watts and increased by 25 watts every 5 min until the patient indicated 15–17 on RPE scale 6–20 (20). Heart rate was recorded every 2 min and blood pressure every 3 min. If the patient did not surpass 5 min the adjusted maximal power was calculated according to Strandell’s formula (21). This type of ergometer cycle test has been proven valid (19).
• Six-minute walk test. A standardized 6MWT test was performed to assess exercise capacity related to activities of daily living at baseline and 3 months. The validity and reliability of the test for people with CHF is good (22). Instructions were to walk on a pre-marked, 30-m corridor for 6 min, covering as much distance as possible. No encouragement or coaching was provided during the test. Distances walked, heart rate using a sport-tester Pulse watch (Polar Electro OY, Kempele, Finland), and Borg’s RPE for exertion and dyspnoea were recorded (20).
• Muscle endurance tests. One unilateral isoinertial muscle endurance test and one bilateral isometric endurance test for the shoulder abduction muscle, and one unilateral isoinertial test for the calf muscle was used at baseline and 3 months. The tests are reliable for patients with CHF (23).
• Unilateral isoinertial shoulder flexion. Patients were instructed to sit on a stool with their backs touching the wall, holding a 2 kg dumbbell for women and a 3 kg dumbbell for men in the hand of the test arm. A pace of 40 contractions per min was kept by a metronome (Taktell, Wittner, Germany). The patient was asked to elevate one arm from 0º to 90º flexion as many times as possible.
• Bilateral isometric shoulder abduction. Patients were instructed to sit on a stool with their backs touching the wall holding a 1 kg dumbbell in each hand. They were asked to elevate both arms to 90º of shoulder abduction and maintain this position as long as possible. After being reminded once, the time the patient could keep the shoulders at 90º of abduction was recorded.
• Unilateral isoinertial heel-lift. Touching the wall for balance patients were instructed to perform a maximal unilateral heel-lift with shoes as high as possible with a straight knee on a 10º tilted wedge. The pace of 60 lifts per min was kept using the same metronome as above.
Health-related quality of life. The Short Form-36 Health Survey Questionnaire (SF-36) (24) was used to measure HRQoL. This questionnaire has been used in several studies for self-reported quality of life, and has been validated and reliability-tested for patients with CHF (24).
Statistics
Statistical power was calculated using a power (β) of 80% and a significance level of (α) 5%. Improvement in steps/day were set at 10% in the intervention group and in improvement in the control group of 4%, a total of 48 patients, 24 in each group was needed. Ratio and interval data are presented as the mean ± 1 standard deviation (SD), and ordinal data are presented as median and minimum and maximum values. Nominal data are presented in absolute and relative numbers. Wilcoxon’s signed-rank test was used for within-group analyses, and the Mann-Whitney U-testwas used to test differences between groups. The χ2 test was used to analyse differences between groups for nominal data. For the analysis of comorbidities, medical treatment and pacemaker Yates corrected test was used. Pedometer data was divided into 3 categories: 0–4,396, 4,397–5,999 and ≥ 6,000 steps/day. IPAQ scores were categorized as a low, moderate or high activity level. Correlations were calculated with Spearman’s bivariate correlation coefficient concerning physical activity and physical fitness and HRQoL at baseline. The interpretation of the correlation was made according to Munro (25): 0.00–0.25 as little if any correlation, 0.26–0.49 as low correlation, 0.50–0.69 as moderate correlation, 0.70–0.89 as high correlation, and 0.90–1.00 as very high correlation. A per protocol analysis was used, and differences were considered statistically significant at p ≤ 0.05. For statistical analyses the Statistical Package for Social Sciences for windows IBM SPSS 19.0 (Chicago, IL, USA) was used.
Results
Baseline characteristics and demographic data of the patients
Forty-eight patients were randomized to the intervention (n = 25) or control group (n = 23) and 6 dropped out (n = 6). Demographic data of the study population and a flowchart for the process is shown in Table I and Fig. 1. There was a significant difference between the groups at baseline regarding the use of diuretics, p = 0.004, but no other significant differences between groups at baseline were present. The baseline and post-test results within- and between-groups are shown in Table II.
|
Table I. Demographic data for the patients at baseline |
|||
|
Intervention group (n = 25) |
Control group (n = 23) |
p-value |
|
|
Age, years, mean (SD) |
70 (6) |
71 (9) |
0.352 |
|
Male/female, n |
20/5 |
18/5 |
0.581 |
|
NYHA II/III, n |
10/14 (n = 24) |
11/12 |
0.448 |
|
LV ejection fraction, %, mean (SD) |
26 (10) |
27 (11) (n = 21) |
0.920 |
|
Heart failure, systolic, n |
25 |
22 |
0.966 |
|
Heart failure, diastolic, n |
– |
1 |
0.983 |
|
Comorbidity, n (%) |
|||
|
Hypertension |
6 (24) |
9 (39) |
0.413 |
|
Diabetes |
7 (28) |
6 (26) |
0.860 |
|
COPD |
3 (12) |
4 (17) |
0.904 |
|
Lung diseases, other |
3 (12) |
2 (9) |
0.921 |
|
Atrial fibrillation |
9 (36) |
5 (22) |
0.442 |
|
Stroke/TIA |
2 (8) |
1 (4) |
0.971 |
|
Angina pectoris |
1 (4) |
1 (4) |
0.507 |
|
Intermittent claudication |
– |
1 (4) |
0.966 |
|
Aortic valve insufficiency |
– |
2 (9) |
0.433 |
|
Mitral valve insufficiency |
– |
1 (4) |
0.966 |
|
Rheumatic diseases |
2 (8) |
2 (9) |
0.663 |
|
Orthopaedic diseases |
4 (16) |
5 (22) |
0.890 |
|
Medical treatment, n (%) |
|||
|
Beta-blockers |
22 (88) |
14 (60) |
0.066 |
|
ACE inhibitors |
23 (92) |
23 (100) |
0.507 |
|
Diuretics |
25 (100) |
15 (65) |
0.004 |
|
Anticoagulant |
23 (92) |
22 (96) |
0.940 |
|
Pacemaker, n (%) |
|||
|
CRT + ICD |
2 (8) |
2 (9) |
0.663 |
|
ICD |
1 (4) |
1 (4) |
0.507 |
|
DDD-R |
1 (4) |
3 (13) |
0.542 |
|
VVI-R |
1 (4) |
– |
0.966 |
|
ESES |
1 (4) |
1 (4) |
0.507 |
|
NYHA: New York Heart Association classification; LV ejection fraction: left ventricular ejection fraction; COPD: chronic obstructive pulmonary disease; TIA: transient ischaemic attack; SD; standard deviation; ACE inhibitors: angiotensin converting enzyme inhibitor; CRT: cardiac resynchronization therapy; ICD: implantable cardioverter defibrillator; DDD-R: dual (atrium, ventricle, dual (A+V), dual (triggered inhibited)-rate respond; VVI-R: ventricle, ventricle, inhibited-rate respond; ESES: epidural spinal electrical stimulation. |
|||
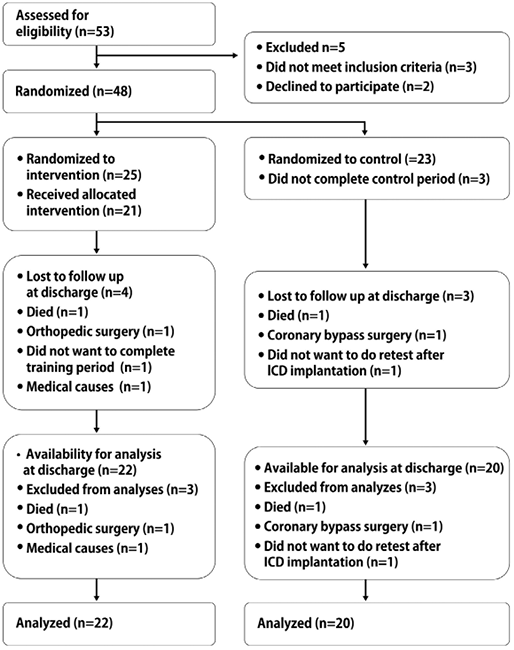
Fig. 1. The inclusion process of patients with chronic heart failure and comorbidities. ICD: implantable cardioverter defibrillator.
|
Table II. Data at baseline and after exercise training or control period in patients with chronic heart failure |
||||||||
|
Variable tested |
Baseline |
p-value between groups at baseline |
Post-test |
p-value Δ-values between groups |
||||
|
Intervention Mean (SD) |
Control Mean (SD) |
Intervention Mean (SD) |
Control Mean (SD) |
|||||
|
Pedometer, steps/day |
4596 (3602) n = 25 |
3085 (2245) n = 23 |
0.183 |
4963 (2950) n = 22 |
3063 (2226) n = 20 |
0.351 |
||
|
6MWT, m |
390 (90) n = 25 |
344 (104) n = 23 |
0.180 |
446 (80) n = 21 |
327 (103) n = 20 |
0.014 |
||
|
Ergometer test, w |
63 (26) n = 25 |
55 (18) n = 23 |
0.470 |
84 (27) n = 20 |
51 (20) n = 20 |
0.001 |
||
|
Shoulder flexion right, n |
27 (12) n = 24 |
25 (9) n = 23 |
0.624 |
38 (19) n = 19 |
26 (12) n = 20 |
0.176 |
||
|
Shoulder flexion, left, n |
25 (10) n = 24 |
23 (8) n = 23 |
0.536 |
32 (13) n = 19 |
25 (11) n = 20 |
0.180 |
||
|
Shoulder abduction, s |
70 (27) n = 23 |
59 (20) n = 23 |
0.231 |
88 (43) n = 20 |
58 (11) n = 20 |
0.028 |
||
|
Heel lift right, n |
8 (5) n = 23 |
7 (6) n = 19 |
0.162 |
18 (6) n = 20 |
6 (7) n = 16 |
< 0.0001 |
||
|
Heel lift left, n |
9 (6) n = 23 |
7 (6) n = 19 |
0.199 |
17 (6) n = 20 |
7 (7) n = 19 |
0.004 |
||
|
SF-36 PCS, points |
37 (11) n = 24 |
35 (9) n = 23 |
0.537 |
42 (10) n = 19 |
34 (10) n = 20 |
0.018 |
||
|
IPAQ, category |
1 (1–3) n = 25 |
2 (1–3) n = 23 |
0.382 |
2 (1–3) n = 22 |
1 (1–3) n = 20 |
0.008 |
||
|
IPAQ time sitting, min |
455 (213) n = 25 |
489 (193) n = 23 |
0.611 |
330 (170) n = 22 |
423 (173) n = 20 |
0.551 |
||
|
Δ-values: difference between intervention and baseline compared with difference between control and baseline; 6MWT: 6-min walk test; SF-36: Short Form-36; PCS: Physical Component Score; IPAQ: International Physical Activity Questionnaire. |
||||||||
Physical activity. There was no difference between the intervention and control groups in steps/day after 3 months; nor did steps/day differ when calculated as categories (Table III). The IPAQ category significantly improved in the intervention group compared with the control group (Table IV).
|
Table III. Steps/day categories at baseline and post-test |
|||||
|
Steps/day |
Baseline |
Post-test |
p-value Δ-values between groups |
||
|
Intervention (n = 25) n (%) |
Control (n = 23) n (%) |
Intervention (n = 22) n (%) |
Control (n = 20) n (%) |
||
|
0–4,396 |
13 (52) |
17 (73.9) |
10 (45.5) |
16 (80) |
0.179 |
|
4,397–5,999 |
4 (16) |
5 (21.7) |
7 (31.8) |
1 (5) |
|
|
≥ 6,000 |
8 (32) |
1 (4.3) |
5 (22.7) |
3 (15) |
|
|
Δ-values: difference between intervention and baseline compared with difference between control and baseline. |
|||||

|
Table IV. IPAQ categories at baseline and post-test |
|||||
|
IPAQ-categories |
Baseline |
Post-test |
p-value Δ-values between groups |
||
|
Intervention (n = 25) n (%) |
Control (n = 23) n (%) |
Intervention (n = 22) n (%) |
Control (n = 20) n (%) |
||
|
Low |
16 (64) |
10 (43.5) |
9 (40.9) |
15 (75) |
0.008 |
|
Moderate |
6 (24) |
11 (47.8) |
8 (36.4) |
3 (15) |
|
|
High |
3 (12) |
2 (8.7) |
5 (22.7) |
2 (10) |
|
|
Δ-values: difference between intervention and baseline compared with difference between control and baseline; IPAQ: International Physical Activity Questionnaire. |
|||||

Physical fitness. The exercise group significantly improved regarding exercise tolerance on the ergometer bicycle and exercise capacity in the 6MWT compared with the control group.
Muscle function. Muscle endurance significantly improved in the intervention group compared with controls in isoinertial heel lifts as well as in isometric shoulder abduction.
Quality of life. SF-36 physical component score (PCS) significantly improved in the intervention group compared with the control group, whereas no difference was seen between groups for mental component score (MCS).
Correlation analyses. At baseline significantly low correlations were present between physical activity steps/day and exercise capacity, isometric shoulder flexion, HRQoL, SF-36 PCS, and SF-36 Physical Function Score. Furthermore, moderate correlations were present between physical activity and physical fitness in 6MWT, and between physical activity and the IPAQ categories at baseline (Table V).
|
Table V. Spearman intercorrelations between physical fitness, physical activity and health-related quality of life, at baseline in patients with chronic heart failure |
|||||||||||||
|
Steps/day (n = 48) |
Watt (n = 48) |
6MWT (m) (n = 48) |
Shoulder flexion R (n) (n = 47) |
Shoulder flexion L (n) (n = 47) |
Heel lift R (n) (n = 42) |
Heel lift L (n) (n = 42) |
Shoulder abduction (s) (n = 46) |
SF-36 PCS (point) (n = 47) |
SF-36 MCS (point) (n = 47) |
SF-36 PF (point) (n = 48) |
IPAQ Sit time (min) (n = 48) |
IPAQ (category) (n = 48) |
|
|
Steps/day |
1.000 |
0.478** |
0.515** |
0.379** |
0.423** |
0.190 |
0.206 |
0.175 |
0.398** |
0.073 |
0.461** |
–0.181 |
0.535** |
|
Watt |
1.000 |
0.753** |
0.501** |
0.598** |
0.363* |
0.413** |
0.317* |
0.514** |
0.113 |
0.573** |
–0.147 |
0.244 |
|
|
6MWT (m) |
1.000 |
0.477** |
0.506** |
0.568** |
0.520** |
0.216 |
0.518** |
0.086 |
0.549** |
–0.107 |
0.354* |
||
|
Shoulder flexion R (n) |
1.000 |
0.776** |
0.342* |
0.321* |
–0.031 |
0.183 |
0.035 |
0.333* |
–0.315* |
0.219 |
|||
|
Shoulder flexion L (n) |
1.000 |
0.353* |
0.282 |
0.279 |
0.315* |
0.152 |
0.503** |
–0.260 |
0.258 |
||||
|
Heel lift R (n) |
1.000 |
0.886** |
0.098 |
0.191 |
0.098 |
0.341* |
–0.089 |
0.193 |
|||||
|
Heel lift L (n) |
1.000 |
0.095 |
0.204 |
0.026 |
0.283 |
–0.149 |
0.164 |
||||||
|
Shoulder abduction (s) |
1.000 |
0.152 |
0.225 |
0.042 |
–0.054 |
0.195 |
|||||||
|
SF-36 PCS (point) |
1.000 |
–0.082 |
0.821** |
–0.324* |
0.060 |
||||||||
|
SF-36 MCS (point) |
1.000 |
–0.030 |
0.134 |
0.050 |
|||||||||
|
SF-36 PF (point) |
1.000 |
–0.290* |
0.104 |
||||||||||
|
IPAQ sit time (min) |
1.000 |
–0.019 |
|||||||||||
|
IPAQ (category) |
1.000 |
||||||||||||
|
*Correlation is significant at the 0.05 level (2-tailed). **Correlation is significant at the 0.01 level (2-tailed). R: right; L: left; 6MWT: 6-min walk test; SF-36 Short Form-36; PCS: Physical Capacity Score; MCS: Mental Capacity Score; PF: Physical Function Score; IPAQ: International Physical Activity Questionnaire. |
|||||||||||||
Discussion
The results of this study show that participation in group exercise did not increase physical activity as measured by a pedometer, irrespective of significant changes in self-reported physical activity, where patients rated themselves at a higher activity level after the exercise period compared with controls. Furthermore, physical fitness improved in the intervention group compared with the control group.
These results are in agreement with those of previous studies. van den Berg-Emons et al. (12) demonstrated that exercise training in CHF did not lead to a more physically active lifestyle despite improvements in physical fitness. Furthermore, Cowie et al. (26) compared hospital- and home-based exercise training and found that neither training significantly increased physical activity level.
Studies have shown that people living with chronic diseases are less physically active than healthy people (6, 8), and that slow walking pace is associated with increased cardiovascular mortality together with decreased maximal oxygen uptake and walking distance (3, 9). Individuals living with CHF are limited by dyspnoea and fatigue and are often slow walkers. These limitations in physical fitness, which already exist in these individuals, can increase the risk of a more sedentary lifestyle and more time spent sitting. In the present study patients in the intervention group did decrease their sitting time and significantly increased self-reported physical activity, which may imply that they increased their physical activity in other domains that could not be measured with the pedometer. Whether reduced sitting time could benefit individuals living with chronic diseases such as CHF is still not clear. However, research shows that prolonged sitting time is associated with high mortality (6). The wide range in steps/day measured by pedometer in this study is also congruent with a literature review (9), and confirms that this patient group is not homogeneous in its limitations.
In this study, patients improved with respect to physical fitness, walking distance and muscle endurance, which are important factors for individuals living with CHF due to strong negative correlations between physical fitness and morbidity and mortality (3). These aspects are important to consider due to the fact that, despite improvement in medical care for these patients, the mortality rate is still high (3). Studies have shown that peak VO2 correlates positively with physical activity measured by pedometer in middle-aged and older individuals. The values of 6,000 steps/day were correlated with an exercise capacity threshold of 5 metabolic equivalents (METs). Here the authors discussed whether 6000 steps/day is a target number for physical activity, which contributes to increased physical fitness in patients with CHF (27). Another study suggests that a peak VO2 of > 4 METs is equivalent to a daily step count of 4,397 for men. (28). Four METs are equivalent to a peak VO2 of 14 ml/kg/min and a value of < 12.2 ml/kg/min has, according to another study, a 1-year cardiac mortality of 66% and a 1-year cardiac hospitalization rate of 63%. (3). In this study 52% of the patients in the intervention group and 73.9% in the control group had a step count/day of less than 4396 at baseline, indicating low peak VO2 and a poor prognosis. The present study showed, in congruence with others (15), that exercise training improved self-reported HRQoL for the SF-36 PCS. Morey et al. (29) reported that peak VO2 was strongly associated with SF-36 PF level, and indicated that individuals with low peak VO2 experienced difficulties in performing daily tasks.
This study focuses on individually prescribed physiotherapeutic exercise for individuals with CHF and comorbidity. These individuals are usually seen in a clinical setting, and, until now, have rarely been involved in research studies. More studies are therefore needed to establish whether an increased physical activity level can benefit patients with CHF in the same way as individually prescribed exercise.
Limitations
The pedometer is an objective measurement, which has limitations such as difficulties in measuring slow walkers, obese and overweight individuals (8, 16). Although an accelerometer would have provided a more accurate result the pedometer was used in this study in order to conform to the economic framework. We also used the IPAQ questionnaire, which has been shown to have low correlation with the pedometer (17). Although correlation is low, the combination of these two instruments provides an opportunity to study the physical activity level using both objective and subjective methods. The symptom-limited ergometer cycle test, Borg’s RPE 15–17, was used instead of a maximal ergospirometry test to assess aerobic physical fitness. This clinically based endurance test was conducted at the physiotherapy clinic as an alternative to a maximal test. Furthermore, this physiologically standardized test provides similar results in evaluating the outcome of an exercise period as a maximal exercise test.
Conclusion
A group-based exercise programme did not improve the level of physical activity in patients with CHF and comorbidity; however, physical fitness and HRQoL were significantly improved.
Acknowledgements
This research was supported by the Research and Development Council of Södra Älvsborg, region Västra Götaland, Sweden (grant number VGFOUSA-39091).
The authors would like to thank the Research and Development Council of Södra Älvsborg, Västra Götaland Region, Sweden, for providing financial support, Lena Nordeman, PhD, RPT, for valuable discussions, Marie Elmander, assistant nurse for assistance in the exercise group, and Carina Åsbogård, RN, and Helena Liderud, RN, for their help in assessing patients.
References

