Elisabeth Persson, MSc Reg OT1,2, Jan Lexell, MD, PhD1,2, Marcelo Rivano-Fischer, PhD1,2 and Mona Eklund, PhD1
From the 1Department of Health Sciences, Lund University and 2Department of Rehabilitation Medicine, Skane University Hospital, Lund, Sweden
OBJECTIVES: To assess outcomes after a pain rehabilitation programme in terms of occupational performance and satisfaction with occupational performance, and to investigate whether socio-demographic factors and pain-related factors were associated with outcomes at follow-up.
METHODS: A pre- and post-test study of 555 participants with musculoskeletal pain who completed a pain rehabilitation programme. The Canadian Occupational Performance Measure (COPM) was used as the primary outcome measure. Socio-demographic and pain-related factors were collected using background questionnaires, the Disability Rating Index (DRI) and the Multidimensional Pain Inventory (MPI). Data were analysed using multivariate logistic regression analyses.
RESULTS: Statistically significant improvements were seen on occupational performance and satisfaction with occupational performance at the 1-year follow-up. Female gender, less severe disability, less life interference and more life control predicted improvements 1 year after the programme. High initial scores on occupational performance and satisfaction with performance predicted reduced possibilities for improvements in these respects.
CONCLUSION: A pain rehabilitation programme can, for a majority of participants, affect occupational performance and satisfaction with performance. Men and those with more severe pain-related consequences may need additional or modified rehabilitation interventions in order to improve their occupational performance and satisfaction with occupational performance.
Key words: activities of daily living; disability; multidisciplinary pain clinic; musculoskeletal pain; pain management; pain measurement; rehabilitation; treatment outcome.
J Rehabil Med 2014; 46: 546–552
Correspondence address: Elisabeth Persson, Department of Health Sciences, Lund University Hospital, 221 00 Lund, Sweden. E-mail: elisabeth.persson@med.lu.se
Accepted Jan 21, 2014; Epub ahead of print May 8, 2014
INTRODUCTION
Multidisciplinary pain rehabilitation programmes often focus on improvements in pain-related consequences, rather than on pain itself (1). A common negative consequence of persistent pain is impaired occupational performance, as emphazised by researchers when evaluating pain rehabilitation (1–4). Similarly, persons with persistent pain tend to prioritize a wide range of everyday occupations as targets for improvement (1, 4–7). Occupational performance is defined as the ability to choose, organize, and satisfactorily perform meaningful occupations (8). Occupation is defined here as all types of everyday activities perceived as meaningful and important for the individual. Occupational performance highlights a person’s subjective experience of activity and participation (8). A change in focus from body function to activity and participation in rehabilitation has been proposed (1), and client-centred assessments with a focus on occupational performance contribute with important information (4, 5). Such measures have also been found to improve the goal-formulation process in multidisciplinary teams (9, 10). The present study is therefore focused on occupational performance.
Changes in occupational performance and satisfaction with occupational performance are associated with changes in psychosocial functioning and psychological well-being in a short-term perspective, which was operationalized as the period from admission to discharge from a pain rehabilitation programme (3). However, to our knowledge no study has addressed predictors for occupational performance outcomes among pain patients from a long-term perspective. When considering predictors of relevance for occupational performance, socio-demographic factors should be included since they impact on health in general (11). Age, ethnicity, educational level and vocational situation have also been found to be associated with pain-related factors among patients referred to a pain rehabilitation programme (12). Furthermore gender and marital status have been found to be important to adequately characterize pain rehabilitation populations (13). Physical disability and general activity level tend to differ between pain diagnostic subgroups (12), and studies identifying possible clusters of patients at risk of disability are required (14). Knowledge of whether different subgroups need specifically tailored treatments is also insufficient (1). It thus seems necessary to explore further whether baseline socio-demographic and pain-related factors, such as disability, psychosocial functioning, pain diagnosis and pain duration, can predict outcomes in terms of occupational performance and satisfaction with performance among pain patients.
The aim of this study was to assess outcomes after a musculoskeletal pain rehabilitation programme in terms of occupational performance and satisfaction with occupational performance, and to determine whether socio-demographic factors and pain-related factors were associated with outcomes at follow-up.
METHODS
Setting and rehabilitation programme
The study context was a group-based interdisciplinary musculoskeletal pain rehabilitation programme, based on cognitive behavioural principles. The programme was offered at a specialized pain rehabilitation unit at a Swedish university hospital. Most patients were referred from primary healthcare facilities. Inclusion in the study followed the criteria for entering the programme: completed medical examination and screening by a pain rehabilitation team, persistent (> 3 months) musculoskeletal pain with significant impact on everyday life, age 18–65 years, fluency in Swedish, and ability to participate in a group programme. Exclusion criteria were on-going substance abuse and acute psychological or psychiatric disorder.
After an initial multi-professional assessment approximately 40% of patients meeting the inclusion criteria were recommended for participation in the programme. The remaining 60% were mostly referred back to a primary care unit for less intense or single professional interventions. The team included a physician (MD), an occupational therapist (OT), a physiotherapist (PT), a psychologist (PS), and a social worker (SW). The programme duration was 5 weeks, with 2 days of follow-up 2 months after discharge.
During the first week of the programme, each participant defined his or her goals and, after further individual assessments, a rehabilitation plan was compiled. The programme covered areas aiming at improving pain management strategies, with an overall goal to increase participation in society at large. The participant and the therapist jointly formulated the rehabilitation plan, including the most important goals for the programme. The latter consisted of lectures, group discussions (all team members involved), relaxation techniques (OT, PS and PT involved), activity training and time-use strategies (OT), cognitive strategies (PS), and body awareness and fitness training (PT). The team offered education about pain and pain-related topics, as well as homework. In addition to the rehabilitation plan, all participants specified their most important everyday occupational problems, further targeted during the activity training. The group-based treatment enabled participants to share useful pain strategies with each other. Each team had weekly planning meetings where progress reports were discussed. At the final team meeting, a discharge plan was written for each participant, focusing on recommendations for further implementation of strategies to be used by each participant in their daily environment.
Ethics
The principles of the Declaration of Helsinki were followed and the study was approved by the Regional Ethics Review Board in Lund, Sweden (number H4 269/2006).
Data collection
The Canadian Occupational Performance Measure (COPM) (15) was used as the main outcome measure. The socio-demographic data as well as the pain-related factors of pain duration and pain diagnosis were collected in a background questionnaire. Pain-related factors also included disability and psychosocial functioning assessed by the Disability Rating Index (DRI) (16) and by the subscales of Multidimensional Pain Inventory (MPI) (17).
COPM. The COPM is a measure based on data from a semi-structured interview, identifying the participant’s problems with everyday occupations they want, need or are expected to do, followed by ratings of the importance of being able to perform each occupation on a scale, from 1 (= not important at all) to 10 (= extremely important) (15, 18). The occupations are then ranked according to importance and each of the up to 5 most important occupations is then rated on a performance scale from 1 (= not able to perform) to 10 (= able to perform extremely well) and a satisfaction with performance scale from 1 (= not satisfied at all) to 10 (= extremely satisfied). No participants identified fewer than 2 important occupations in the present study and a majority (79%) identified 5. Total performance and satisfaction scores were calculated by dividing the sum scores on each subscale by the number of assessed problems (18). The COPM has shown construct validity, reliability and responsiveness to change in several studies (19–21), adequate concurrent validity among patients with psychological distress (22) and validity and sensitivity to change among patients with low back pain and general persistent or chronic pain (4, 23). The COPM aids in formulating individual patient goals within a multidisciplinary pain programme (4) and facilitates client-centred treatment (19).
At discharge, participants were asked to reassess the most important occupational problems, without revealing the previous scores. The postal 1-year follow-up COPM form contained the same occupational problems. A postal follow-up procedure has been described as reliable (22, 24). To further strengthen this procedure, a pilot study was made to ensure that a postal questionnaire was reliable in the present rehabilitation context.
Socio-demographic factors. The socio-demographic factors (sex, age, ethnicity, marital status, educational level and vocational situation), assessed in the background questionnaire, were based on self-reports. The questionnaire has been designed for a national quality register, further described by Nyberg et al. (13).
Pain-related factors and disability. The participants assessed their pain duration, and the attending physicians evaluated each participant’s most relevant pain diagnoses (according to the International Classification of Diseases 10th revision; ICD-10).
The DRI is a self-administered questionnaire by which persons assess perceived ability to perform 12 physical activities using a 100-mm visual analogue scale (ranged from 0 mm = without difficulty to 100 mm = not possible). The total DRI score is calculated as the mean for the 12 items. The DRI is a robust and useful clinical and research instrument to assess physical disability. It has been shown to be reliable, with test-retest correlations of 0.83–0.95 and internal consistency of 0.84. Construct validity has also been ensured (16). Reliability of the DRI was further investigated by Cronbach’s alpha in the present sample and a coefficient of 0.89 was obtained.
The MPI is a 3-part self-rating questionnaire used to assess pain-related psychosocial and behavioural functioning (17, 25). It consists of 61 items, and the response scale ranges from 0 (never) to 6 (very often). The reliability of the MPI has been found to be satisfactory, with alpha values from 0.70 to 0.90, and stable over time, with stability coefficients from 0.62 to 0.91 (17). A Swedish version was used, further described by Nyberg et al. (26). Part 1 (28 items) covers the areas of: pain severity, life interference, life control, affective distress and social support. Part 2 (14 items) focuses on support from significant others, not addressed in this study, and part 3 (19 items) concerns participation in everyday occupations. The reliability and stability of a Swedish version has been shown to be good, except for part 3 (27), which was therefore omitted. Part 1 was thus the only section used, and from this only the first 4 subscales, concerning personal factors, were selected. The fifth subscale concerning social support was not a focus here. A higher score is positive on the subscale of life control, but negative on the other 3 subscales. The MPI has been found to be sensitive to change (28). Internal consistency based on the present sample was alpha = 0.74 for the 4 subscales used.
Statistics
Non-parametric statistics were mostly used, as all data, except for age, were ordinal or categorical. The drop-out analyses were based on the Mann-Whitney U test, the independent t-test (for age), the Kruskal-Wallis test and the χ2 test. Wilcoxon’s test was used to analyse change scores on the COPM. Effect sizes were calculated, and 0.2 was considered small, 0.5 as medium-sized and 0.8 as a large effect size (29). A change score of at least 2.0 points on COPM is considered clinically important (18). Thus, ≥ 2.0 was used as a cut-off when dichotomizing the COPM change scores from admission to the 1-year follow-up for inclusion in the logistic regression analysis.
In order to investigate how predictor variables in terms of socio-demographic factors (gender, age, ethnicity, marital status, education and vocational situation) and pain-related factors (disability, pain severity, life interference, life control, affective distress, pain duration and pain diagnostic groups) were associated with the COPM change scores (criterion variables) from admission to the 1-year follow-up, univariate and multivariate logistic regression analyses (enter method) were performed. A p-value less than 0.3 in the univariate analyses was set as the limit for inclusion of predictors in the multivariate analyses. Multivariate logistic regression models were first performed on socio-demographic factors and then on pain-related factors. Centred COPM scores (each participant’s median score on their individual performance and satisfaction scales, respectively, minus the median score for all participants) at admission were also entered to control for the influence of baseline data on the criterion variables COPM performance and satisfaction changes. The Omnibus Test of Model coefficient was used to ensure the overall goodness of fit, indicated by a p-value smaller than 0.05 (30). The Nagelkerke test and the Hosmer–Lemeshow test (30) were used to further test the logistic regression models. The former indicates the proportion of variance in the criterion variable explained by the predictors, and the latter generates a p-value that should be greater than 0.05 to support the model. Factors found to be statistically significant (p < 0.05) in these first models were then entered together in a final model to identify the most important predictors for improvements. Predictor variables used in the logistic regression analyses were tested for multicollinearity (by use of Spearman’s correlation test).
PASW for Windows version 18.0 was used for all statistical analyses and a p-value lower than 0.05 was considered statistically significant.
RESULTS
Participants
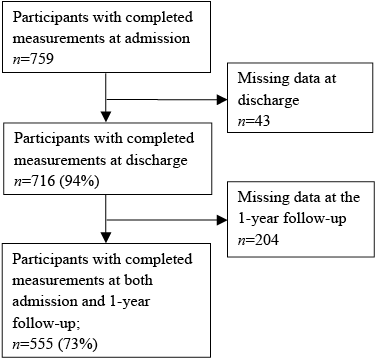
Patients accepted for the pain programme from 2003 to 2008 were included in the present study. A total of 759 patients were eligible (Fig. 1). At discharge and at the 1-year follow-up there were drop-outs due to missing items on returned forms, despite a reminder. A total of 555 of those who had participated in the initial occupational performance interview responded at the 1-year follow-up and were included in the study.
Fig. 1. Number of participants from recruitment to 1-year follow-up.
The socio-demographic characteristics and pain diagnoses of the 555 participants are shown in Table I. A majority were women (79%) and the mean age was 40 years. The most frequent pain diagnoses were neck disorders (28%), fibromyalgia (24%) and low-back pain (23%). Less frequently occurring diagnoses were grouped together and referred to as other diagnoses (9%); the most common being headache or shoulder pain. Median pain duration was 217 weeks (interquartile range (IQR) 120–343 weeks), minimum 10 weeks and maximum 2042 weeks.
Drop-out analyses revealed no significant differences between the subsamples for which occupational performance data were available (n = 555) and for those with data not shown (n =204) at the 1-year follow-up. Baseline data for socio-demographic and pain-related factors and COPM scores were used for these analyses (data not shown).
|
Table I. Socio-demographic factors and pain diagnoses for the participants |
|
|
Description of factors |
Participants n = 555 |
|
Gender, female, n (%) |
439 (79) |
|
Age year, mean (SD) min–max |
40 (9.5) 19–61 |
|
Ethnicity, Nordic born, n (%) |
478 (86) |
|
Marital status, married/cohabiting, n (%) |
404 (73) |
|
Education, n (%) Secondary school Upper secondary school University |
108 (20) 333 (60) 114 (20) |
|
Vocational situation, n (%) Not working |
354 (64) |
|
Diagnoses, n (%) Fibromyalgia Myalgia Neck disorder Low-back pain Othera |
131 (24) 83 (15) 157 (28) 130 (23) 50 (9) |
|
aDiagnoses represented by < 10 participants each. |
|
Occupational performance and satisfaction with performance
Median and distribution of scores on the COPM are shown in Table II. There were statistically significant improvements from admission to discharge, from discharge to the 1-year follow-up, and from admission to the 1-year follow-up, on the COPM performance subscale and on the COPM satisfaction subscale, except for the interval between discharge and the 1-year follow-up where there was no change in COPM satisfaction. A total of 39% improved clinically between admission and the 1-year follow-up in occupational performance and 47% in satisfaction with occupational performance (Table III). Large effect sizes (≥ 0.8) were found for changes between admission and the 1-year follow-up on the performance as well as the satisfaction subscale.
|
Table II. Scores and change scores, on the Canadian Occupational Performance Measure (COPM) |
|||||||
|
Scores Median (IQR) [min to max] |
Change scores Median p-values [min to max] |
||||||
|
Admission |
Discharge |
1-year follow-up |
Admission-discharge |
Discharge-1-year follow-up |
Admission-1-year follow-up |
||
|
COPM Performance |
3.4 (2.6–4.2) [1.0 to 7.5] n = 555 |
4.6 (3.4–5.6) [1.0 to 8.6] n = 522 |
5.0 (3.6–6.2) [1.0 to 10.0] n = 555 |
1.2 < 0.001 [–4.2 to 6.0] n = 520 |
0.4 < 0.001 [–5.2 to 5.4] n = 522 |
1.6 < 0.001 [–4.2 to 6.6] n = 555 |
|
|
COPM Satisfaction |
2.4 (1.6–3.4) [1.0 to 10.0] n = 555 |
4.4 (3.0–5.6) [1.0 to 10.0] n = 522 |
4.4 (3.0–6.2) [1.0 to 10.0] n = 545 |
2.0 < 0.001 [–4.6 to 8.2] n = 522 |
0 ns [–8.0 to 7.3] n = 514 |
2.0 < 0.001 [–9.0 to 8.4] n = 545 |
|
|
IQR: interquartile range. |
|||||||
|
Table III. Participants distributed on different change scores (≥ 2, < 2–>–2 and ≤ –2) on the Canadian Occupational Performance Measure (COPM) |
|||||||
|
COPM Performance |
COPM Satisfaction |
||||||
|
≥ 2 n (%) |
< 2–>–2 n (%) |
<–2 n (%) |
≥ 2 n (%) |
< 2–>–2 n (%) |
<–2 n (%) |
||
|
Admission to discharge (n = 522) |
145 (28) |
366 (70) |
9 (2) |
229 (44) |
283 (54) |
10 (2) |
|
|
Discharge to 1-year (n = 522) |
90 (17) |
395 (76) |
37 (7) |
96 (18) |
344 (66) |
74 (14) |
|
|
Admission to 1-year (n = 555)a |
215 (39) |
324 (58) |
16 (3) |
258 (47) |
268 (49) |
19 (3) |
|
|
aTen missing for satisfaction with performance. |
|||||||
Factors predicting improvements in The Canadian Occupational Performance Measure at 1-year follow-up
Goodness of fit test (Omnibus test) revealed a p-value less than 0.05 and Hosmer–Lemeshow’s test revealed a p-value greater than 0.05 for all the multivariate analyses.
Socio-demographic factors as predictors. According to the univariate analyses clinically important improvements in COPM performance (≥ 2.0 change score) were associated with gender (p = 0.138), age (p = 0.093), ethnicity (p = 0.050) and vocational situation (p = 0.044). Clinically important improvements in COPM satisfaction were associated with gender (p = 0.011), ethnicity (p = 0.007), marital status (p = 0.252) and vocational situation (p = 0.001).
Multivariate regression analysis showed that, for each year of increasing age, the odds of belonging to the clinically improved group on COPM performance at the 1-year follow-up decreased by 3%, as indicated by an odds ratio (OR) of 0.97 (Nagelkerke 0.042). Regarding COPM satisfaction, female gender, being Nordic born, and working prior to admission, predicted increased odds, by 62%, 91% and 80%, respectively, of belonging to the improved group (Nagelkerke 0.059) (Table IV).
|
Table IV. Multivariate logistic regression analyses testing socio-demographic factors as predictors of improvements (change of ≥ 2) on the criterion variables of Canadian Occupational Performance Measure (COPM) |
|||||||
|
Predictorsa |
Performance improvements |
Satisfaction improvements |
|||||
|
p-value |
OR |
CI |
p-value |
OR |
CI |
||
|
Gender, female/male |
0.206 |
1.3 |
0.85–2.06 |
0.030* |
1.62 |
1.05–2.51 |
|
|
Age |
0.006* |
0.97 |
0.96–0.99 |
– |
|||
|
Ethnicity, Nordic born/non Nordic born |
0.077 |
1.6 |
0.95–2.76 |
0.015* |
1.91 |
1.14–3.22 |
|
|
Vocational situation, at work/not at work |
0.100 |
1.35 |
0.94–1.94 |
0.001* |
1.80 |
1.26–2.57 |
|
|
Marital status, married/single |
– |
0.320 |
1.22 |
0.83–1.79 |
|||
|
*p < 0.05. aThe binary predictors are described with the first subgroup indicating the odds (OR) for improvements; variables with a p-value of 0.3 or more in the univariate analyses were not included (–). OR: odds ratio; CI: confidential interval. |
|||||||
Pain-related factors as predictors while controlling for baseline scores. With respect to pain-related factors, in the univariate analyses clinically important improvements in COPM performance were associated with disability (p < 0.001), pain severity (p = 0.021), life interference (p = 0.004), life control (p = 0.006), pain diagnostic groups (p = 0.188) and baseline COPM performance (p < 0.001). Associations with clinically important improvements in COPM satisfaction concerned disability (p < 0.001), pain severity (p < 0.001), life interference (p < 0.001), life control (p = 0.004), affective distress (p = 0.029), pain duration (p = 0.051) and baseline COPM satisfaction (p < 0.001).
Multivariate regression analysis showed that more severe disability (OR = 0.98) and a higher baseline COPM performance score (OR = 0.49) significantly decreased the odds of belonging to the clinically improved group on COPM performance, by 2% and 51% for each scale step, respectively (Table V). More life control increased the odds by 35% for each scale step (OR = 1.35) of belonging to the clinically improved group on COPM performance. The Nagelkerke value for this model was 0.215.
|
Table V. Multivariate logistic regression analyses testing pain-related factors and baseline Canadian Occupational Performance Measure (COPM) as predictors of improvements (change of ≥ 2) on the criterion variables of COPM |
|||||||
|
Predictorsa |
Performance improvements |
Satisfaction improvements |
|||||
|
p-value |
OR |
CI |
p-value |
OR |
CI |
||
|
Disability |
0.001* |
0.98 |
0.96–0.99 |
0.022* |
0.99 |
0.97–< 1.0 |
|
|
Pain severity |
0.922 |
0.99 |
0.73–1.33 |
0.348 |
0.87 |
0.64–1.17 |
|
|
Life interference |
0.306 |
0.86 |
0.64–1.15 |
0.008* |
0.65 |
0.48–0.90 |
|
|
Life control |
0.003* |
1.35 |
1.11–1.64 |
0.024* |
1.77 |
1.03–1.57 |
|
|
Affective distress |
– |
0.430 |
1.08 |
0.89–1.31 |
|||
|
Pain duration |
– |
0.076 |
1.00 |
1.00–1.00 |
|||
|
Pain diagnosis |
0.365 |
– |
|||||
|
Baseline COPM |
< 0.001* |
0.49 |
0.40–0.59 |
< 0.001* |
0.60 |
0.51–0.70 |
|
|
*p < 0.05. aThe predictor variable pain diagnostic group was categorized as described in Table I; variables with a p-value of 0.3 or more in the univariate analyses were not included (–). OR: odds ratio; CI: confidential interval. |
|||||||
More severe disability (OR = 0.99) and more life interference (OR = 0.65) significantly reduced the odds of belonging to the clinically improved COPM satisfaction group by 1% and 35% for each scale step, respectively. More life control predicted increased odds for improved COPM satisfaction with performance by 77% for each scale step, as indicated by an odds ratio of 1.77. Higher baseline COPM satisfaction significantly (OR = 0.60) decreased the odds by 40% for improved COPM satisfaction. For further details, see Table V. The Nagelkerke value for this model was 0.197.
Socio-demographic and pain-related factors as predictors while controlling for baseline scores. In the final multivariate model, each scale step towards more disability significantly decreased the odds of belonging to the clinically improved group on COPM performance by 3%, as indicated by an odds ratio of 0.97 (Table VI). Each scale step towards more life control significantly increased the odds of belonging to the clinically improved group on COPM performance by 41% (OR = 1.41). Each scale step towards a higher score on COPM performance at baseline, indicating better functioning initially, decreased the odds by 50% of belonging to the clinically improved group on COPM performance at follow-up (OR = 0.50). The Nagelkerke value for the model was 0.208.
Being a woman (OR = 1.86) increased the odds by 86%, of belonging to the clinically improved group on COPM satisfaction (see Table VI). Disability (OR=0.99) and life interference (OR = 0.65) decreased the odds of belonging to the clinically improved group on COPM satisfaction by 1% and 35%, respectively, for each scale step towards a worse situation. Life control (OR = 1.22) increased the odds by 22% for each scale step of belonging to the clinically improved group on COPM satisfaction. Baseline COPM satisfaction (OR = 0.60) reduced the odds by 40% for each scale step of belonging to the clinically improved group on COPM satisfaction. The Nagelkerke value for this model was 0.216.
|
Table VI. Multivariate logistic regression analyses testing socio-demographic and pain-related factors as predictors of improvements (change of ≥ 2) on the criterion variables of Canadian Occupational Performance Measure (COPM) |
|||||||
|
Predictorsa |
Performance improvements |
Satisfaction improvements |
|||||
|
p-value |
OR |
CI |
p-value |
OR |
CI |
||
|
Gender, female/male |
– |
0.014* |
1.86 |
1.13–3.04 |
|||
|
Age |
0.060 |
0.98 |
0.96–1.00 |
– |
|||
|
Ethnicity |
– |
0.129 |
1.56 |
0.88–2.79 |
|||
|
Vocational situation |
– |
0.070 |
1.45 |
0.97–2.18 |
|||
|
Disability |
0.001* |
0.97 |
0.96–0.99 |
0.021* |
0.99 |
0.97–< 1.0 |
|
|
Life interference |
– |
0.003* |
0.65 |
0.49–0.86 |
|||
|
Life control |
< 0.001* |
1.41 |
1.17–1.70 |
0.039* |
1.22 |
1.01–1.47 |
|
|
Baseline COPM |
< 0.001* |
0.50 |
0.41–061 |
< 0.001* |
0.60 |
0.51–0.70 |
|
|
*p < 0.05. aThe binary predictors are described with the first subgroup indicating the odds (OR) for improvements; Variables with a p-value of 0.3 or more in the univariate analyses were not included (–). OR: odds ratio; CI: confidential interval. |
|||||||
DISCUSSION
Statistically significant improvements in occupational performance and satisfaction with occupational performance were observed at the 1-year follow-up; 39% were clinically improved on occupational performance and 47% on satisfaction with performance. Participants also continued to improve on occupational performance, but not on satisfaction with occupational performance, between completion of the programme and the 1-year follow-up. Results of improved occupational performance and satisfaction from admission to follow-up after completing a pain rehabilitation programme have also been reported previously (3–5, 23, 31). Two of these studies (4, 5) showed similar results of improvements from discharge to a follow-up, at 3 and 9 months, respectively. These results highlight the importance of following up results after discharge and may indicate that it takes time to integrate newly achieved occupational performance strategies into regular everyday life. This was further underlined by the fact that the proportion of participants who were clinically importantly improved was larger at the follow-up than at discharge. The overall goal of the rehabilitation programme in the present study was to teach participants active coping skills that they could incorporate in their everyday life. It is likely that different interventions within the programme, as well as the participants’ own learning process, contributed to the overall results, but demonstrating the causality of the improvements was outside the scope of the study. It was also not possible to identify any specific therapeutic factors of relevance for the improvements, and aspects other than the rehabilitation programme per se may have been critical for the participants’ improvements.
In the final multivariate logistic regression model, factors that significantly predicted either improved performance or satisfaction with performance 1 year after completed pain rehabilitation programme were gender, disability, life interference, life control and baseline COPM scores. The fact that better baseline scores predicted a reduced probability for improvement may partly be explained by regression towards the mean, but may also indicate that the patients with a worse situation regarding occupational performance benefitted more from the programme. Clinically important improvements in COPM satisfaction were also predicted by baseline life interference scores. Pain-related predictors together with baseline scores on the COPM explained 21% and 22% of the variance, respectively, according to the Nagelkerke test, whereas socio-demographic factors explained only 4% and 6%, respectively. This indicates that, in order to evaluate predictors of improvements after pain rehabilitation, it is wise to use models that include baseline scores and pain-related factors. The probability of clinically relevant improvements decreased as participants reported more disability and life interference, and less life control. As far as we know, such relationships between change scores on the COPM and pain-related factors have not been investigated previously. Avoidance of activity due to pain has been recognized as a contributor to chronic pain for several decades (32). A higher level of avoidance of activity is found to be associated with a higher level of physical disability (33). The present relationship between higher levels of disability and decreased probability of improvement on occupational performance may lead to the assumption that improved occupational performance is associated with decreased avoidance behaviour. This hypothesis should be investigated in future research.
The present results also indicate that more life control predicted a higher probability for clinically improved occupational performance and satisfaction. This is in line with previous results on the association between perceived control and different aspects of human occupation and health. Perceived control may be of importance for how everyday occupations are regarded (34) and has been found to be vital for subjective health (35), and is related to the ability to mobilize resources to meet the demands of everyday life (36).
The fact that women improved more than men with regard to satisfaction with occupational performance is in agreement with previous research. Women have been found to benefit more than men, in terms of improved workability, after an outpatient multidisciplinary pain programme (37) similar to the present one. It thus seems warranted to develop a specific focus to support men with regard to satisfaction with occupational performance. Men and women tend to prioritize different occupational problems (6, 38). In the present pain programme the possibility of addressing each individual’s specific occupational problems was limited due to the group-based design. Furthermore, the fact that most participants were women may have reduced the opportunities offered to men. Therapists need to encourage both men and women to individually practice occupational skills and develop those strategies that are most useful for them. Socio-demographic factors other than gender were of minor relevance for improvements, which is in line with previous studies (39).
Methods and limitations
The present study was designed to explore current clinical practice. No control or comparison group was used as the focus was on predictors of improvements and not on outcomes of the programme.
The COPM renders a patient perspective on outcomes, which is considered to be important when evaluating long-term effectiveness of pain management programmes (5). The present results showed clinically important improvements (change score of ≥ 2) for more than one-third of the participants, with respect to occupational performance, and for almost half of the participants, with respect to satisfaction with performance. Only 3% deteriorated (change score of ≤ –2) on performance and satisfaction with performance. Whether the ratio of improvement is satisfying or not is a matter of judgment. The cut-off limit for clinically important improvements may also be questioned and the important cut-off limit for different populations needs to be investigated (5).
Whether the present results can be generalized needs to be considered. This study was based in a clinical setting and therefore participants were mainstream patients in that context and mostly referred from primary care units. The patients who were admitted had, however, passed a selection process. The present sample and results may therefore primarily be representative of and generalized to other similar specialized pain rehabilitation programmes.
Conclusion
The participants improved their occupational performance and satisfaction with occupational performance during the pain rehabilitation programme and further improvements were discerned at follow-up. Gender-specific needs should be a focus in pain rehabilitation in order to improve satisfaction with occupational performance. Patients with more severe pain-related consequences may need additional interventions or interventions with a modified focus in order to improve their occupational performance and satisfaction with occupational performance.
Acknowledgemens
This study received financial support from The Swedish Association of Survivors of Traffic Accidents and Polio (RTP, Skane county council’s research and development foundation, and the Vårdakademi at Skane University Hospital.
REFERENCES

