Lucas Araújo Castro e Souza, PT, MSc, Júlia Caetano Martins, PT, MSc, Luci Fuscaldi Teixeira-Salmela, PT, PhD, Eliza Maria Lara, PT, Juliana Braga Moura, PT, Larissa Tavares Aguiar, PT and Christina Danielli Coelho de Morais Faria, PT, PhD
From the Department of Physical Therapy, Universidade Federal de Minas Gerais, Belo Horizonte, Minas Gerais, Brazil
OBJECTIVES: To investigate the criterion-related validity, test-retest and inter-rater reliabilities of the modified sphygmomanometer test (MST) for assessment of the strength of the trunk and lower limb muscles in subjects with chronic stroke, and to verify whether the number of trials affected the results.
Patients and methods: Fifty-nine subjects with stroke (mean age 57.80 years; standard deviation 13.79 years) were included in the study. Maximum isometric strength was assessed with a hand-held dynamometer and the MST. To investigate whether the number of trials affected the results, one-way analysis of variance was applied. For the criterion-related validity, test-retest and inter-rater reliabilities of the MST, Pearson correlation coefficients, coefficients of determination, and intra-class correlation coefficient (ICC) were calculated.
RESULTS: Different numbers of trials provided similar values for all assessed muscles (0.003 ≤ F ≤ 0.08; 0.92 ≤ p ≤ 1.00) with adequate validity (0.79 ≤ r ≤ 0.90; p ≤ 0.001), test-retest (0.57 ≤ ICC ≤ 0.98; p ≤ 0.001), and inter-rater reliabilities (0.53 ≤ ICC ≤ 0.97; p ≤ 0.001), except for the inter-rater reliability of the non-paretic ankle plantar flexors. The values obtained with the MST were good predictors of those obtained with the hand-held dynamometer (0.57 ≤ r2 ≤ 0.79).
CONCLUSION: In general, the MST showed adequate criterion-related validity, test-retest and inter-rater reliabilities for the assessment of strength of the lower limb and trunk muscles in subjects with chronic stroke. For the majority of the assessed muscles, only one trial, after familiarization, provided adequate strength values.
Key words: stroke; muscular strength; evaluation; reliability; validity.
J Rehabil Med 2014; 46: 00–00
Correspondence address: Christina Danielli Coelho de Morais Faria, Department of Physical Therapy, Universidade Federal de Minas Gerais, Avenida Antônio Carlos, 6627, Campus Pampulha, 31270-901 Belo Horizonte, Minas Gerais, Brazil. E-mail: cdcmf@ufmg.br
Accepted Feb 25, 2014; Epub ahead of print May 21, 2014
INTRODUCTION
Muscular weakness is the most common motor impairment in subjects with stroke (1). There is a non-linear relationship between strength and functional performance (1, 2), but there is clear evidence that strengthening the muscles promotes functional recovery post-stroke (3).
It is well documented that weakness of the trunk and lower limb (LL) muscles is related to decreased performance in some functional activities, such as gait and sit-to-stand tasks (4, 5). Measurement of strength is therefore essential to guide clinical decision-making regarding rehabilitation interventions for stroke subjects (6) and is usually employed within clinical and research settings (1, 4, 5, 7).
Common methods for the clinical assessment of strength are the manual muscular test (MMT) and the hand-held dynamometer (HHD), both of which have some disadvantages (1). The MMT provides subjective data, has poor sensitivity (8), and has limitations in the identification of important differences in strength, mainly when strength is rated as good or normal (9, 10). The HDD is somewhat expensive and difficult for most professionals in non-developed and developing countries to acquire, due to local importation laws. In these countries stroke incidence and prevalence are increasing and stroke has become a major public health concern (11).
An alternative method for clinical assessment of strength is the modified sphygmomanometer test (MST). The MST provides objective measures and involves the use of an aneroid sphygmomanometer, a low-cost, portable device widely used by health professionals (12). Adequate criterion-related validity (0.75 ≤ r ≤ 0.98) and intra- and inter-rater reliabilities (0.65 ≤ intra-class correlation coefficient (ICC) ≤ 0.97) of the MST have been reported for various muscular groups and populations (13). However, no studies have been published regarding the use of the MST for assessment of the strength of trunk and LL muscles in subjects with stroke (13). Both validity and reliability are fundamental for the usefulness of a measurement within both clinical and research contexts. Furthermore, these properties are not inherent to an instrument and should be investigated within the context of its intended use, such as the muscular group and population characteristics (6). Therefore, before the MST can be used for strength measurements of the trunk and LL muscles in subjects with stroke, these measurement properties should be investigated.
Another important issue related to the usefulness of a measurement tool is the number of trials necessary to obtain valid and reliable results (6, 14). After stroke, many factors may influence the quality of strength measurements, such as impaired regulation of force levels, motor unit firing patterns, spasticity, and length-associated changes in muscle fibres and connective tissues (15). In addition, multiple trials may cause fatigue and influence strength (16). However, no studies were found regarding the most adequate number of trials when employing the MST for the assessment of trunk and LL strength in subjects with chronic stroke.
The aims of this study were to investigate the criterion-related validity and the test-retest and inter-rater reliabilities of the MST for assessment of strength of the trunk and LL muscles in subjects with chronic stroke, and to verify whether the number of trials (first trial and the means of 2 and 3 trials) would affect MST measures and their measurement properties.
METHODS
Participants
Subjects with stroke were recruited from the general community by screening out-patient clinics in university hospitals in the city of Belo Horizonte, Brazil. The inclusion criteria were: length of time since onset of stroke at least 6 months; ≥ 20 years of age; and ability to assume the positions for the strength assessments, with or without assistance. Exclusion criteria were: cognitive impairment, as determined by cut-off scores (in points) on the Mini-Mental Status Examination (according to their educational-specific reference values (17): illiterate 13 points; elementary and middle school 18 points; and high-school 26 points) or other health conditions that could lead to changes in strength and pain, or unstable cardiovascular conditions (18).
The sample size was determined based on the data reported by Bohannon & Lusardi (19), who found a correlation coefficient of 0.96 between MST and HHD measures and a reliability coefficient of 0.96, with a power of 99%. Based on these data (19) and the recommended tables (6) for power and sample size calculations for correlation analyses, a sample size of 18 subjects would be required, for a power of 80%, a correlation coefficient of 0.60 and a significance level of 5%. Based on the assumption related to correlation statistical analysis regarding sample heterogeneity and in an attempt to obtain sample variability regarding strength, subjects were recruited into various age groups (20–39 years, 40–59 years, and above 60 years), different genders with various degrees of motor impairment (20, 21), and a range of comfortable walking speeds (14). A total of 54 subjects were included in the study; 18 subjects in each age group, with a range of characteristics regarding gender, motor impairments, and walking speeds.
Before data collection, eligible participants were informed about the objectives of the study and provided consent, based on previous approval from the university ethics review board. Demographic and clinical data, including measures of motor recovery of the LL, assessed by the Fugl-Meyer Scale scores (20); tonus of the knee extensor and ankle plantar flexor muscles, assessed by the Modified Ashworth Scale (22); comfortable walking speeds, assessed by the 10-m walk test (14); and trunk impairment, assessed by the trunk impairment scale (21), were collected by trained physical therapists (PTs) for characterization purposes. The paretic side was determined by the motor recovery of the LL and decreased strength, compared with the opposite side.
The strength of the following muscle groups was assessed: trunk lateral flexors and rotators; hip flexors, extensors, and abductors; knee flexors and extensors; and ankle dorsiflexors and plantar flexors. However, since some subjects were not able to activate some muscles, the sample size varied for each analysed group.
Muscle strength measurements
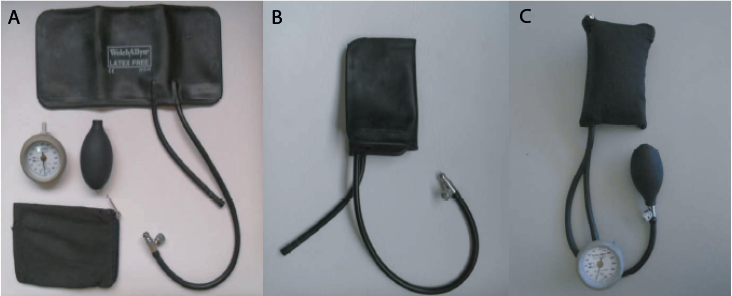
Strength, in kilogramforce (kgf), was measured with a HHD (MicroFET 2, Hoggan Health Industries, Draper, UT, USA), which is considered the gold-standard for the assessment of isometric strength (23). Strength, in mmHg, was also measured with an aneroid sphygmomanometer (Tycos® model DS44, NY, USA) adapted using the bag method (12). For the bag method adaptation, the outer Velcro®, which constitutes the sleeve of the device, was removed (Fig. 1A) and the inflatable bladder part was folded into 3 equal sections and placed into a sewn cotton bag (Fig. 1B), as previously recommended (12). The dimensions of the cotton bag with the bladder inflated to 20 mmHg were as follows: 14 cm long, 10.7 cm wide, and 2.5 cm thick (Fig. 1C).
The stability of the measures obtained with the modified sphygmomanometer was tested prior to the assessments with known weights (5–40 kg) (24). The correlations between the known weights and the values obtained in mmHg was very high (r ≥ 0.99; p ≤ 0.001), and the coefficients of variation ranged from 4% to 8%.
Procedures
All strength assessments were carried out by 2 trained PTs (examiners 1 and 2). A third examiner read and recorded all the HHD and MST values.
Initially, examiner 1 performed the randomization order of the devices by simple randomization procedures (sealed envelopes). The measures were independently obtained by the 2 examiners over 2 sessions: session 1 (first day) to investigate the criterion-related validity of the MST (examiner 1) and session 2 on the second day, to investigate the test-retest and inter-rater reliabilities of the MST (examiners 1 and 2). The sessions were performed at the same time of day, 1–4 weeks apart, under similar test conditions (administration, environment, instructions, and protocols). Furthermore, prior to data collection in session 2, the subjects provided information regarding any adverse health issues that could influence their strength levels. All subjects evaluated in session 2 had no adverse health issues and, therefore, were stable in the interim period between sessions 1 and 2, as previously recommended (6, 25).
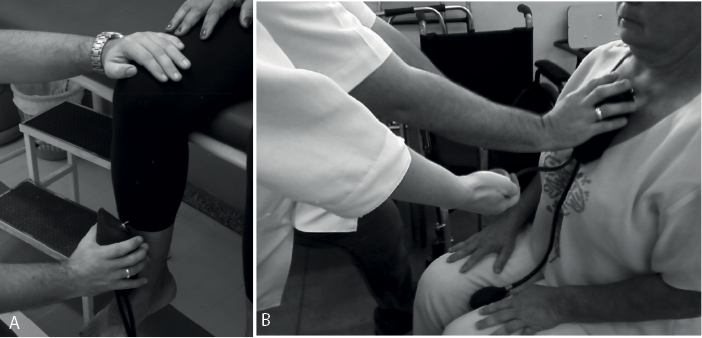
The subject and segment positions and the place of resistance applications followed previously published protocols (26, 27), as follows: with the subject in supine position, hip flexors/extensors (hip and knee flexed to 90°, resistance just proximal to the knee on the anterior/posterior surface), hip abductors (knee extended, hip in neutral, resistance just proximal to the knee on the lateral surface), and ankle dorsiflexors/plantarflexors (hip and knee extended, resistance just proximal to the metatarsophalangeal joints on the dorsal/plantar surface) were assessed. In the sitting position, knee flexors/extensors (Fig. 2A) (hip and knee flexed to 90°, resistance just proximal to the ankle on posterior/anterior surface of leg) and anterior trunk flexors (Fig. 2B) (feet supported, resistance just inferior to the sternal notch), trunk extensors (feet supported, resistance over the spinal process of the T1 vertebrae), lateral flexors (feet and back supported, resistance just inferior to acromion over the lateral surface of the arm), and rotators (same position used for lateral flexors, resistance over the coracoid process of the scapula on the contralateral side), were assessed. Manual stabilization was used only for the assessment of the ankle and knee muscles, and followed previously recommended descriptions (26, 27). For the knee muscles, manual stabilization was provided distal and anterior on the thigh (Fig. 2A) and for the ankle muscles, distal and anterior on the leg.
Before the assessments, the subjects were asked to perform a submaximal isometric contraction for familiarization purposes (28). First, the non-paretic side was assessed to facilitate the subjects’ comprehension (29), followed by the paretic side. The HHD and the modified sphygmomanometer, which was pre-inflated to 20 mmHg, were then placed in a position to resist the movements generated by the measured muscular group. During trial efforts, the subjects were verbally encouraged to exert their maximal isometric contractions over 5 s. The examiners applied manual resistance against the movements, maintaining the body segment static. After familiarization, 6 trials of maximal isometric contractions were performed, 3 with the HHD and 3 with the sphygmomanometer. The peak values were recorded. Rest intervals of 15 s between trials were allowed (13). The pre-insufflation of the modified sphygmomanometer was constantly verified.
Statistical analyses
Descriptive statistics and tests for normality were carried out for all outcomes. One-way analysis of variance (ANOVA) was used to compare the MST values using different number of trials (first trial and the means of 2 and 3 trials) for all muscular groups, considering the values obtained by examiner 1 during session 1.
Pearson correlation coefficients were calculated to investigate the criterion-related validity between the MST and HHD measures, considering the different numbers of trials. Linear regression analyses were employed to identify the best model, which could explain the relationships between the measures obtained with both types of equipment and to provide the estimated regression equations that could predict the strength values, in kgf, from those obtained with the MST, in mmHg. All analyses considered the values obtained by examiner 1 during session 1.
ICCs with 95% confidence intervals (CI) were employed to assess the test-retest and inter-rater reliabilities of the MST measures, considering the different numbers of trials. When Pearson correlation coefficients and ICC values reached significance, the strength of the correlations was classified, as follows (30): Very low = 0–0.25; low = 0.26–0.49; moderate = 0.50–0.69; high = 0.70–0.89; and very high = 0.90–1.00. Systematic differences between the 2 sessions (test-retest reliability) or between the 2 examiners (inter-rater reliability) were verified by paired t-tests, followed by the 95% CI of the mean differences. All analyses were performed with SPSS for Windows, version 17.0 (SPSS Inc., Chicago, IL, USA) (α = 5%).
RESULTS
A total of 59 subjects with chronic stroke were assessed for the validity of the MST (Table I). Test-retest reliability was assessed with 40 subjects with a mean age of 56.93 years (standard deviation (SD) 13.33), a mean time since onset of stroke of 104.62 months (SD 74.72), and a mean comfortable walking speed of 0.89 m/s (SD 0.30). Inter-rater reliability was investigated with 29 subjects, who had mean age of 58.31 years (SD 15.70), a mean time since onset of stroke of 101.36 months (SD 69.43), and a mean comfortable walking speed of 0.82 m/s (SD 0.31).
|
Table I. Subject’s demographic and clinical characteristics (n = 59) |
|
|
Variables |
Result |
|
Age, years, mean (SD) [min–max] |
57.80 (13.79) [30–86] |
|
Time since the onset of stroke, months, mean (SD) [min–max] |
90.97 (71.34) [7–370] |
|
Body mass index (kg/m2) mean (SD) |
27.07 (4.94) |
|
Gender, n (%) |
|
|
Men |
29 (49.2) |
|
Women |
30 (50.8) |
|
Paretic side, n (%) |
|
|
Right |
30 (50.8) |
|
Left |
29 (49.2) |
|
Type of stroke, n (%) |
|
|
Ischaemic |
42 (71.2) |
|
Haemorrhagic |
8 (13.6) |
|
Ischaemic and haemorrhagic |
4 (6.8) |
|
Comfortable gait speed, 10-m walk test, m/s, mean (SD)a |
0.85 (0.32) |
|
Household ambulators, n (%) |
5 (8.6) |
|
Limited community ambulators, n (%) |
18 (31) |
|
Community ambulators, n (%) |
35 (8.6) |
|
Lower limb motor impairment (Fugl-Meyer Scale), score (0–34 points)b, n (%) |
28 (8) |
|
Mild impairment |
26 (44.1) |
|
Moderate impairment |
19 (32.2) |
|
Moderately severe impairment |
8 (13.6) |
|
Severe impairment |
6 (10.2) |
|
Trunk performance, TIS, (0–23 points) median (IQR) |
16 (6) |
|
aClassification validated by Bowden et al. (2008) 31; bClassification proposed by Dutil et al. (1989) 32. SD: standard deviation; TIS: Trunk Impairment Scale; IQR: interquartile range. |
|
As shown in Table II, the values provided by different numbers of trials were similar (0.003 ≤ F ≤ 0.08; 0.92 ≤ p ≤ 1.00). Therefore, validity and reliability results were also investigated considering the different numbers of trials.
|
Table II. Descriptive statistics and analysis of variance (ANOVA) results regarding the comparisons between the different number of trials for the strength of both lower limbs and trunk assessed with the Modified Sphygmomanometer Test (mmHg) by the examiner 1 during session 1 |
||||
|
Muscle groups (n) |
First trial Mean (SD) |
Means of 2 trials Mean (SD) |
Means of 3 trials Mean (SD) |
ANOVA F; p-values |
|
Non-paretic lower limb |
||||
|
Hip flexors (57) |
107.04 (35.53) |
105.94 (35.37) |
104.39 (34.30) |
0.08; 0.92 |
|
Hip extensors (54) |
160.69 (47.47) |
159.96 (44.98) |
161.51 (47.40) |
0.06; 0.94 |
|
Hip abductors (55) |
153.93 (48.47) |
153.31 (47.57) |
152.53 (46.98) |
0.01; 0.99 |
|
Knee flexors (54) |
145.64 (50.16) |
144.67 (50.89) |
146.43 (55.78) |
0.04; 0.97 |
|
Knee extensors (53) |
197.62 (55.69) |
198.21 (56.06) |
196.73 (55.07) |
0.01; 0.99 |
|
Ankle dorsiflexors (55) |
133.64 (42.44) |
132.80 (42.43) |
132.38 (42.14) |
0.01; 0.99 |
|
Ankle plantar flexors (54) |
194.04 (57.35) |
190.89 (56.37) |
188.48 (56.51) |
0.06; 0.95 |
|
Paretic lower limb |
||||
|
Hip flexors (51) |
92.04 (30.34) |
90.94 (29.76) |
90.41 (29.84) |
0.04; 0.96 |
|
Hip extensors (47) |
158.51 (47.41) |
160.21 (46.19) |
162.26 (46.76) |
0.08; 0.93 |
|
Hip abductors (52) |
131.04 (43.06) |
132.27 (42.38) |
131.46 (41.08) |
0.01; 0.99 |
|
Knee flexors (48) |
106.21 (47.00) |
105.92 (47.07) |
106.25 (48.17) |
0.01; 1.00 |
|
Knee extensors (50) |
161.64 (53.63) |
163.32 (53.20) |
164.36 (52.47) |
0.03; 0.97 |
|
Ankle dorsiflexors (45) |
100.62 (45.03) |
99.56 (43.70) |
99.33 (43.35) |
0.01; 0.99 |
|
Ankle plantar flexors (47) |
147.57 (61.47) |
147.85 (63.08) |
147.57 (61.47) |
0.01; 1.00 |
|
Trunk |
||||
|
Trunk flexors (55) |
148.22 (46.17) |
146.16 (46.49) |
146.01 (46.73) |
0.04; 0.96 |
|
Trunk extensors (53) |
180.69 (57.58) |
176.53 (53.66) |
176.40 (53.70) |
0.01; 1.00 |
|
Right lateral trunk flexors (54) |
138.74 (38.38) |
138.19 (37.02) |
138.22 (36.86) |
0.04; 1.00 |
|
Left lateral trunk flexors (55) |
133.38 (40.42) |
132.80 (38.81) |
133.96 (38.53) |
0.012; 0.99 |
|
Right trunk rotators (53) |
128.30 (43.25) |
127.83 (42.56) |
128.50 (42.68) |
0.003; 1.00 |
|
Left trunk rotators (51) |
132.86 (38.46) |
132.59 (38.13) |
133.36 (38.28) |
0.005; 1.00 |
|
MST: Modified Sphygmomanometer Test; SD: standard deviation; ANOVA: analysis of variance. |
||||
Validity
Significant, positive, and high to very high correlations were found between the HHD and the MST measures for the different numbers of trials for all assessed muscles (0.75 ≤ r ≤ 0.90; p ≤ 0.001).
The regression analyses revealed that the values of the first MST trials were good predictors of those of the first HHD trials for the trunk (0.64 ≤ r2 ≤ 0.79; p ≤ 0.001) and non-paretic (0.57 ≤ r2 ≤ 0.75; p ≤ 0.001), and paretic LL muscles (0.63 ≤ r2 ≤ 0.79; p ≤ 0.001) (Table III). The coefficients of determination demonstrated that more than 55% of the values obtained with the HHD, in kgf, were explained by those obtained with the MST, in mmHg, for all muscular groups. The equations provided in Table III could be used to predict the strength values, in kgf, from those obtained with the MST, in mmHg.
|
Table III. Descriptive statistics, Pearson correlation coefficients, and regression analysis results for the first trial of strength of both lower limbs and trunk (data from examiner 1 during session 1) |
|||||
|
Muscle groups (n) |
Hand-held dynamometer Mean (SD) |
MST Mean (SD) |
Correlation (r) |
Regression (r2) |
Regression equations |
|
Non-paretic lower limb |
|||||
|
Hip flexors (57) |
8.26 (3.89) |
107.04 (35.53) |
0.75* |
0.57 |
y = –0.548 + 0.082x |
|
Hip extensors (55) |
15.03 (5.79) |
160.69 (47.47) |
0.82* |
0.68* |
y = –1.125 + 0.101x |
|
Hip abductors (55) |
12.33 (5.07) |
153.93 (48.47) |
0.86* |
0.75* |
y = –1.586 + 0.090x |
|
Knee flexors (55) |
9.39 (4.07) |
145.64 (50.16) |
0.87* |
0.75* |
y = –1.477 + 0.076x |
|
Knee extensors (53) |
16.93 (7.81) |
197.62 (55.69) |
0.81* |
0.66* |
y = –5.572 + 0.114x |
|
Ankle dorsiflexors (55) |
9.79 (3.79) |
133.64 (42.44) |
0.79* |
0.62* |
y = 0.430 + 0.070x |
|
Ankle plantar flexors (55) |
14.94 (5.08) |
194.04 (57.35) |
0.77* |
0.59* |
y = 0.982 + 0.073x |
|
Paretic lower limb |
|||||
|
Hip flexors (51) |
7.14 (3.48) |
92.04 (30.34) |
0.80* |
0.64* |
y = –1.293 + 0.092x |
|
Hip extensors (47) |
14.77 (5.59) |
158.51 (47.41) |
0.79* |
0.63* |
y = –0.023 + 0.093x |
|
Hip abductors (52) |
10.34 (4.23) |
131.04 (43.06) |
0.89* |
0.79* |
y = –1.104 + 0.087x |
|
Knee flexors (48) |
6.41 (3.21) |
106.21 (47.00) |
0.85* |
0.73* |
y = 0.209 + 0.058x |
|
Knee extensors (50) |
12.78 (6.30) |
161.64 (53.63) |
0.85* |
0.72* |
y = –3.282 + 0.099x |
|
Ankle dorsiflexors (45) |
6.39 (3.74) |
100.62 (45.03) |
0.86* |
0.74* |
y = –0.802 + 0.071x |
|
Ankle plantar flexors (47) |
11.00 (5.44) |
147.57 (61.47) |
0.84* |
0.71* |
y = 0.152 + 0.073x |
|
Trunk |
|||||
|
Trunk flexors (55) |
11.70 (4.54) |
148.22 (46.17) |
0.89* |
0.79* |
y = –1.227 + 0.087x |
|
Trunk extensors (55) |
14.38 (5.37) |
180.69 (57.58) |
0.87* |
0.76* |
y = –0.792 + 0.086x |
|
Right lateral trunk flexors (54) |
9.88 (3.58) |
138.74 (38.38) |
0.86* |
0.75* |
y = –1.300 + 0.081x |
|
Left lateral trunk flexors (55) |
10.42 (3.98) |
133.38 (40.42) |
0.86* |
0.74* |
y = –0.867 + 0.085x |
|
Right trunk rotators (53) |
8.79 (3.39) |
128.30 (43.25) |
0.80* |
0.64* |
y = 0.649 + 0.064x |
|
Left trunk rotators (51) |
8.68 (3.45) |
132.86 (38.46) |
0.85* |
0.72* |
y = –1.355 + 0.074x |
|
*p ≤ 0.001. SD: standard deviation; MST: Modified Sphygmomanometer Test; y: dependent or criterion variable (hand-held dynamometer); x: independent or predictor variable (MST). |
|||||
Reliability
Regarding test-retest reliability, the different number of trials showed high to very high ICC values (0.77 ≤ ICC ≤ 0.98; p ≤ 0.001) for the trunk and both LL muscles, except for the first trial of the trunk flexors (ICC = 0.61; p ≤ 0.001), which showed moderate ICC values (Table IV). The 95% CI of the ICC ranged from moderate (lower bounds) to very high (upper bounds) for the majority of the assessed muscles using different number of trials. Furthermore, the systematic differences between the 2 sessions were not significant (0.055 ≤ p ≤ 0.989) for the different numbers of trials for all assessed muscles (Table IV).
|
Table IV. Intra-class correlation coefficients (ICC) for the test-retest reliability for the assessed muscular groups of both lower limbs and trunk with the Modified Sphygmomanometer Test, considering the different number of trials (data from examiner 1 during both sessions 1 and 2) |
|||||||||
|
Test-retest reliability |
First trial |
Means of 2 trials |
Means of 3 trials |
||||||
|
ICC (n) |
95% CI of the ICC |
95% CI of the mean differences |
ICC (n) |
95% CI of the ICC |
95% CI of the mean differences |
ICC (n) |
95% CI of the ICC |
95% CI of the mean differences |
|
|
Muscle groups of the non-paretic lower limb |
|||||||||
|
Hip flexors |
0.89 (35) |
0.74–0.93 |
–11.81–0.49 |
0.96 (35) |
0.91–0.98 |
–9.46–0.89 |
0.96 (35) |
0.93–0.98 |
–8.54–0.85 |
|
Hip extensors |
0.91 (32) |
0.83–0.96 |
–2.87–13.62 |
0.96 (31) |
0.92–0.98 |
–2.03–12.23 |
0.97 (31) |
0.93–0.98 |
–1.60–12.35 |
|
Hip abductors |
0.85 (33) |
0.72–0.92 |
–4.95–13.31 |
0.95 (33) |
0.89–0.97 |
–3.46–11.52 |
0.95 (33) |
0.89–0.97 |
–5.03–10.29 |
|
Knee flexors |
0.81 (32) |
0.64–0.90 |
–11.39–12.52 |
0.91 (32) |
0.82–0.96 |
–8.29–13.66 |
0.93 (32) |
0.86–0.97 |
–6.33–12.99 |
|
Knee extensors |
0.83 (32) |
0.69–0.92 |
–11.19–9.69 |
0.93 (32) |
0.86–0.97 |
–11.23–7.55 |
0.93 (32) |
0.86–0.97 |
–11.22–7.14 |
|
Ankle dorsiflexors |
0.83 (32) |
0.67–0.91 |
–9.39–8.52 |
0.91 (32) |
0.82–0.96 |
–10.74–6.92 |
0.92 (32) |
0.84–0.96 |
–10.46–6.08 |
|
Ankle plantar flexors |
0.84 (34) |
0.70–0.92 |
–9.80–13.22 |
0.89 (33) |
0.77–0.94 |
–10.69–14.15 |
0.89 (33) |
0.78–0.95 |
–13.34–10.92 |
|
Muscle groups of the paretic lower limb |
|||||||||
|
Hip flexors |
0.86 (30) |
0.71–0.93 |
–13.51–0.36 |
0.93 (30) |
0.83–0.97 |
–13.01–0.92 |
0.93 (30) |
0.85–0.97 |
–11.78–0.26 |
|
Hip extensors |
0.90 (27) |
0.79–0.95 |
–9.43–9.29 |
0.96 (27) |
0.91–0.98 |
–12.08–4.01 |
0.97 (27) |
0.93–0.99 |
–10.51–3.99 |
|
Hip abductors |
0.86 (31) |
0.73–0.93 |
–12.64–3.47 |
0.93 (31) |
0.85–0.97 |
–10.23–5.33 |
0.94 (31) |
0.87–0.97 |
–8.41–6.18 |
|
Knee flexors |
0.88 (27) |
0.76–0.94 |
–13.42–6.16 |
0.96 (27) |
0.92–0.98 |
–8.93–6.11 |
0.96 (27) |
0.92–0.98 |
–10.31–4.84 |
|
Knee extensors |
0.87 (30) |
0.75–0.94 |
–13.01–6.61 |
0.93 (29) |
0.84–0.97 |
–8.78–9.95 |
0.92 (29) |
0.83–0.96 |
–8.86–10.56 |
|
Ankle dorsiflexors |
0.86 (24) |
0.70–0.94 |
–12.08–7.25 |
0.97 (24) |
0.93–0.99 |
–8.74–3.33 |
0.98 (24) |
0.94–0.99 |
–9.49–1.11 |
|
Ankle plantar flexors |
0.83 (26) |
0.65–0.92 |
–9.59–19.82 |
0.91 (26) |
0.79–0.96 |
–8.98–19.48 |
0.90 (26) |
0.79–0.96 |
–10.52–17.58 |
|
Trunk muscle groups |
|||||||||
|
Flexors |
0.61 (35) |
0.56–0.78 |
–5.14–22.84 |
0.76 (35) |
0.52–0.88 |
–6.52–21.43 |
0.96 (35) |
0.92–0.98 |
–4.79–7.72 |
|
Extensors |
0.87 (36) |
0.76–0.93 |
–9.48–10.36 |
0.91(33) |
0.82–0.96 |
–10.12–12.18 |
0.90 (33) |
0.80–0.95 |
–9.48–12.47 |
|
Right lateral flexors |
0.86 (36) |
0.74–0.92 |
–4.94–8.72 |
0.92 (36) |
0.84–0.96 |
–8.07–8.46 |
0.93 (35) |
0.85–0.96 |
–5.37–7.99 |
|
Left lateral flexors |
0.90 (36) |
0.66–0.90 |
–12.56–3.11 |
0.93 (36) |
0.87–0.97 |
–10.56–0.95 |
0.94 (35) |
0.88–0.97 |
–8.81–3.01 |
|
Right rotators |
0.84 (35) |
0.70–0.92 |
–8.27–8.39 |
0.92 (35) |
0.83–0.96 |
–7.51–8.48 |
0.91 (34) |
0.82–0.96 |
–7.33–9.17 |
|
Left rotators |
0.88 (35) |
0.61–0.88 |
–14.81–3.38 |
0.91 (35) |
0.82–0.95 |
–16.54–0.38 |
0.91 (35) |
0.83–0.96 |
–13.81–1.62 |
|
CI: confidence interval. |
|||||||||


For the inter-rater reliability, the different number of trials showed moderate to very high ICC values for all trunk (0.65 ≤ ICC ≤ 0.93; p ≤ 0.001) and LL (0.53 ≤ ICC ≤ 0.91; p ≤ 0.001) muscles and no systematic differences between the examiners were observed for the different numbers of trials for all assessed muscles (0.088 ≤ p ≤ 1.00), except for the non-paretic ankle plantar flexors, for which the reliability was not adequate with significant systematic differences between the examiners (0.001 < p ≤ 0.003). Finally, the 95% CIs of the ICC for the inter-rater reliability were wider and, specifically, for the non-paretic hip and knee extensor muscles and ankle dorsiflexors of both LL, they ranged from low/very low to high/very high for all the different number of trials (Table V).
|
Table V. Intra-class correlation coefficients (ICC) for the inter-rater reliability for the assessed muscle groups of both lower limbs and trunk with the Modified Sphygmomanometer Test, considering the different number of trials (data from examiner 1 and 2 in a single session) |
|||||||||
|
Inter-rater reliability |
First trial |
Means of 2 trials |
Means of 3 trials |
||||||
|
ICC (n) |
95% CI of the ICC |
95% CI of the mean differences |
ICC (n) |
95% CI of the ICC |
95% CI of the mean differences |
ICC (n) |
95% CI of the ICC |
95% CI of the mean differences |
|
|
Muscle groups of the non-paretic lower limb |
|||||||||
|
Hip flexors |
0.83 (27) |
0.67–0.92 |
–12.04–5.38 |
0.93 (27) |
0.85–0.97 |
–9.39–5.25 |
0.93 (27) |
0.85–0.97 |
–9.29–4.80 |
|
Hip extensors |
0.57 (23) |
0.21–0.79 |
–11.58–22.36 |
0.75 (23) |
0.41–0.89 |
–7.21–23.64 |
0.72 (23) |
0.37–0.88 |
–6.18–26.18 |
|
Hip abductors |
0.65 (26) |
0.35–0.82 |
–9.13–20.05 |
0.86 (26) |
0.69–0.94 |
–4.16–19.00 |
0.86 (26) |
0.69–0.94 |
–0.89–21.19 |
|
Knee flexors |
0.87 (25) |
0.73–0.94 |
–12.69–11.42 |
0.93 (24) |
0.84–0.97 |
–11.34–11.84 |
0.94 (24) |
0.87–0.98 |
–10.97–9.47 |
|
Knee extensors |
0.67 (26) |
0.31–0.85 |
–6.14–19.86 |
0.78 (25) |
0.43–0.91 |
–5.05–20.79 |
0.77 (25) |
0.40–0.90 |
–5.28–20.08 |
|
Ankle dorsiflexors |
0.53 (26) |
0.19–0.76 |
–8.60–20.45 |
0.66 (26) |
0.25–0.85 |
–7.77–22.54 |
0.63 (26) |
0.17–0.83 |
–7.98–22.90 |
|
Ankle plantar flexors |
0.34 (26) |
–0.02–0.63 |
10.18–45.21 |
0.56 (26) |
0–0.81 |
13.65–46.42 |
0.60 (26) |
–0.04–0.84 |
17.77– 47.67 |
|
Muscle groups of the paretic lower limb |
|||||||||
|
Hip flexors |
0.81 (25) |
0.62–0.91 |
–14.27–2.27 |
0.92 (25) |
0.82–0.96 |
–13.22–1.22 |
0.93 (25) |
0.84–0.97 |
–12.40–1.15 |
|
Hip extensors |
0.89 (22) |
0.76–0.95 |
–7.62 –12.17 |
0.95 (22) |
0.89–0.98 |
–5.25–12.88 |
0.96 (22) |
0.90–0.98 |
–2.14–14.27 |
|
Hip abductors |
0.66 (27) |
0.38–0.83 |
–15.29–11.74 |
0.83 (27) |
0.62–0.92 |
–11.55–13.18 |
0.83 (27) |
0.63–0.92 |
–8.96–15.23 |
|
Knee flexors |
0.91 (22) |
0.80–0.92 |
–15.33–4.60 |
0.97 (22) |
0.93–0.99 |
–14.14–1.59 |
0.97 (22) |
0.93–0.99 |
–13.49–2.17 |
|
Knee extensors |
0.76 (25) |
0.53–0.88 |
–5.39–19.47 |
0.88 (25) |
0.73–0.95 |
–3.62–17.54 |
0.87 (25) |
0.70–0.94 |
–0.65–20.06 |
|
Ankle dorsiflexors |
0.55 (22) |
0.20–0.78 |
–29.32–4.59 |
0.75 (22) |
0.41–0.90 |
–27.67–3.94 |
0.74 (22) |
0.39–0.89 |
–26.60–5.33 |
|
Ankle plantar flexors |
0.74 (21) |
0.45–0.88 |
–2.54–33.49 |
0.81 (21) |
0.55–0.92 |
–4.01–34.06 |
0.80 (21) |
0.52–0.92 |
–3.33–34.91 |
|
Trunk muscle groups |
|||||||||
|
Flexors |
0.76 (27) |
0.55–0.88 |
–3.93–15.19 |
0.89 (27) |
0.76–0.95 |
–6.78–10.11 |
0.91 (27) |
0.79–0.96 |
–6.89–9.47 |
|
Extensors |
0.93 (26) |
0.84–0.97 |
–7.54–7.39 |
0.95 (25) |
0.89–0.98 |
–9.03–6.39 |
0.95 (25) |
0.89–0.98 |
–10.13–5.65 |
|
Right lateral flexors |
0.77 (27) |
0.55–0.89 |
–2.73–15.47 |
0.84 (27) |
0.65–0.93 |
–3.11–16.22 |
0.85 (27) |
0.68–0.93 |
–3.39–14.99 |
|
Left lateral flexors |
0.70 (27) |
0.44–0.85 |
–11.65–11.8 |
0.86 (27) |
0.69–0.94 |
–11.12–9.27 |
0.88 (27) |
0.73–0.95 |
–8.25–9.77 |
|
Right rotators |
0.76 (26) |
0.53–0.88 |
–6.45–15.99 |
0.91 (26) |
0.81–0.96 |
–4.16–13.62 |
0.91 (26) |
0.80–0.96 |
–1.59–16.06 |
|
Left rotators |
0.65 (26) |
0.35–0.82 |
–8.70–16.86 |
0.83 (26) |
0.61–0.92 |
–9.12–15.12 |
0.84 (26) |
0.65–0.93 |
–8.34–15.11 |
|
CI: confidence interval. |
|||||||||


DISCUSSION
In this study, the MST demonstrated adequate validity and reliability for all assessed muscular groups of the trunk and both LL in subjects with chronic stroke for all investigated number of trials, except for the inter-rater reliability of the non-paretic ankle plantar flexors.
Variations regarding the number of trials for strength assessment have been reported (13, 33) for stroke subjects (33) and for the use of the MST in different populations, i.e. elderly people, and subjects with rheumatoid arthritis (13). However, for stroke subjects and even for the MST, no clear recommendations regarding the number of trials have been reported (13, 33). As pointed out by Portney & Watkins (6), “in addition to test-retest and rater-reliability studies, most researchers recognize the need for taking more than 1 measurement of a behaviour or characteristic whenever possible. But then, one may ask, out of these several trials, which value best represents the individual’s true scores? (..) Which score should be used? There is no easy answer to this question. (..)”.
Similar results were found for different number of trials (first trial, the means of 2 and 3, and the best and worst values) of 7 performance-based tests with subjects with stroke, with adequate reliability levels (14). Bohannon & Saunders (16) compared the HHD values of the elbow flexors with healthy individuals obtained with the first trial, the maximal and the mean values of 3 trials. They did not find any differences regarding the number of trials or the test-retest reliability levels, which were very high (0.98 ≤ ICC ≤ 0.99). In the present study, the first MST trial and the means of 2 and 3 trials showed similar results for all assessed muscles.
Validity
Only one other study has investigated the criterion-related validity of the MST for the assessment of strength of the muscular groups evaluated in the present study using a standard method (13). Helewa et al. (34) compared the MST and HHD measures for abdominal strength in healthy individuals and subjects with low back pain and reported very high correlations (r = 0.98). Their results can be compared with those of the present study for the trunk flexors (r = 0.89), as well as for the other assessed muscles (0.79 ≤ r ≤ 0.90), and the number of trials did not affect the results regarding the criterion-related validity.
Helewa et al. (34) did not investigate how the associations between the MST and HHD measures occurred (6). In the present study, regression analyses were able to explain how these associations occurred and provided information for the estimation of the variations in the values of the HHD from those of the MST measures, both considering the first trial after familiarization, and thus, values, in kgf, could be predicted from those, in mmHg. The coefficients of determination ranged between 0.57 and 0.79, which meant that at least 57% of the variations in the HHD values could be explained by variations in the MST measures. It is clinically important that the HHD values can be predicted, since previous studies have reported reference strength values for measures obtained with this device (35), and others have reported that the strength of specific muscles could predict independence in a given functional activity (5).
Reliability
In general, all reliability coefficient values found in the present study were acceptable, except for the inter-rater reliability of the non-paretic ankle plantar flexors.
Of the previous studies that investigated the test-retest reliability of the MST, only one study related this to LL strength (13), more specifically to hip flexors, extensors and abductors of healthy individuals. Very high reliability coefficients (0.94 ≤ ICC ≤ 0.97) were reported, similar to the present results (0.93 ≤ ICC ≤ 0.97). Furthermore, the present study investigated the test-retest reliability of the MST for 14 LL muscular groups and also found high to very high reliability coefficients. Given that no test-retest reliability studies were found regarding the MST for all the other LL muscles (13), which were assessed in the present study, these results were also compared with studies that investigated this measurement property for the HHD (36). Riddle et al. (34) investigated the test-retest reliability of the HHD for the assessment of the strength of some lower limb muscles in subjects with various neurological impairments, and reported moderate to very high reliability, with ICC values ranging from 0.56 to 0.98. Similar to their findings with a gold standard measure, the results of the present study showed that the MST also demonstrated very high reliability levels for the assessment of the muscles of both the non-paretic (0.89 ≤ ICC ≤ 0.97) and paretic (0.92 ≤ ICC ≤ 0.98) LL.
No studies were found regarding the test-retest reliability of the MST (13) or HHD for the assessment of the trunk muscles in subjects with stroke (33). Larson et al. (37) investigated this measurement property of the HHD for the assessment of trunk flexors, extensors and lateral flexors in individuals with spinal cord injuries and reported high to very high reliability levels (0.79 ≤ ICC ≤ 0.99), similar to the present results (0.90 ≤ ICC ≤ 0.96), which also investigated the trunk rotator muscles and the results were also classified as very high (ICC = 0.91).
Finally, it is important to point out that no differences between the 2 test occasions were found for all evaluated muscles, which illustrates that there were no systematic differences between the MST values obtained by examiner 1 in both sessions. Furthermore, the number of trials did not affect the MST results regarding test-retest reliability.
The inter-rater reliability of the MST for the LL muscles was only previously investigated for the hip extensors in elderly subjects, and the knee extensors in individuals with rheumatoid arthritis (13), with reports of moderate to very high reliability levels (0.65 ≤ ICC ≤ 0.96) (13). The present results showed high to very high reliability levels for the assessment of these muscular groups (0.72 ≤ ICC ≤ 0.96). Other LL muscular groups, which were not previously investigated, were evaluated in the present study and the results showed high to very high reliability levels (0.86 ≤ ICC ≤ 0.97), with the exception of the non-paretic ankle dorsiflexors, which demonstrated moderate reliability (0.60 ≤ ICC ≤ 0.63), and the non-paretic ankle plantar flexors, which demonstrated low to moderate reliability (0.34 ≤ ICC ≤ 0.60) and showed systematic differences between the examiners. In general, these findings were similar to those of Kelln et al. (2008) (38), who investigated the inter-rater reliability of the HHD for the assessment of LL muscles in healthy individuals and reported moderate to high reliability levels (0.65 ≤ ICC ≤ 0.87).
In general, the 95% CI of the ICC of the inter-rater reliability showed wide variation between the different number of trials and the inter-rater reliability for the non-paretic ankle plantar flexors was not adequate (95% CIs of the ICC were wide, included zero, and the systematic differences between the examiners were observed for the different number of trials). The short lever arm of the foot combined with the magnitude of the force exerted by this muscular group, which requires that the examiner apply more strength to counteract that of the individual (39), associated with small variations in foot positioning that may also have occurred, could be possible explanations for these results. The difference in strength between the examiners is another possible explanation (6, 40, 41). It is important to point out that inter-rater reliability should be considered only when 2 different examiners are performing the same measurement, which rarely occurs in the clinical context (6).
No studies were found regarding the inter-rater reliability of the MST for the assessment of trunk strength (13). Bohannon (26) investigated the inter-rater reliability of the HHD for the assessment of strength of trunk flexors and lateral flexors in individuals with acute stroke and reported high reliability levels (0.80 ≤ ICC ≤ 0.82), which were somewhat lower than those of the present study (0.84 ≤ ICC ≤ 0.95). It is worth noting that, in the Bohannon study (26), an assistant provided stabilization of the participants during the assessments, while in the present study the assessments were perfomed in the seated position, which was sufficient to maintain the segment stabilized, and required only one examiner. These procedures are more compatible with those performed in clinical settings.
Study limitations
A limitation of this study was that subjects with severe disabilities were less commonly evaluated. Furthermore, the re-tests were performed 1–4 weeks apart. This interval has been considered reasonable and was already applied in a previous study with subjects with stroke in the chronic phase (42), but a shorter interval could have improved the results regarding test-retest reliability. In addition, in the attempt to ensure internal validity, an assistant examiner read and recorded the strength measures. However, within clinical settings, assessments are often conducted by a single examiner, who has to perform the tests, read and record the values.
Modified sphygmomanometer test and clinical practice
The MST could be incorporated within clinical settings for various reasons: (i) the aneroid sphygmomanometer is easily found worldwide, even in non-developed countries and is commonly acquired by health professionals, mainly by the ones who work with stroke subjects, since high blood pressure is a risk factor for the onset and/or recurrence of the stroke (43); (ii) the adaptation was simple and required only a cotton bag, which had an average cost of US$15; (iii) it is not required that the sphygmomanometer be used exclusively for strength assessment, since the adaptation is not permanent; and (iv) only one trial, after familiarization, can be used to assess the strength of the LL and trunk muscles, when only one examiner perform the measures, which is more commonly observed. The same factors can be considered when 2 examiners are performing the assessment for the majority of the muscles investigated in the present study.
Conclusion
The MST demonstrated adequate criterion-related validity, as well as test-retest and inter-rater reliabilities. Only one MST trial, after familiarization, was required to produce valid and reliable results, except when the ankle plantar flexor muscles of the non-paretic side were assessed by 2 independent examiners. The MST is a promising method to be used within clinical settings worldwide for the assessment of strength of the trunk and LL muscles in subjects with chronic stroke.
ACKNOWLEDGEMENTS
Financial support provided by Coordenação de Aperfeiçoamento de Pessoal de Nível Superior (CAPES), Fundação de Amparo à Pesquisa do Estado de Minas Gerais (FAPEMIG), Conselho Nacional de Desenvolvimento Científico e Tecnológico (CNPq) and Pró-reitoria de Pesquisa da Universidade Federal de Minas Gerais (PRPq/UFMG). The authors are also grateful to Dr John Henry Salmela for copyediting the manuscript. None of the authors have a relationship with any entities that have a financial interest in this topic.
REFERENCES

