Joan A. C. Verhoef, MSc1,2, Inge Bramsen, PhD2, Harald S. Miedema, MD, MSc2, Henk J. Stam, MD, PhD1, Marij E. Roebroeck, PhD1,3 and the Transition and Lifespan Research Group South West Netherlands
From the 1Department of Rehabilitation Medicine, Erasmus University Medical Center, 2Research Centre Innovations in Care, Rotterdam University of Applied Sciences and 3Rijndam Rehabilitation Center, Rotterdam, The Netherlands
OBJECTIVE: To document the development of work participation in young adults with cerebral palsy who are transitioning into adulthood, examine associated characteristics, and investigate work limitations and barriers among employed persons.
DESIGN: Observational longitudinal cohort study.
SUBJECTS: Seventy-four young adults with cerebral palsy of average intelligence, aged 16–20 years at baseline.
METHODS: Work participation in 3 categories (employed, unemployed, studying) was assessed at baseline, 2-year and 4-year follow-ups using structured interviews. At 4-year follow-up, associations of work participation with demographic and clinical characteristics were examined using multinomial logistic regression. Work limitations and barriers among employed persons were evaluated using questionnaires.
RESULTS: From age range 16–20 years to age range 20–24 years the proportions of subjects who were employed and unemployed increased from 12% to 49% and 3% to 17%, respectively; the proportion who were students decreased from 85% to 34%. In the age range 20–24 years, the employment rate of young adults with cerebral palsy was lower and the unemployment rate higher, than that of the general population. A lower level of gross motor function and younger age were associated with unemployment. Employed persons experienced few work limitations; 28% experienced situational or health barriers.
CONCLUSION: Young adults with cerebral palsy and average intelligence are at risk of experiencing unfavourable developments in work participation. Rehabilitation services should offer support to prevent unemployment and occupational disability.
Key words: cerebral palsy; employment; longitudinal study; young adult; rehabilitation; transition to adult care.
J Rehabil Med 2014; 46: 00–00
Correspondence address: Joan A. C. Verhoef, Erasmus University Medical Center, Department of Rehabilitation Medicine, Rotterdam University of Applied Sciences, Research Centre Innovations in Care, PO Box 2040, NL-3000 CA Rotterdam, The Netherlands. E-mail: J.A.C.Verhoef@hr.nl
Accepted March 4, 2014; Epub ahead of print May 26, 2014
INTRODUCTION
Cerebral palsy (CP) is the leading cause of physical disability in childhood, affecting movement and posture and leading to activity limitations and participation restrictions. CP is a chronic condition, and dramatic increases in life expectancy have increased awareness about the need to support persons with CP throughout their life course. During the process of transition to adulthood young people have to develop a range of new skills needed for assuming adult roles and for becoming independent, autonomous adults who manage their own lives (1–6). The transition process involves different domains of participation, e.g. independent living, social/community life, education and employment. For young adults, work participation is important for providing financial independence, but also for social interaction and a sense of self-esteem. Studies among young adults with CP found that (part-time) paid work is among the 3 most frequently identified problems, and that they consider problems in work to be very important (5, 7, 8).
Many adults with CP experience participation restrictions in different areas of life, including employment (1, 2, 9–11). Estimated employment rates for adults with CP vary widely. These variations might be due to the different age groups studied, differences in clinical characteristics, the inclusion of part-time or sheltered employment in some studies, and the influence of different social systems between countries. For the USA and Sweden reported employment rates for adults with CP (age range 17–74 years) are approximately 50% (2, 11–13); for Canada employment rates of 50% and 36% are reported for adults aged 20–33 years (14, 15). For European countries (including Denmark, Italy and England), Australia and Israel reported employment rates for adults with CP (age range 16–65 years) are between 34% and 38% (1, 16–19); for Taiwan an employment rate of 23% is reported for adults with CP aged 18–54 years (20). In the Netherlands, rates of paid employment of 54% are reported for a broad sample of adults with CP aged 25–36 years (n = 54, 48% male), including persons with intellectual disabilities (3), and of 68% for adults aged 25–45 years (n = 56, 62% male) with bilateral spastic CP of average intelligence (9). In both studies, the majority had a high level of gross motor function (62% and 73% scored Gross Motor Functioning Classification System (GMFCS) levels I–II) and completed some form of secondary education (54% and 73%).
In general, favourable factors for employment among young people with various (physical or mental) disabilities are male gender, older age, higher educational level, higher level of intelligence, higher psychosocial level of functioning, low depression scores, ambulation or transportation independence, self-care independence and having a disability for a long time; while intellectual disability (intelligence quotient (IQ) ≤ 80), more severe physical disability, epilepsy and dependent or denial coping strategies are unfavourable factors for employment (14, 21–24). For persons with CP, lower levels of gross motor function, bilateral CP, intellectual disability, epilepsy, lower levels of general self-efficacy, dependence in daily activities, and assisted living are unfavourable factors for employment and social participation (8, 9, 16, 19, 20).
Previous studies have not systematically examined the development of work participation in young adults with CP during their transition to adulthood prospectively over some years, or examined the work limitations and barriers to employment that they experience.
Therefore, we prospectively followed a sample of Dutch young adults with CP of average intelligence, who were in the age range 16–20 years, for a period of 4 years up to the age range 20–24 years. The primary aim of this study was to document the longitudinal development of work participation in young adults with CP during their transition to adulthood over a 4-year period. A further aim was to examine the associations of demographic and clinical characteristics with work participation in young adults with CP who were in the age range 20–24 years. Finally, we aimed to determine experienced work limitations and situational or health barriers to employment among employed persons.
METHODS
Participants
This observational study was conducted as part of the CP transition study in the South-West Netherlands, in which a cohort of young adults in the age range 16–20 years was followed over a period of 4 years in order to study their process of transition to adulthood in several areas of life (4).
Participants were recruited from 8 rehabilitation centres and rehabilitation departments in the south-western region of the Netherlands. Participants did not receive rehabilitation interventions to improve their transition to adulthood.
Inclusion criteria were: (i) a diagnosis of CP; (ii) aged 16–20 years at baseline; and (iii) average intelligence (corresponding with an estimated IQ ≥ 70). Persons with an additional diagnosis with persisting effects on motor functioning and persons with inadequate proficiency with the Dutch language were excluded.
Measurements were performed at baseline in 2002 (n = 103), at 2-year follow-up (n = 87) and at 4-year follow-up (n = 78). The current study focuses on work participation and presents the results of 74 participants for whom data on education and employment were available at all 3 assessments. No significant non-response or loss-to-follow-up biases were observed with respect to age, gender, gross motor functioning, and laterality of CP. At 2-year and 4-year follow-up, however, there were fewer participants with a low education level (27% and 23%), compared with baseline (39%, p = 0.02) (5, 25).
All participants gave verbal and written informed consent. The Medical Ethics Committee of Erasmus University Medical Center Rotterdam approved the study.
Measurements
Data were collected by means of physical examination, structured interviews and standardized questionnaires administered in the presence of a researcher. Demographic and clinical data, as well as work participation were measured at baseline, 2-year follow-up and 4-year follow-up. At 4-year follow-up additional measurements were performed for work limitations and perceived situational or health barriers in employed persons.
Sample characteristics. The following characteristics were recorded: age, gender, type and laterality of CP, gross motor function, manual ability, level of education, general self-efficacy and parents’ level of education.
Type (spastic/non-spastic) and laterality of CP (unilateral/bilateral) were established in accordance with guidelines of the Surveillance of Cerebral Palsy in Europe (SCPE) (26).
Gross motor function was classified according to the GMFCS, a 5-level classification system for CP based on spontaneous movement with an emphasis on sitting and walking (27).
Manual ability was classified with the Manual Ability Classification System (MACS), a 5-level system that classifies manual performance of children with CP (28, 29). Both classifications have shown to be valid for use with young adults with CP (29). Higher levels of GMFCS and MACS indicate better functioning.
Level of education of participants was categorized as High: secondary general education, higher professional education or university (International Standard Classification of Education (ISCED) levels 3 (general), 6 or higher), Medium: pre-vocational theoretical education or upper secondary vocational education (ISCED levels 3 (vocational), 4 or 5), and Low: pre-vocational practical education or lower (ISCED levels 1 or 2) (4, 30).
General self-efficacy was assessed with the Dutch language version of the General Self-Efficacy Scale-12 (GSES-12) (31). The 12 items are scored on a 5-point Likert scale. Total scores, and scores for subscales Initiative, Effort and Persistence were calculated. Scales have demonstrated satisfactory levels of internal consistency and test-retest reliability (31). Higher scores indicate a more positive perceived self-efficacy.
Work participation. Work participation was assessed using structured interviews addressing work participation, employment situation (type of job, work hours) and occupational disability. We distinguished 3 categories of work participation: (i) employed, including paid and unpaid employment; (ii) unemployed; and (iii) studying.
We defined employed as performing (paid or unpaid) work for ≥ 12 h/ week; unpaid employment was included in this category because it is important for young adults for entering the labour market and for social participation (32). The lower bound of 12 h a week was based on the labour force definition used by Statistics Netherlands (33), thus allowing comparison of data of the study sample with the general Dutch population. Studying was defined as being engaged in secondary or tertiary education as part of the formal education system (34). Participants were classified in 1 of 3 categories according to their main activity.
Work limitations and perceived situational or health barriers. In employed persons work limitations were assessed at 4-year follow-up using the modified Dutch-language version of the Work Limitations Questionnaire (WLQ-mdlv), a reliable and valid self-report instrument (35, 36). Scores on the 25 items are organized in 4 scales addressing specific job demands: Time Management (5 items), Physical Demands (6 items), Mental-Interpersonal Demands (9 items), and Output Demands (5 items). Scale scores can be interpreted as the percentage of time in the previous 2 weeks that a person was limited in performing specific job demands. The WLQ index is calculated from the 4 scales; higher scores indicate more work limitations.
Perceived situational or health barriers to employment (yes/no) among employed persons were assessed at 4-year follow-up, using a 28-item questionnaire from the national Amenities and Services Utilization Survey (AVO) of the Netherlands Institute for Social Research (37). The questionnaire comprised 9 items addressing situational barriers (e.g. work pace, work hours, work tasks, adequate facilities), 8 items addressing health problems (e.g. pain, fatigue, mobility, absence) and 11 items addressing work adjustments (e.g. adjusted work hours, work tasks, facilities, support of colleagues).
Statistical analyses
Descriptive statistics were used to present demographic and clinical characteristics, work participation, work limitations, and perceived situational or health barriers.
To assess the development in work participation, we analysed differences in proportions employed, unemployed and students at baseline, 2-year follow-up compared with 4-year follow-up, using Cochran’s Q and McNemar’s test. Cochran Q was used for testing overall differences over time; post-hoc McNemar test was used to compare paired proportions at 2 different assessments (0–2; 2–4; 0–4 years). Binomial tests (1-sided) were applied for comparison of proportions of employed, unemployed and students in the study sample with reference values of the general Dutch population in the age range 20–25 years in the year 2006 that were obtained from the electronic databank of Statistics Netherlands (StatLine) (33).
To assess associations of demographic and clinical characteristics with work participation at 4-year follow-up we conducted (cross-sectional) multinomial logistic regression analyses. Multinomial regression was used because the outcome variable had 3 values (employed, unemployed, study). Selection of independent variables studied was based on the literature, addressing age, gender, laterality of CP, level of education, gross motor function, manual ability, self-efficacy and parental level of education (9, 16, 21, 22, 38). Independent variables were dichotomized (high level of education vs low and medium level of education of participants and parents; GMFCS levels I–II vs levels III–V; MACS level I vs levels II–V). Scores on GSES were dichotomized at the median scores of the study sample identifying high (including the median) and low levels of general self-efficacy.
We used a 2-step approach to limit the number of independent variables to be included in a model, accommodating for the small sample size. First, univariate models were tested for one independent variable at a time. Secondly, multivariable analysis was performed entering the statistical significant (p < 0.05) independent variables of the first step into the model in order to examine the unique contribution of each of these independent variables to the prediction of work participation.
The WLQ-mdlv was completed by 31 of the 36 persons employed at 4-year follow-up, meaning missing data for 14% of the subsample on the WLQ-mdlv. One-sample t-tests were applied for comparison of WLQ-mdlv scores with reference values of healthy employees (35).
Analyses were performed using SPSS 19.0 statistical software. For all analyses, a significance-level of 0.05 and 95% confidence level was used.
RESULTS
Characteristics of the study sample (n = 74) and subgroups of employed, unemployed and students are shown in Table I. Almost all participants had a spastic paresis (96%), almost half of them were classified as unilateral CP (47%), the others as bilateral CP (53%). The majority (73%) had a high level of gross motor functioning, indicating no limitations in ambulation, and a high a level of manual ability. Seventy-seven percent followed secondary theoretical or higher education.
|
Table I. Characteristics of the study population at 4-year follow-up |
||||
|
Study sample (n = 74) |
Employed (n = 36) |
Unemployed (n = 13) |
Student (n = 25) |
|
|
Age, years, mean (SD) |
22.8 (1.4) |
23.4 (1.4) |
21.8 (1.1) |
22.6 (1.3) |
|
Male gender, n (%) |
45 (61) |
23 (64) |
6 (46) |
16 (64) |
|
Laterality of CP, n (%) |
||||
|
Unilateral |
35 (47) |
17 (47) |
3 (23) |
15 (60) |
|
Bilateral (diplegia/tetraplegia) |
23/16 (53) |
14/5 (53) |
3/7 (77) |
6/4 (40) |
|
GMFCS level, n (%) I II III–V |
54 (73) 7 (9) 13 (18) |
28 (78) 5 (14) 3 (8) |
6 (46) 2 (15) 5 (39) |
20 (80) 0 (0) 5 (20) |
|
MACS level, n (%) I II III–V |
60 (82) 9 (12) 4 (6) |
31 (86) 4 (11) 1 (3) |
8 (62) 2 (15) 3 (23) |
21 (87) 3 (13) 0 (0) |
|
Level of education, n (%) |
||||
|
High |
27 (36) |
10 (28) |
3 (23) |
14 (56) |
|
Medium |
30 (41) |
16 (44) |
3 (23) |
11 (44) |
|
Low |
17 (23) |
10 (28) |
7 (54) |
0 |
|
General self-efficacy, mean (SD) |
||||
|
Total |
45.5 (5.7) |
46.3 (5.5) |
44.1 (8.0) |
44.9 (4.8) |
|
Effort |
14.9 (3.6) |
15.3 (3.2) |
13.7 (5.4) |
14.9 (3.2) |
|
Persistence |
20.9 (2.9) |
21.3 (2.8) |
21.0 (4.0) |
20.2 (2.4) |
|
Initiative |
11.3 (2.8) |
11.5 (2.7) |
9.9 (3.5) |
11.4 (2.4) |
|
Parents’ level of educationa, n (%) |
||||
|
High |
25 (35) |
9 (24) |
4 (33) |
12 (48) |
|
Medium |
37 (52) |
17 (50) |
8 (67) |
12 (48) |
|
Low |
9 (13) |
8 (26) |
0 |
1 (4) |
|
Due to missing values: MACS level, n = 73; GSES, n = 71; parents’ level of education, n = 71. aMeasured at baseline. GMFCS: Gross Motor Function Classification System; MACS: Manual Ability Classification System; SD: standard deviation. |
||||
Work participation
Development of work participation from baseline to 2-year and 4-year follow-up is shown in Fig. 1. The proportion of employed persons (including paid and unpaid employment) increased from baseline to 2-year follow-up (12% vs 26%, p = 0.004) and from 2-year to 4-year follow-up (26% vs 49%; p < 0.001). The proportion of unemployed persons increased from baseline to 2-year follow-up (3% vs 14%, p = 0.04), stabilizing between 2- and 4-year follow-up (14% vs 17%). The proportion of students decreased from baseline to 2-year follow-up (85% vs 60%, p = 0.001) and from 2-year to 4-year follow-up (60% vs 34%, p < 0.001).
In addition, a total of 16 participants (22%) reported established occupational disability, i.e. (partial) occupational disability pension is granted, at baseline (n = 4), 2-year follow-up (n = 9) or 4-year follow-up (n = 8). Five persons reported established occupational disability at 2 measurements; none of the participants reported established occupational disability at all 3 measurements. Some participants with established occupational disability were (gainfully) employed or students.
At 4-year follow-up, in the age range 20–24 years (mean age 22.8 years), a total of 36 (49%) young adults with CP were employed (see Fig. 1). Of these, 34 (46%) had paid employment, of whom 29 (39%) were in competitive and 5 (7%) in sheltered employment. Two persons (3%) had unpaid employment. Eighteen out of 19 persons who were employed at 2-year follow-up, were still employed at 4-year follow-up, showing that they were able to maintain employment.
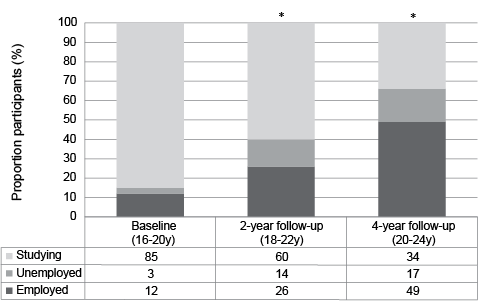
Fig. 1. Development of work participation in young adults with cerebral palsy (n = 74). Employed includes both paid and unpaid employment; unpaid employment: baseline n = 1 (1%), 2-year follow-up n = 4 (5%), 4-year follow-up n = 2 (3%). *Indicating significant differences in proportion employed participants.
On average, employed persons worked 32.8 h/week (standard deviation (SD) 9.3). Most of them (72%; n = 26) worked 32 h/week or more, with 10 persons working ≥ 40 h. Four persons were working 24–31 h/week, and 6 persons 12–23 h/week. Employed persons performed a broad variety of jobs in 10 of the 13 categories identified in the Dutch Standard Occupational Classification (39). Eighty percent of employed persons performed a job that was consistent with their level of education: 21% had a job requiring a high level of education, 44% a medium level and 35% a low level of education.
Thirteen persons (17%) were unemployed at 4-year follow-up; 7 of them were looking for a job, 6 others reported established occupational disability and received a disability pension. Longitudinal trajectories of those unemployed persons show that at 2-year follow-up, 4 persons were unemployed, 1 person was employed and 8 persons were studying; at baseline 1 (other) person was employed and 12 persons were studying. Four persons were unemployed both at 2-year and at 4-year follow-up; 3 of them reported established occupational disability at both measurements.
One-third of the study sample were studying (n = 25) at 4-year follow-up.
At 4-year follow-up, the employment rate in young adults with CP (49%; including 2 persons with unpaid employment) was lower than in the general Dutch population in the age range 20–25 years (59% in 2006; p < 0.05), and the proportion of unemployed persons was higher (17% vs 8%; p < 0.01) (33). Also, the proportion of students was lower than in the general population at this age (34% vs 44%; p < 0.05) (Table II).
|
Table II. Work participation of young adults with cerebral palsy (CP) aged 20–24 years compared with the general population |
||
|
Study sample at 4-year follow-up (20–24 years) % (n) |
Reference group: general population (20–25 years) % |
|
|
Employeda |
49 (36) |
59* |
|
Unemployed |
17 (13) |
8** |
|
Student |
34 (25) |
44* |
|
*p < 0.05; **p < 0.01. aPersons with unpaid employment (n = 2) were included. Note that the percentages of employed, unemployed and students in the general population add up to more than 100%, probably because persons may combine education with part-time employment. |
||
Factors associated with work participation
At 4-year follow-up employed persons did not differ from unemployed persons and students in gender, laterality of CP, manual ability, self-efficacy and parents’ level of education (Table III). Three variables (age, gross motor function, and level of education) were significantly associated with work participation in the univariate analyses. In the multivariable analysis these variables remained statistically significant, showing that each made a unique contribution to the prediction of 1 of 3 categories of work participation. The adjusted odds ratios show that participants with a lower age were more likely to be unemployed or studying than employed. Participants with a lower level of gross motor function were more likely to be unemployed than employed; participants with a higher level of education were more likely to be studying than employed. The logistic model including age, GMFCS level and level of education correctly classified 66.2% of cases in 3 categories, and 77.8% of employed persons, 46.2% of unemployed and 60.0% of studying.
|
Table III. Demographic and clinical characteristics of participants associated with work participation (employed, unemployed, student) at 4-year follow-up |
|||||
|
Independent variables |
Univariate modelsa Reference category: employed |
Multivariable modela Reference category: employed |
|||
|
Unemployed OR (95% CI) |
Student OR (95% CI) |
Unemployed aOR (95% CI) |
Student aOR (95% CI) |
||
|
Age |
0.38** (0.21–0.70) |
0.57* (0.37–0.92) |
0.30*** (0.15–0.62) |
0.45** (0.26–0.77) |
|
|
GMFCS level, High (I–II)/Low (III–V) |
0.15* (0.02–0.74) |
0.36 (0.07–1.68) |
0.08** (0.01–0.52) |
0.23 (0.04–1.25) |
|
|
Level of education, High/Low |
0.78 (0.18–3.43) |
3.31* (1.12–9.70) |
2.23 (0.38–13.24) |
6.31** (1.70–23.32) |
|
|
Gender, Male/Female |
0.48 (0.13–1.75) |
1.01 (0.35–2.90) |
|||
|
Laterality of CP, Unilateral/Bilateral |
0.34 (0.08–1.43) |
1.67 (0.60–4.71) |
|||
|
MACS level, High (I)/Low (II–V) |
0.36 (0.08–1.64) |
1.13 (0.24–5.24) |
|||
|
Self-efficacy (GSES), High/Low |
0.63 (0.16–2.44) |
0.81 (0.29–2.28) |
|||
|
Parents’ level of education, High/Low |
1.38 (0.34–5.76) |
2.56 (0.86–7.65) |
|||
|
*p < 0.05; **p < 0.01 ***p < 0.001. aMultinomial logistic regression analysis; Outcome variable: work participation, in 3 categories (employed, unemployed, student). OR: odds ratio; aOR: adjusted OR; CI: confidence interval; GMFCS: Gross Motor Function Classification System; MACS: Manual Ability Classification System; GSES: General Self-Efficacy Scale. |
|||||
Experienced work limitations and situational or health barriers among employed persons
At 4-year follow-up, WLQ-mdlv scores of employed persons indicate that they were limited on the job approximately 10% of the time in the previous 2 weeks, especially in physical and output demands (Table IV). They had significantly more work limitations in physical demands compared with reference values of healthy employees (mean score 4.5 (SD 1.4)) (1-sample t-test, t = 2.12, p < 0.05) (35, 40). Reported difficulties in physical demands concerned lifting, carrying or moving objects, and sitting or standing in one position for some time while working. Moreover, items of the physical demands scale were often scored as “Does not apply to my job (DNA)”. In total, 27 items (3.5%) were scored as DNA, of which 17 on the physical demands scale (9.1% of responses of the scale).
A majority of the employed persons (72%) perceived no situational or health barriers to employment; 3 of them (8%) had work adjustments. Ten persons (28%) reported 1 or more situational or health barriers interfering with their work, notwithstanding the use of 1 to 5 work adjustments in 5 of them. These persons reported more work limitations on all WLQ-mdlv scales and showed significantly higher scores (meaning more limitations) on the physical demands scale compared with those not experiencing situational or health barriers (Mann-Whitney U test: p = 0.018; Z = –2.55) (Table IV). Situational barriers addressed work hours (n = 2), work pace, work tasks (unsuited), or other (transport, attitude colleagues). Health barriers that were reported were fatigue (n = 5), pain (n = 2), absence, concentration, mental problems or other (fine motor skills, lifting objects).
Eight employed persons (22%) had work adjustments, concerning work hours (n = 2), work pace (n = 2), work tasks, adequate facilities (n =4) or other (lift, transport, job coach, assistance, education); 3 of them reported no situational or health barriers.
|
Table IV. Work limitations of employed persons with cerebral palsy at 4-year follow-up as measured with the Work Limitations Questionnaire (WLQ) (n = 31)a |
|||
|
Employed persons (n = 31)a Mean (SD) |
Employed; no situational or health barriers (n = 23) Mean (SD) |
Employed; ≥ 1 situational or health barriers (n = 8) Mean (SD) |
|
|
Time management |
9.2 (14.0) |
5.9 (9.7) |
18.8 (20.1) |
|
Physical demands |
10.8 (16.4) |
5.4 (10.0) |
25.7 (21.7)* |
|
Mental-interpersonal demands |
9.6 (12.1) |
7.6 (11.4) |
15.3 (13.1) |
|
Output demands |
12.9 (17.8) |
9.1 (11.0) |
23.8 (27.1) |
|
WLQ index |
3.0 (3.7) |
2.0 (2.5) |
5.8 (5.1) |
|
*p < 0.05; significant differences between employed persons experiencing no barriers and persons experiencing ≥ 1 barriers. a5 employed persons did not complete the WLQ; 2 of them experienced situational or health barriers. SD: standard deviation. |
|||
DISCUSSION
Work participation
To our knowledge this is the first cohort study to document the longitudinal development of work participation in a sample of young adults with CP of average intelligence during their transition to adulthood. This study adds to our knowledge on the transition to employment in young adults with CP, showing that approximately 50% of them are employed at the age of 20–24 years, furthermore indicating that 1 in 4 employed persons with CP experiences situational or health barriers in performing their job. In addition, this study demonstrates that young adults with CP are at increased risk for unemployment.
In the age range 20–24 years a significantly higher proportion of young adults with CP was employed compared with 2 and 4 years earlier, working on average approximately 33 h per week. Young adults with CP who achieved employment seemed able to maintain employment over several years. Both the increasing proportion of employed persons and the decreasing proportion of students over the 4-year period might be expected from an age-appropriate developmental process that is in accordance with the transition to adulthood (8). We expect the employment rate of the study sample to further increase when they become older and grow into adulthood, since one-third was still studying at the age of 20–24 years. Reduced employment rates in young adults with CP under the age of 26 years and age as important factor for employment outcomes were previously reported by Bottos et al. (18 ) and Huang et al. (13). However, the increasing proportion of persons with CP that are unemployed over time, as well as the relatively high proportion of persons in young adulthood that are unemployed indicate that a significant part of the sample was at risk for an unfavourable development in work participation.
At 4-year follow-up, approximately half of the unemployed persons reported established occupational disability; on the other hand some persons with established occupational disability achieved paid employment and did not need to receive (partly) disability pension. In the Netherlands young adults with established occupational disability (of 25% or more at their 17th birthday) are entitled to disability pension from their 18th birthday. Although for young adults with a chronic condition established occupational disability might be permanent, the amount of disability pension may vary. Some young adults with established occupational disability might continue studying because of lack of employment opportunities.
In addition, this study shows the discrepancy in employment outcomes for young adults with CP compared with Dutch age-mates. The employment rate of young adults with CP found in this study is in line with, or compares favourably with, other studies in CP (2, 11, 12, 16–19) and is in line with the 47% employment rate reported for people with disabilities in the Netherlands in 2006 (37). We found support for the importance of lower gross motor function with regard to unemployment, in addition to younger age (16, 18, 21–23). In contrast, those factors that are potentially amenable to interventions seemed not to be associated with work participation (such as manual ability, general self-efficacy); depression or coping strategies were not studied in this sample.
Work limitations and perceived situational or health barriers
Those young adults with CP who were employed experienced few work limitations. We might assume that they tend to perform jobs that are not physically demanding, since items of the work limitations questionnaire addressing physical demands were most often scored as “Does not apply to my job”.
Most of the employed persons perceived no situational or health barriers and did not use work adjustments. However, approximately 25% of them did experience situational or health barriers to employment. The latter persons showed higher scores on the WLQ-mdlv scales, indicating that the WLQ can be a useful instrument for revealing work problems among employed young adults with CP. The barriers they reported, such as work hours, fatigue or pain, might be amenable to interventions.
Study limitations
Generalization of our results is limited to young adults with CP of average intelligence with relatively high levels of gross motor function and manual ability. Due to the small sample size the results should be interpreted with some caution, as indicated by large confidence intervals regarding associated factors for work participation and a small number of employed persons that reported work limitations on the WLQ. In addition, due to the differential drop-out of persons with a low level of education at follow-up, results on work participation over time might be slightly biased, with a possible over-estimation of the proportion of students at follow-up. Since work participation may be influenced by legislation and the labour market within countries, and by socio-economic factors, such as insurance and social services, some caution is needed when generalizing the results of this study to other countries.
A longer follow-up period, until age 25–30 years, might be needed to provide more information about work participation at adult age, since over 30% of the sample is still studying.
Notwithstanding these limitations, the present study provides important insights into the transition to employment in a well-documented sample of young adults with CP, indicating that young adults with CP with high levels of gross motor function and of average intelligence show a relatively high unemployment rate.
Implications for clinical practice
The finding that relatively low proportions of young adults with CP and average intelligence were employed or studying, and a relatively high proportion was unemployed, compared with the general population of the same age, indicates that young adults with CP might need support to prevent unemployment. Due to their young age, they have much to gain in achieving employment during many years. Besides providing financial independence, work experience in young adults can contribute to discovering and developing personal interests and skills, but also to increased awareness of physical abilities and limitations (41, 42).
Interventions should focus on preventing the risk of unemployment among young adults with CP, by evaluating and training work ability and providing support in finding suitable employment. Providing support shortly after completing formal education might be most effective since early intervention and prevention are key issues in vocational rehabilitation (41). Based on our findings, special attention should be paid to young adults with CP with a lower level of gross motor function, since they are expected to encounter more challenges in achieving suitable employment.
Secondly, approximately 25% of the employed persons with CP experienced situational or health barriers in performing their job. They may profit from interventions aiming to prevent occupational disability by decreasing barriers and evaluating work adjustments. Vocational rehabilitation interventions may support these young adults and encourage vocational planning as part of lifespan care. Young adult teams, using a multidimensional and multidisciplinary approach, are specialized in supporting the transition to adulthood in several domains of participation, including employment. They offer programs aiming to support young adults to develop necessary life skills and to adapt to changing roles in adult life (4, 5, 43, 44). Young adults with CP might profit from a vocational rehabilitation intervention provided by young adult teams to improve work participation in suitable employment, and to prevent occupational disability and unemployment (43).
In conclusion, this study shows that young adults with CP and average intelligence are at risk for an unfavourable development in work participation, showing a lower employment rate (49% vs 59%) and a higher unemployment rate (17% vs 8%) in the age range 20–24 years compared with the general Dutch population of the same age.
One out of 4 employed persons experienced situational or health barriers to employment, mainly fatigue or pain; work limitations addressed mainly output and physical demands.
Rehabilitation services might offer support to prevent unemployment and occupational disability, focusing on younger persons with CP and lower levels of gross motor function who are at increased risk for unemployment and on employed young adults with CP who experience work limitations.
ACKNOWLEDGEMENTS
The following centres of the Transition and Lifespan Research Group South West Netherlands contributed to this study: Department of Rehabilitation Medicine, Erasmus University Medical Centre and Rijndam Rehabilitation Center (J van Meeteren, MD, PhD; WMA van der Slot, MD PhD, DJHG Wiegerink, PhD), Sophia Rehabilitation, The Hague/Delft; Department of Rehabilitation Medicine, Leiden University Medical Center and Rijnlands Rehabilitation Center, Leiden; Rehabilitation Center Revant, Goes, Rehabilitation Center De Hoogstraat, Utrecht and BOSK, Association of Physically Disabled Persons and their Parents. This study was performed as part of the PERRIN research program (Pediatric Rehabilitation Research in the Netherlands).
The authors thank ZonMw (grant number 1435.001) and Rotterdams Kinderrevalidatie Fonds Adriaanstichting (KFA grant number 01-08-06) for their financial support.
REFERENCES

