Benjamin Hidalgo, PE, PT-MT, DO1, Henri Nielens, MD, PhD1, Maxime Gilliaux, PT, PhD student1, Toby Hall, PT-MT, PhD2 and Christine Detrembleur, PT, PhD1
From the 1University of Louvain, Institute of Neuroscience, Brussels, Belgium and 2School of Physiotherapy, Curtin Innovation Health Research Institute, Curtin, University of Technology, Perth, Australia
OBJECTIVE: To determine whether kinematic algorithms can distinguish subjects with chronic non-specific low back pain from asymptomatic subjects and subjects simulating low back pain, during trunk motion tasks.
DESIGN: Comparative cohort study.
SUBJECTS: A total of 90 subjects composed 3 groups; 45 chronic non-specific low back pain patients in the CLBP group; 45 asymptomatic controls people in the asymptomatic controls group. 20/45 subjects from the asymptomatic controls group composed the CLBP simulators group as well.
Method: During performance of 7 standardized trunk motion tasks 6 spinal segments from the kinematic spine model were recorded by 8 infrared cameras. Two logit scores, for range of motion and speed, were used to investigate differences between the groups. Group allocation based on logit scores was also calculated, allowing the assessment of sensitivity and specificity of the algorithms.
RESULTS: For the 90 subjects (pooled data), the logit scores for range of motion and speed demonstrated highly significant differences between groups (p < 0.001). The logit score means and standard deviation (SD) values in the asymptomatic group (n = 45) and chronic non-specific low back pain group (n = 45), respectively, were –1.6 (SD 2.6) and 2.8 (SD 2.8) for range of motion and –2.6 (SD 2.5) and 1.2 (SD 1.9) for speed. The sensitivity and specificity (n = 90) for logit score for range of motion were 0.80/0.82 and for logit score for speed were 0.80/0.87, respectively.
CONCLUSION: These results support the validity of using 2 movement algorithms, range of motion and speed, to discriminate asymptomatic subjects from those with low back pain. However, people simulating low back pain cannot be distinguished from those with real low back pain using this method.
Key words: kinematics; validity; spine; movement; low back pain; manual therapy.
Correspondence address: Hidalgo Benjamin, Université Catholique de Louvain, Institute of Neuroscience, Avenue Mounier, 53 – B1.53.04, BE-1200 Brussels, Belgium. E-mail: benjamin.hidalgo@uclouvain.be
J Rehabil Med 2014; 46: 00–00
Accepted Mar 18, 2014; Epub ahead of print Jun 11, 2014
INTRODUCTION
Chronic non-specific low back pain (CLBP) is a growing problem in Western industrialized countries, which brings diagnostic and treatment challenges (1–4). From a diagnostic point of view, in general, people with CLBP have no clear patho-anatomical features distinguishing them from asymptomatic subjects. For example, there is a poor correlation between features seen on spinal imaging and symptoms of low back pain (LBP) (1, 3, 5). Thus, diagnosis of non-specific LBP is based mainly on subjective and physical clinical examination criteria (1–3, 6–9). Kinematic analysis of trunk motion appears promising in the diagnosis and discrimination of people with non-specific LBP (1, 9–12). Some of these features may also enable differentiation into treatment specific sub-groups, which may have value in the management of LBP (13).
Our previous study (12) showed that kinematic tools are useful in identifying impairments in people with CLBP, both quantitatively (range of motion, speed and acceleration) and qualitatively (motion signatures), when single and combined planes of movement are investigated (1, 10–13). The study identified 2 kinematic algorithms (logit scores) that could be used to distinguish people with CLBP from asymptomatic controls on the basis of a binary logistic regression analysis (12). The first algorithm is an index for range of motion (ROM) and the second is an index for speed of movement (SPEED). The sensitivity and specificity of the logits for these algorithms has been reported previously (12). To our knowledge, no studies have investigated whether movement algorithms can correctly identify people simulating LBP from those with actual LBP in order to address the external validity (i.e. the generalizability) of the research findings.
The aim of this study was to evaluate the external validity and generalizability of previously reported algorithms in the quantitative assessment of spinal movement impairment in an independent sample of asymptomatic controls, people simulating LBP, and those with CLBP.
METHODS
Subjects
This study comprised 90 subjects, of whom 50 were from a previous investigation (25 healthy controls and 25 subjects with CLBP) (12), together with 40 new subjects (20 asymptomatic subjects who represented the healthy simulators and 20 with CLBP). Anthropometric data are shown in Table I. The CLBP group included men and women recruited from Cliniques Universitaires St-Luc (Woluwé - Saint - Lambert, Belgium). At the time of the experiment, these subjects had CLBP with or without radiating pain no further than the knee (Quebec Task force 1–2 categories) for at least 12 weeks and had clinical physical examination features of spinal movement impairment. The asymptomatic subjects had no history of LBP for at least 6 months prior to the experiment. The study protocol was approved by the human research ethics committee of the institution.
|
Table I. Baseline characteristics of asymptomatic subjects and patients with chronic non-specific low back pain (CLBP) |
||||
|
Asymptomatic controls and LBP simulators |
CLBP |
Asymptomatic controls from previous study |
CLBP from previous study |
|
|
Male/Female, n |
11/9 (n = 20) |
11/9 (n = 20) |
10/15 (n = 25) |
12/13 (n = 25) |
|
Age, years, mean (SD) |
39.9 (13.5) |
45.1 (11.6) |
40 (11) |
42 (9) |
|
Body mass index, mean (SD) |
23.5 (2.8) |
27.4 (3.5) |
23.3 (2.5) |
25.2 (3.2) |
|
Visual analogue scale, mean (SD) |
0.2 (0.4) |
2.9 (1.7) |
0 |
2.5 (1.5) |
|
Oswestry Disability Index (%), mean (SD) |
1.6 (1.8) |
17.9 (8.2) |
0 |
19.8 (8.6) |
|
SD: standard deviation; LBP: low back pain. |
||||
Protocol and material
Seven standardized trunk motion tasks, described below, were assessed in the kinematic spine model, and recorded by 8 infrared cameras (ELITE-BTS, Milan, Italy). The kinematic spine model, the trunk movement standardization procedure, data collection and statistical analysis have been described in a previous study (12).
All subjects were asked to follow 4 rules during movement tasks, which were performed in a seated position: (i) begin and end each movement with a neutral spine posture; (ii) to move at a self-determined (spontaneous) speed through the largest possible range; (iii) to maintain contact between the ischial tuberosities and the stool; (iv) and to adhere strictly to the plane of motion specified by each task. Each movement was repeated 15 times and recorded after the fifth movement (n = 10 trials).
Twenty asymptomatic subjects formed the LBP simulators group. These subjects were asked firstly to perform all the trunk tests in a natural way (asymptomatic controls) and, secondly, to repeat the task simulating CLBP (simulators) while carrying out each movement task (14).
The trunk motion tasks were as follows:
Anterior trunk flexion. Subjects positioned themselves with their hands over their ears and their elbows forward, and then flexed the trunk as far as possible with respect to the sagittal plane.
Lateral trunk side-bending left and right. Subjects crossed their arms on their chest, and then inclined their trunk in the frontal plane.
Rotation left and right. Subjects crossed their arms on their chest, and rotated their head and shoulders to the side as far as possible, while respecting the transverse plane.
Anterior trunk flexion with left and right rotation (rotated pelvis). The subject sat on the stool with the pelvic rotated 30° to the left or right, and the subject was given the same instructions as in the anterior flexion task.
Statistical analysis
Comparison of the kinematic variables between groups was carried out using 1-way analysis of variance with pairwise multiple comparison procedures (Holm-Sidak method, factor groups) (Sigmastat® 3.5, Systat Software, Inc., San Jose, USA) (Table II).
|
Table II. Asymptomatic controls and low back pain (LBP) simulators vs chronic non-specific low back pain patients, one-way analysis of variance of each spinal segment in each task |
||||||
|
Trunk tasks |
Asymptomatic controls (n = 20) Mean (SD) |
CLBP (n = 20) Mean (SD) |
CLBP simulators (n = 20) Mean (SD) |
Comparisons for factor |
||
|
Asymptomatic controls vs LBP |
CLBP vs LBP simulators |
CLBP simulators vs asymptomatic controls |
||||
|
Flexion ROM |
||||||
|
LLS, ° |
49.1 (17.1) |
45.6 (22.8) |
32.2 (17.2) |
No |
No |
Yes* |
|
HLS, ° |
55.1 (16.7) |
49.8 (22.6) |
37.6 (18.6) |
No |
No |
Yes* |
|
TLS, ° |
61.8 (16.7) |
54.1 (22.9) |
42.9 (20.4) |
No |
No |
Yes* |
|
LTS, ° |
80.5 (17.2) |
68.9 (22.1) |
52.5 (23.9) |
No |
Yes* |
Yes*** |
|
HTS, ° |
91.8 (17.5) |
76.7 (23.9) |
60.2 (23.3) |
Yes* |
Yes* |
Yes*** |
|
SPEED |
||||||
|
LLS, °/s |
128.7 (49.1) |
87.1 (40.7) |
59.7 (27.5) |
Yes** |
Yes* |
Yes*** |
|
HLS, °/s |
142.1 (48.5) |
91.8 (42.1) |
67.4 (28.5) |
Yes*** |
No |
Yes*** |
|
TLS, °/s |
162.1 (48.1) |
103.1 (43.6) |
80.3 (30.1) |
Yes*** |
No |
Yes*** |
|
Rotation, left ROM |
||||||
|
SS, ° |
83.1 (12.8) |
64.2 (13.9) |
57.1 (13.5) |
Yes*** |
No |
Yes*** |
|
Rotation, right ROM |
|
|
|
|||
|
SS, ° |
81.2 (11.9) |
67.1 (12.2) |
54.5 (13.4) |
Yes*** |
Yes** |
Yes*** |
|
Flexion with rotation, left ROM |
||||||
|
LLS, ° |
39.3 (15.3) |
30.9 (17.3) |
23.8 (16.3) |
No |
No |
Yes** |
|
HLS, ° |
45.4 (14.4) |
35.8 (18.1) |
28.1 (17.3) |
No |
No |
Yes** |
|
TLS, ° |
52.1 (14.2) |
40.5 (19.1) |
32.4 (18.8) |
No |
No |
Yes*** |
|
LTS, ° |
69.5 (15.5) |
54.9 (19.8) |
42.9 (21.4) |
Yes* |
No |
Yes*** |
|
HTS, ° |
81.2 (17.9) |
65.4 (21.1) |
51.3 (20.8) |
Yes* |
Yes* |
Yes*** |
|
SPEED |
|
|
||||
|
LLS, °/s |
109.5 (46.4) |
66.9 (36.4) |
47.9 (27.5) |
Yes*** |
No |
Yes*** |
|
HLS, °/s |
122.7 (45.5) |
74.1 (38.6) |
54.3 (29.1) |
Yes*** |
No |
Yes*** |
|
TLS, °/s |
142.7 (45.2) |
86.6 (40.8) |
65.1 (32.1) |
Yes*** |
No |
Yes*** |
|
Flexion with rotation, right ROM |
||||||
|
LLS, ° |
41.1 (13.1) |
29.7 (18.1) |
22.9 (16.1) |
No |
No |
Yes*** |
|
HLS, ° |
47.2 (11.9) |
33.9 (18.5) |
26.7 (17.3) |
Yes* |
No |
Yes*** |
|
TLS, ° |
54.1 (11.4) |
38.1 (19.5) |
30.6 (18.9) |
Yes** |
No |
Yes*** |
|
LTS, ° |
73.2 (11.7) |
51.9 (19.5) |
43.4 (20.7) |
Yes*** |
No |
Yes*** |
|
HTS, ° |
84.8 (13.2) |
61.7 (20.2) |
49.1 (22.5) |
Yes*** |
Yes* |
Yes*** |
|
SPEED |
||||||
|
LLS, °/s |
111.4 (39.2) |
63.1 (35.9) |
46.7 (26.1) |
Yes*** |
No |
Yes*** |
|
HLS, °/s |
124.4 (38.7) |
69.4 (37.5) |
52.6 (28.4) |
Yes*** |
No |
Yes*** |
|
TLS, °/s |
144.1 (38.9) |
80.8 (40.1) |
64.6 (33.1) |
Yes*** |
No |
Yes*** |
|
LS ROM |
–0.47 (2.5) |
3.2 (3.4) |
5.6 (3.5) |
Yes*** |
Yes* |
Yes*** |
|
LS SPEED |
–2.9 (2.5) |
1.1 (2.5) |
2.1 (2.1) |
Yes*** |
No |
Yes*** |
|
All pairwise multiple comparison procedures (Holm-Sidak method), comparison for factors (groups): *p < 0.05; **p < 0.005; ***p < 0.001. ROM: range of motion (°); SPEED: velocity (°/s). LLS: low lumbar spine (S2–L3); HLS: high lumbar spine (L3–T12); TLS: total lumbar spine (S2–T12); LTS: low thoracic spine (T12–T7); HTS: high thoracic spine (T7–C7); SS: shoulder segment (AcLeft–AcRight); SD: standard deviation; LS ROM: logit score for range of motion; LS SPEED: logit score for speed. |
||||||
Binary logistic regression analysis was previously used to evaluate the kinematic spine model in each group, with 2 logit scores (LS) calculated for ROM and SPEED (see Table III) (12). For this, we calculated an index to enable discrimination between groups using binary logistic regression analyses (stepwise forward likelihood ratio in SPSS). These analyses were applied only to variables found to differ significantly by Student’s t-tests (n = 26). These variables were assigned as independent variables, and group membership (0 = healthy, 1 = chronic LBP) was the dependent variable. Before regression analyses were performed, the variance inflation factor (VIF) was estimated for each of the 26 selected variables, in order to remove variables with strong correlation (VIF > 10); 17 variables were finally selected and included in the logistic regression (12).
|
Table III. Kinematic algorithms and probability equations from previous study (12) |
|||||||
|
Logit score |
Sensitivity/ specificity,% |
Cut-off value |
Area under ROC curve (95% CI) |
Standard error |
p-value (area = 0.5) |
Probability (α = 0.05) |
|
|
LS ROM = 17.77–(0.074 × LTS°)–(0.11×SS°)–(0.059×TLS°) |
92/84 |
–0.6507 |
0.95 (0.85–0.99) |
0.028 |
< 0.0001 |
P = |
eLSrom |
|
1 + eLSrom |
|||||||
|
LS SPEED = 6.19–(0.063 × TLS°/s) |
92/80 |
–0.3544 |
0.90 (0.77–0.96) |
0.050 |
< 0.0001 |
P = |
eLSspeed |
|
1 + eLSspeed |
|||||||
|
p > 0.5 = patient affected by chronic non-specific low back pain. ROC: receiver operating characteristic; CI: confidence interval; LS ROM: logit score for range of motion; LTS°: lower thoracic spine ROM in flexion; SS°: shoulder segment ROM in right rotation; TLS°: total lumbar spine ROM in flexion with left rotation; LS SPEED: logit score for speed; TLS°/s: total lumbar spine speed in flexion with right rotation. |
|||||||
The generalizability of our previous results to correctly identify people with the use of LS was the main goal of this study. Therefore, we investigated the sensitivity and specificity of the previously determined algorithms using the probability equation (Table III) on the 40 new subjects in the present study, with the following equation:
Sensitivity = true positives/(true positives + false negatives)
Specificity = true negatives/(true negatives + false positives)
Following this, the overall sensitivity and specificity were calculated by pooling the results of LS for ROM and SPEED from both studies (n = 90 subjects) using the receiver operating characteristic (ROC) curves (MedCalc software,version 11.5, Mariakerke, Belgium).
RESULTS
The results of the between-groups’ comparison of kinematic variables of each spinal segment in each task as well as for kinematic algorithms (ROM and SPEED) are shown in Table II.
Concerning the LS for ROM (n = 40), a highly significant difference was found between the groups with p-value < 0.001 (power of 1.000 with alpha = 0.05). The mean and standard deviation (SD) of LS for ROM was –0.47 (SD 2.5) in the asymptomatic control group (n = 20); 3.2 (SD 3.4) in the CLBP group (n = 20); and 5.6 (SD 3.5) in the LBP simulator group (n = 20). In addition, the LS for SPEED demonstrated highly significant differences between the groups, with p-value < 0.001 (power of 1.000 with alpha = 0.05). The mean of LS for SPEED was –2.9 (SD 2.5) in the asymptomatic control group; 1.1 (SD 2.5) in the CLBP group; and 2.1 (SD 2.1) in the LBP simulator group.
When matching subjects of both the current and previous studies (n = 90), the comparison between the asymptomatic subjects (n = 45) with those with LBP (n = 45) revealed highly significant differences (p < 0.001; power of 1.000 and alpha = 0.05) for the LS’s ROM and SPEED. The means and SD values for the combined asymptomatic group and CLBP group, respectively, for LS ROM were –1.6 (SD 2.6) and 2.8 (SD 2.8); and for LS SPEED were –2.6 (SD 2.5) and 1.2 (SD 1.9).
Using the probability equation presented in Table III, we calculated the probability that each new subject in this study had LBP.
For the index of LS ROM:
• Asymptomatic controls (n = 20): 8 were positive and 12 were negative; 60% of healthy controls were correctly classified.
• LBP simulators (n = 20): 19 were positive and 1 was negative; 5% of healthy simulators were correctly classified.
• CLBP (n = 20): 4 were negative and 16 were positive; 80% of LBP subjects were correctly classified.
Based on the data of asymptomatic controls and CLBP subjects, the sensitivity was 0.80, with specificity 0.60. Positive predictive value (PPV) was 0.67 and negative predictive value (NPV) 0.75.
For the index of LS SPEED:
• Asymptomatic controls (n = 20): 2 were positive and 18 were negative; 90% of healthy controls were correctly classified.
• LBP simulators (n = 20): 20 were positive and 0 was negative; 0% of healthy simulators were correctly classified.
• CLBP (n = 20): 7 were negative and 13 were positive; 65% of LBP subjects were correctly classified.
Based on the data of asymptomatic controls and CLBP subjects, the sensitivity was 0.65 and specificity 0.90, with PPV 0.87 and NPV 0.72.
Using LS of ROM and SPEED with ROC curves analysis on all subjects of both studies (n = 90), we calculated an overall sensitivity/specificity:
• For LS ROM: sensitivity was 0.80 (0.65–0.90) and specificity 0.82 (0.68–0.92) with a cut-off score of 0.77 (area under the ROC curve: 0.88 with standard error: 0.03 and significant level p < 0.0001; Youden Index: 0.62).
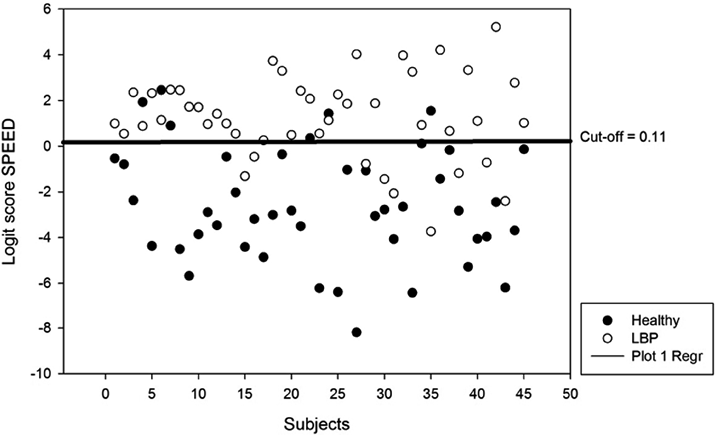
• For LS SPEED: sensitivity was 0.80 (0.65–0.90) and specificity 0.87 (0.73–0.95) with a cut-off score of 0.11 (area under the ROC curve: 0.88 with standard error: 0.03 and significance level p < 0.0001; Youden Index: 0.66).
The LS pooled values of each subject for groups CLBP (n = 45) and asymptomatic controls (n = 45) are shown in Figs 1 and 2.
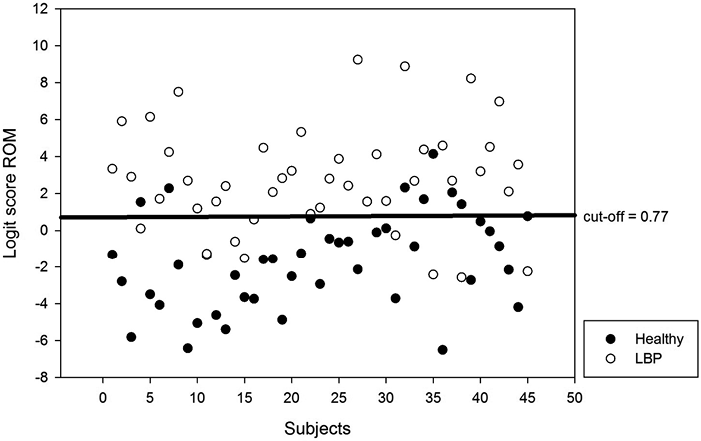
Fig. 1. Scatter plot of pooled data for logit scores of range of motion (ROM) of asymptomatic controls (n = 45) and subjects with chronic non-specific low back pain (LBP) (n = 45).
DISCUSSION
The kinematic algorithms ROM and SPEED clearly discriminated the groups with highly significant differences. In comparison with people with CLBP, the kinematic values for people voluntarily simulating LBP were lower, and the LS differed significantly (Table II). When the healthy subjects tried to simulate CLBP, they were unable to mimic the true kinematics of people with chronic LBP. During each movement task the healthy subjects exaggerated the spinal movement impairments, as if they were affected by an acute LBP.
The present findings also confirm those of the previous study concerning the data from the trunk lateral flexion task, which did not differ significantly between the groups. This task was once again not useful in discriminating subjects with chronic LBP, at least when carried out in a seated position (12).
The sensitivity and specificity of both LS (ROM and SPEED) were previously found to be excellent in discriminating people with CLBP (12). However, when applying the previously determined probability equation to a new independent sample of subjects, we found only a moderate to good level of sensitivity and specificity. Despite this, when data from both studies are pooled, the ROC curves analysis of both LS (ROM and SPEED) revealed improved overall sensitivity and specificity.
The results of the present and previous study (12) indicate that the algorithms ROM and SPEED provide useful discrimination between populations. These kinematic measures may be helpful in sub-grouping people with movement impairment in LBP, which may have potential benefit in future clinical trials. For example, the targeting of specific interventions, such as manual therapy, might be better suited to people with certain movement impairments identified through these algorithms. This requires further investigation.
The present study has several limitations. Simulating CLBP is problematic because of the inherent multifactorial nature of CLBP, which influences the kinematic outputs during movement. Subjects may have had difficulty imagining and carrying out the simulation of CLBP. In the case of CLBP, pain may arise from a variety of causes. The cognitive interpretation of pain has multiple psycho-social influences (e.g. misrepresentation of body schema, anxiety, depression, education, beliefs, negativism, catastrophization, lifestyle). In turn, this may influence central sensitization, resulting in altered “outputs”, in particular movement behaviours and patterns of impairment seen when examining patients with CLBP (2, 3, 15). All these elements are very difficult, if not impossible, to simulate in our sample of LBP simulators. Moreover, we should not forget a possible more important Hawthorne learning effect in the subjects simulating LBP that may have influenced the simulated patterns of movement.
In conclusion, these results validate the use and generalizability of both kinematic algorithms for the discrimination of spinal movement impairments between healthy controls and patients with CLBP. However, subjects who were simulating CLBP could not be correctly classified by our method. This validation study supports the use of this method to objectively evaluate the efficacy of physical manual therapy treatment in future clinical trials.
ACKNOWLEDGEMENT
This research was supported by internal grants of the University of Louvain.
REFERENCES

