Cristina Bostan, MSc1, Cornelia Oberhauser, MSc2, Gerold Stucki, MD1, Jerome Bickenbach, PhD1 and Alarcos Cieza, PhD2,3,4
From the 1Department of Health Science and Health Policy, University of Lucerne and Swiss Paraplegic Research, Nottwil, Switzerland, 2Department of Medical Informatics, Biometry and Epidemiology – IBE, Pettenkofer School of Public Health (PSPHLMU), Research Unit for Biopsychosocial Health, Ludwig-Maximilians University (LMU) Munich, Germany, 3Faculty of Social and Human Sciences, School of Psychology, University of Southampton, Southampton, UK and 4Swiss Paraplegic Research, Nottwil, Switzerland
OBJECTIVE: To determine which environmental factors are associated with performance when controlling for capacity, using the International Classification of Functioning, Disability and Health (ICF).
METHODS: A psychometric study using a sample of 296 persons with musculoskeletal health conditions as a case in point. The following steps were carried out: (i) Rasch analyses created 2 interval measurement scales, capacity and performance, based on 22 Activities and Participation ICF categories that had been rated as capacity and performance. Capacity and performance scores, ranging from 0 (low level) to 100 (high level) were calculated; (ii) group lasso regression was used to identify the environmental factors associated with a person’s performance when controlling for capacity. Gender, age and health condition were forced to remain in the model.
RESULTS: A capacity scale based on 16 ICF categories (rated as capacity) and a performance scale based on 18 categories (rated as performance) were created. Thirteen environmental factors ICF categories covering the physical, social, attitudinal and political environment were identified as highly associated with patient’s performance.
CONCLUSION: Using an exclusively statistical approach this study identified environmental factors associated with a person’s performance.
Key words: musculoskeletal conditions; ICF; capacity; performance; environmental factors; group lasso.
J Rehabil Med 2014; 46: 806–813
Correspondence address: Cristina Bostan, Swiss Paraplegic Research, Nottwil, Switzerland. E-mail: cristina.bostan@paraplegie.ch
Accepted Mar 17, 2014; Epub ahead of print Jul 30, 2014
INTRODUCTION
Unlike its 1948 definition of health, the understanding of health proposed by the World Health Organization (WHO) in the publication Summary Measures of Population Health is purely a biological concept, in which health is an intrinsic state of the human body describable in terms of bodily functions that can be optimal or less than optimal, and which are changeable over time (1). This understanding of health is captured by the International Classification of Functioning, Disability and Health (ICF)’s theoretical construct of capacity (2), understood as the actual and measureable level of functioning of different parts of the human body (3).
It is also intuitive to think of our health in terms of what our level of capacity in different functioning domains allows us to do in life, in interaction with our environment. Our health matters to us because it plays out in our lives in terms of what we do, e.g. walking, reading, planning our days, taking care of our family, getting an education or a job, participating in our community (4–6). This is an instrumental view of health: the various ways in which our intrinsic state of biological health interacts with our world to produce a state of what might be called “lived health”. This state is also captured in the ICF by the construct of performance. Performance is the outcome of the interaction between the intrinsic capacity of the person with both the environmental and personal factors.
In line with the ICF’s understanding of a person’s performance, clinical interventions, especially in rehabilitation (7–9), do not only target the body and its capacity to function but also our performance in everyday life. There are a large number of interventions that target a person’s environment with the ultimate goal of influencing performance. For instance, for rheumatoid arthritis pain and disease at the same time, rehabilitation involves the provision of, and fitting and training in the use of, assistive devices and other functional equipment that can improve work performance (10). Interventions targeting the environment to influence performance are also possible at the level of policy. Laws that mandate the provision of street ramp kerbs or the construction of accessible buildings can have a profound impact on the level of performance of persons with spinal cord injury engaged in their activities of daily living (11).
The need to identify the environmental factors that can effectively improve performance is recognized by clinicians and policy-makers. Different studies have sought to identify, for specific health conditions such as spinal cord injury and rheumatoid arthritis, the environmental determinants that make a difference in improving performance levels (12–14). These investigations, however, have not used comprehensive models in which all of the relevant components (including the health condition, capacity levels and personal factors) that influence the final outcome of performance are taken into account. For example, the studies that produced evidence that social deprivation is associated with low rheumatoid arthritis performance outcomes focused only on that factor and did not take into consideration a more “holistic” approach to the care of the rheumatoid patient (14).
The ICF is a classification system that not only provides the concepts and constructs that make possible the conceptualization of the experiences of health as capacity and performance, but also sets out classification categories that operationalize these experiences.
The ICF differentiates 384 activities and participation categories that can be used to describe both the level of capacity and the performance of a person. This is done by means of the so-called ICF qualifiers. For example, the level of a problem in carrying out self-care activities in terms of the intrinsic capacity of the body can be evaluated on a scale from 0 (no problem) to 4 (complete problem). The same 0–4 scale can be used to describe the level of problems in self-care, resulting from the interaction of that intrinsic capacity of the body and the environment and the person, the person’s performance of self-care. While capacity answers the question “Because of your health condition, do you have problems with self-care?”, performance answers the question “Keeping in mind all things that make your health problems easier or worse, is self-care a problem for you?”. For the latter question, an individual may answer “no” because of adaptations of his environment.
Based on these considerations, the ICF may be a useful conceptual and operationalizable framework to augment our understanding of which features of a person’s environment make a difference to their level of performance, when interacting with the person’s capacity. In addition, the granularity that the ICF provides for describing capacity and performance further facilitates our overall understanding of health, both intrinsically and as a lived experience.
The aim of this study is to determine which environmental factors are associated with performance when controlling for capacity, using the ICF to operationalize capacity and performance. Musculoskeletal (MSC) conditions are chosen as a case in point.
METHODS
Study design
This is a psychometric study based on the data of a sample of 296 persons with chronic widespread pain (CWP), low back pain (LBP), osteoarthritis (OA), osteoporosis (OP) and rheumatoid arthritis (RA), collected in a longitudinal survey with 3 time-points of assessment conducted within the European Commission founded project “Measuring Health and Disability in Europe: supporting policy development” (MHADIE) (15). Subjects were recruited from study centres in Italy and Germany. More information about the MHADIE project, including the common medical protocol, is published elsewhere (15). The study protocol and the informed consent forms were approved by the responsible ethics committees in each centre. The inclusion criteria for persons were: that the main diagnosis was 1 of the 5 selected health conditions; the person was at least 18 years old and had sufficient knowledge of the language of their respective country fully to understand all aspects of the study in order to sign the informed consent form. All subjects who agreed to participate signed the informed consent form. In this study, only the data for the first time-point of assessment was used.
Measures
The socio-demographic data record included gender, age, marital status, level of education and current work status. Data on functioning and disability were collected with the ICF Core Sets for each of the 5 health conditions (16–20). ICF Core Sets are lists of ICF categories out of the 1,454 categories of the whole classification that are relevant for specific health conditions. For example, the ICF Core Set for LBP is made up of the 78 ICF categories that are relevant to describe functioning in persons with LBP. The ICF Core Sets have been developed in a structured scientific process, which culminated in a consensus conference. Since ICF Core Sets contain different ICF categories for each health condition, when pooling the data for all health conditions there were ICF categories with a large number of missing data. For this study, we selected those ICF categories that had less than 40% of missing data.
The ICF categories are coded with the letters b (Body Functions), s (Body Structures), d (Activities and Participation (A&P)) and e (Environmental Factors (EF)). The severity of a problem for each b, s and d category was quantified by a qualifier scale with the following gradation: 0 = no problem, 1 = mild problem, 2 = moderate problem, 3 = severe problem, 4 = complete problem. For each of the A&P ICF categories, information on capacity and performance was recorded separately. For the e component, the extent to which the category was a barrier or a facilitator was quantified on a scale from –4 to +4 (similar description to that given above, e.g. mild, moderate), with negative values indicating the extent to which the category was a barrier and positive values a facilitator.
In addition, 8 (“not specified”) was used when a problem or the influence of an EF is present, but the available information was not sufficient to quantify the extent, and 9 (“not applicable”) when a category was not applicable to a particular person (for example, d760 – Family relationships, for a person who has no family) (2).
Data analysis
A descriptive analysis of the study population was carried out.
For this investigation only the ICF categories of the A&P and EF components were taken into account. ICF categories rated as 8 (“not specified”) were very scarce (approximately 1% of the total) and were replaced by the person’s median in other ICF categories. ICF categories with the qualifier 9 (“not applicable”) were treated as missing values. ICF categories with a qualifier value of 0 (“no problem”) in more than 95% of the persons were excluded from further analyses, as they showed too little variation. For EF ICF categories, due to the low frequency values for some response options of barrier or facilitator, we collapsed the response options to –1 = barrier, 0 = no barrier/ no facilitator, and +1 = facilitator.
Two interval measurement scales, one for capacity and one for performance were created with the Rasch model for ordered response options, using the RUMM 2030 software (21). The Capacity Scale (CS) was developed with the A&P ICF categories rated as capacity and the Performance Scale (PS) with the same A&P ICF categories rated as performance. The likelihood ratio test was performed on the output of the initial analyses to identify which version of the polytomous Rasch model (Rating Scale or Partial-Credit) was appropriate (22, 23).
Rasch analysis transforms ordinal scale observations into interval scale measures, the CS and the PS, based on an iterative process in which different steps are repeated until fit of the data to the model is achieved. The following steps were performed for both the CS and the PS. Some of them were repeated, if necessary, based on the criteria stated below. In the context of the Rasch model the word “item” refers to “ICF category”.
Firstly, the Rasch model was fitted to study the structure of response options of the qualifiers. For each item, an increase in qualifier values implies consecutive threshold values, i.e. transitions points between adjacent response options (24). When threshold values were disordered, the response options were collapsed taking into consideration frequency distributions and their probability curves. The Rasch model was recalibrated again to check whether the thresholds displayed the intended increasing order.
Secondly, the presence of local dependency, which negatively affects the model fit, was tested by carrying out principal component analysis (PCA) of the residuals obtained from the Rasch model (25). Items with a residual correlation not within ± 0.3 were considered to display local dependence and combined into a testlet, which is a simple sum score of the locally dependent items (26).
Thirdly, the unidimensionality of both scales was assessed by comparing, using t-tests, the persons’ abilities estimated separately for the items with positive vs negative loadings on the first principal component of the residuals. Unidimensionality is assumed if less than 5% of the t-tests are significant (27).
Fourthly, differential item functioning (DIF) was examined by checking the invariance of the item parameters across health condition groups (CWP, LBP, OA, OP, RA), gender groups (male and female), and age groups (≤ 59 and > 59 years). Items demonstrating DIF (significant analysis of variance (ANOVA) based on an overall significance level of 0.01 and Bonferroni correction) were split into specific questions for each of the groups showing DIF. The exact procedure of splitting has been explained in detail elsewhere (28).
Fifthly, the data fit to Rasch model expectations was tested by checking a number of fit statistics provided by RUMM2030. The item and person fit to the model were checked with the 2-item-person interaction statistics transformed to a Z-score, where a mean of approximately zero and 1 standard deviation (SD) indicated perfect fit. The overall property of invariance of the items across the trait (in our case capacity and performance, respectively) was checked by the overall χ2 of the items. In addition, the individual item fit was examined by checking the standardized residuals (z-values) and χ2 test results. Items with z-values exceeding ± 2.5 or individual item χ2 probability values significant at the overall significance level of 0.01 (and Bonferroni correction for the number of items) indicate misfit to the Rasch model. Therefore they were deleted and the model recalibrated until there was no concern of the fitting to the Rasch model (23, 24).
Sixthly, the targeting of the scales to the sample was studied by comparing the distribution of the persons’ location to that of the items.
Seventhly, the reliability was studied with the person separation index (PSI) from the Rasch analysis. Usually a reliability of 0.70 is required for analysis at the group level, and values of 0.85 and higher for individual use (24, 29).
To be able to intuitively interpret the capacity and performance scores that are obtained from the Rasch scales, we transformed the resulting scores into more meaningful values, ranging from 0 (low capacity and performance) to 100 (high capacity and performance) (30).
To identify the EF associated with the person’s performance, group lasso regression modified by Gertheiss & Tuzt (31) was applied, using R 2.13.2 software (32). Gender, age, health condition and capacity score were forced to remain in the model, while relevant EF ICF categories were simultaneously selected. Group lasso is an extension of lasso regression, which provides higher accuracy of parameter estimation and prediction in analysing ICF-based data sets compared with other regression techniques (e.g. lasso, least angle regression). This is due to its properties to: (i) select (or not select) categorical independent variables (e.g. ICF categories) as a whole, by including (or excluding) all regression coefficients related to that variable, (ii) select the best variable from a group of highly correlated explanatory variables, thus avoiding problems with multicollinearity; and (iii) take the ordinal structure into account via a difference penalty on the adjacent dummy coefficients. The optimal penalty was determined by 5-fold cross-validation. Based on group lasso all independent variables selected can be considered relevant. However, in contrast to other regression methods, their regression coefficients are provided without information on their significance. To obtain confidence intervals for the regression coefficients, 1,000 bootstrap samples (i.e. random samples with replacement and of the same size as the original data-set) were drawn from the original data and each of them were analysed with group lasso. For each independent variable its mean regression coefficient (across the 1,000 bootstrap samples) was obtained together with its pointwise 90% confidence interval (31). The larger the absolute value of the mean regression coefficient, the stronger is the relationship. A confidence interval not containing 0 indicates a significant effect. As group lasso cannot deal with missing values, in each bootstrap sample missing values were imputed by assuming a latent multivariate normal distribution for the EF (33).
A 90% confidence interval was used because we wanted to detect potentially relevant associations. As bootstrapping and imputation of missing values introduce additional “noise” in the estimation, it is advisable to be less strict in identifying possible associations.
RESULTS
A summary of demographic information is shown in Table I. Almost 80% of the persons were female and the mean age was 59 years.
|
Table I. Demographic characteristics of study participants (n = 296) |
||
|
|
n |
%a or mean (SE) |
|
Sex, female |
234 |
79.1 |
|
Age, years (mean) |
296 |
59.0 (0.8) |
|
Marital status |
|
|
|
Never married |
29 |
9.8 |
|
Married/cohabiting |
181 |
61.1 |
|
Separated/divorced |
33 |
11.2 |
|
Widowed |
38 |
12.8 |
|
Highest level of education |
|
|
|
Less than primary school |
5 |
1.7 |
|
Primary school |
101 |
34.1 |
|
Secondary school |
80 |
27.1 |
|
High school (or equivalent) |
47 |
15.9 |
|
College/university/postgraduate |
55 |
18.5 |
|
Years of school (mean) |
295 |
12.3 (0.2) |
|
Current job |
|
|
|
Employee |
66 |
22.3 |
|
Self-employed |
12 |
4.1 |
|
Employer |
18 |
6.1 |
|
Not working for pay |
198 |
66.7 |
|
Health condition |
||
|
Chronic widespread pain |
49 |
16.5 |
|
Low back pain |
118 |
39.9 |
|
Osteoarthritis |
19 |
6.4 |
|
Osteoporosis |
86 |
29.1 |
|
Rheumatoid arthritis |
24 |
8.1 |
|
aValues are percentages except where the mean is indicated. SE: standard error. |
||
For CS and PS, 22 A&P ICF categories were used. After fitting the data to the Partial-Credit Rasch model, most of the items of both scales displayed disordered thresholds, making it necessary to collapse some of the 5 response options. The collapsing strategy for each item is shown in Table II.
|
Table II. Level of difficulty and applied collapsing strategy of Activity and Participation (A&P) items fitting the Rasch model, together with the overall fit statistics for both Capacity and Performance Scale |
|||||||||||||
|
A&P item |
Capacity Scale |
Performance Scale |
|||||||||||
|
Loc |
SE |
FR |
χ2 |
p-value |
CS |
Loc |
SE |
FR |
χ2 |
p-value |
CS |
||
|
d410 Changing basic body position |
–0.622 |
0.081 |
0.476 |
2.541 |
0.637 |
0–1–2–3–4 |
–1.479 |
0.145 |
0.535 |
1.029 |
0.905 |
0–1–1–2–2 |
|
|
d415 Maintaining a body position |
–0.788 |
0.085 |
–0.828 |
6.819 |
0.145 |
0–1–2–3–4 |
–1.796 |
0.159 |
0.197 |
3.967 |
0.410 |
0–1–1–2–2 |
|
|
d430 Lifting and carrying objects |
–1.384 |
0.082 |
–2.128 |
4.341 |
0.361 |
0–1–2–3–4 |
–1.985 |
0.092 |
–0.903 |
6.688 |
0.153 |
0–1–2–3–4 |
|
|
d445 Hand and arm use (LBP&OA)a |
× |
× |
× |
× |
× |
2.889 |
0.297 |
1.131 |
15.357 |
0.004 |
0–1–1–2–2 |
||
|
d445 Hand and arm use (OP)a |
× |
× |
× |
× |
× |
2.162 |
0.361 |
0.409 |
5.925 |
0.204 |
0–1–1–2–2 |
||
|
d445 Hand and arm use (RA)a |
× |
× |
× |
× |
× |
–2.039 |
0.485 |
–0.855 |
1.902 |
0.753 |
0–1–1–2–2 |
||
|
d450 Walking |
–0.922 |
0.109 |
–1.726 |
10.936 |
0.027 |
0–1–1–2–2 |
–0.913 |
0.096 |
–0.778 |
4.583 |
0.332 |
0–1–2–3–4 |
|
|
d455 Moving aroundb |
–1.840 |
0.107 |
2.442 |
10.481 |
0.033 |
0–1–1–2–2 |
× |
× |
× |
× |
× |
||
|
d465 Moving around using equipmentb |
× |
× |
× |
× |
× |
||||||||
|
d470 Using transportation |
0.569 |
0.135 |
–0.416 |
4.772 |
0.311 |
0–1–1–2–2 |
–0.182 |
0.165 |
–0.128 |
6.588 |
0.159 |
0–1–1–2–2 |
|
|
d475 Driving |
× |
× |
× |
× |
× |
× |
× |
× |
× |
× |
|||
|
Testlet1: d510 Washing oneself and d540 Dressing |
–0.463 |
0.078 |
–0.912 |
3.847 |
0.427 |
0–1–1–2–2–3–3–4–4 |
0.710 |
0.069 |
–1.090 |
5.293 |
0.258 |
0–1–2–3–4–5–6–7–8 |
|
|
d530 Toileting |
1.161 |
0.177 |
–0.561 |
2.645 |
0.618 |
0–1–1–2–2 |
3.267 |
0.237 |
–1.321 |
6.511 |
0.164 |
0–1–1–2–2 |
|
|
d570 Looking after one’s health |
0.842 |
0.148 |
0.190 |
3.464 |
0.483 |
0–1–1–2–2 |
0.199 |
0.184 |
–0.574 |
3.421 |
0.489 |
0–1–1–2–2 |
|
|
d620 Acquisition of goods and services |
–0.174 |
0.081 |
–0.311 |
2.793 |
0.593 |
0–1–2–3–4 |
× |
× |
× |
× |
× |
||
|
d630 Preparing meals |
0.940 |
0.147 |
–0.815 |
8.076 |
0.088 |
0–1–1–2–2 |
2.802 |
0.183 |
–0.948 |
1.748 |
0.781 |
0–1–1–2–2 |
|
|
d640 Doing housework |
–0.512 |
0.081 |
–0.960 |
3.799 |
0.433 |
0–1–2–3–4 |
–1.012 |
0.148 |
–0.722 |
10.555 |
0.032 |
0–1–1–2–2 |
|
|
d660 Assisting others |
0.126 |
0.134 |
0.665 |
7.529 |
0.110 |
0–1–1–2–2 |
–1.030 |
0.109 |
–0.196 |
4.376 |
0.357 |
0–1–2–3–4 |
|
|
d710 Basic interpersonal interactions |
4.658 |
0.239 |
–0.107 |
1.697 |
0.791 |
0–1–1–1–1 |
3.111 |
0.265 |
0.562 |
3.995 |
0.406 |
0–1–1–2–2 |
|
|
Testlet2: d760 Family relationships and d770 Intimate relationships |
× |
× |
× |
× |
× |
–1.185 |
0.101 |
0.788 |
3.904 |
0.419 |
0–1–1–2–2–3–3–4–4 |
||
|
d910 Community life |
–0.183 |
0.123 |
–1.671 |
6.486 |
0.165 |
0–1–1–2–2 |
–1.614 |
0.125 |
–0.368 |
3.289 |
0.510 |
0–1–1–2–2 |
|
|
d920 Recreation and leisure |
–1.407 |
0.101 |
–1.256 |
8.797 |
0.066 |
0–1–1–2–2 |
–1.906 |
0.079 |
0.921 |
4.179 |
0.382 |
0–1–2–3–4 |
|
|
ano available data for CWP; bPerformance Scale: Testlet3: d455 Moving around and d465 Moving around using equipment. Collapsing strategy (CS) applied in case of disordered thresholds (0–1–2–3–4: 0: no difficulty, 1: mild difficulty, 2: moderate difficulty, 3: severe difficulty, 4: complete difficulty), 0–1–1–2–2: 0: no difficulty, 1: mild/moderate difficulty (collapsing across mild and moderate difficulty), 2: severe/complete difficulty (collapsing across severe and complete difficulty). Loc: item difficulty expressed in logits; SE: standard error of measurement; FR: fit residual; ×: excluded because of misfit. |
|||||||||||||
Two testlets for the CS (testlet1: d510 and d540; testlet2: d760 and d770) and 3 testlets for the PS (testlet1: d510 and d540; testlet2: d760 and d770; testlet3: d455 and d465) were created to address the local dependency that these items presented.
The items d445, d465 and d475 and testlet2 (d760 and d770) in the CS as well as item d620 and testlet3 (d455 and d465) in the PS, had significant χ2 probability values and were removed from the analysis. One item (d475) in the PS had a very high positive fit residual value, which suggested misfit, and was removed.
Unidimensionality was confirmed in both the CS and PS, since no significant difference in persons’ abilities between the subset of highly positively loading and the subset of highly negatively loading items from the first residual principal component was found (CS with 4.73% and PS with 2.70% of t-tests significant).
For PS, 1 item (d445) showed uniform DIF by health condition. All CS items and PS items were free of DIF by gender and age.
The results of the final calibration of 16 items for CS and 18 items for PS, along with their scoring structure, are shown in Table II. For CS, the overall fit statistic (item-trait interaction) was χ2df=96=89.022, p = 0.021, and a Z-fit statistic of Zmean=–0.495 (ZSD=1.105) for items and Zmean=–0.247 (ZSD=0.96) for persons, and a reliability of 0.889 based on the PSI was obtained. For PS the overall fit statistic was χ2df=72=93.31, p = 0.046, and a Z-fit statistic of Zmean=–0.186 (ZSD=0.765) for items and Zmean=–0.216 (ZSD=0.896) for persons, and a PSI of 0.784 was obtained.
Targeting of the patients in relation to the items for each scale is shown in Fig. 1. When comparing the distribution of item thresholds with the persons’ ability, both CS and PC items do not discriminate well between persons with a very low level of difficulties.
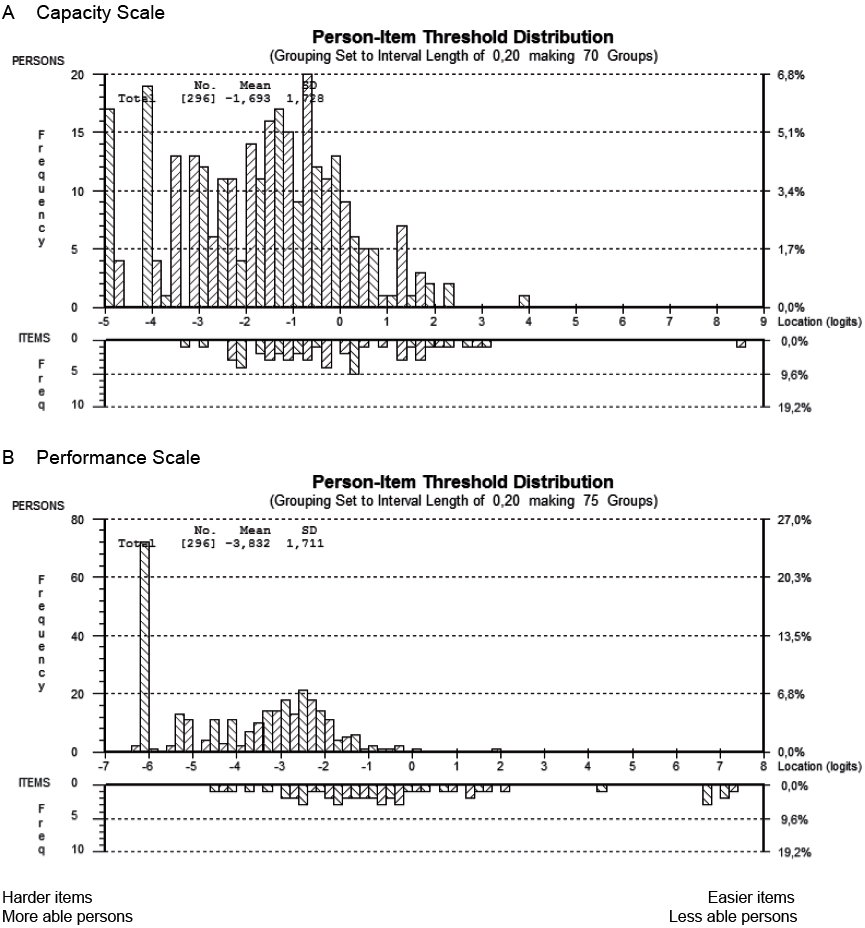
Fig. 1. Person–item location distributions for (A) capacity scale and (B) performance scale. SD: standard deviation.
On a scale from 0 to 100, the capacity mean was 65.88 (minimum = 6.83 and maximum = 100) and the performance mean was 75.21 (minimum = 18.59 and maximum = 100). The capacity scores and performance scores are not comparable because, even though they are identical in name, they are conceptually very different and address 2 separate dimensions.
Tables III and IV contain the results from group lasso analyses, with Table III containing those for the EF, while Table IV contains those for the control variables. Both tables present the means of the regression coefficients over the 1,000 bootstrap samples and their 90% (percentile) confidence intervals. The regression coefficients of the significant EF are shown in Table III. Their values quantify the difference in performance between persons who rated EF as a barrier or as a facilitator and persons who rated EF as no barrier/no facilitator (reference category).
|
Table III. Results from group lasso: regression coefficients for those environmental factors (EF) International Classification of Functioning, Disability and Health (ICF) categories for which at least 1 regression coefficient for the dummy-coded response options, i.e. the ICF qualifiers, is significantly different from 0 with regard to the pointwise 90% confidence interval, when controlling for capacity score, gender, age and health condition. For each independent variable the mean over the 1,000 bootstrap regression coefficients and its pointwise 90% confidence interval is provided |
|||||
|
Variable EF ICF categorya,b |
EF coded as barrier |
EF coded as facilitator |
|||
|
Mean regression coefficient |
90% confidence interval |
Mean regression coefficient |
90% confidence interval |
||
|
e110 Products or substances for personal consumption |
–4.432 |
–8.007 to –0.812 |
0.024 |
–1.253 to 1.210 |
|
|
e120 Products and technology for personal indoor and outdoor mobility and transportation |
–1.386 |
–3.433 to 0.100 |
–2.248 |
–3.717 to –0.816 |
|
|
e155 Design, construction and building products and technology of buildings for private use |
–1.982 |
–3.658 to –0.290 |
1.504 |
+0 to 3.249 |
|
|
e225 Climate |
0.218 |
–0.811 to 1.396 |
–1.289 |
–3.013 to –0 |
|
|
e310 Immediate family |
0.465 |
–0.931 to 2.355 |
1.660 |
+0 to 3.365 |
|
|
e325 Acquaintances, peers, colleagues, neighbours and community members |
–1.501 |
–3.413 to –0 |
–0.850 |
–2.376 to 0.112 |
|
|
e340 Personal care providers and personal assistants |
0.448 |
–0.180 to 1.707 |
1.366 |
+0 to 2.657 |
|
|
e355 Health professionals |
–1.140 |
–2.857 to 0.082 |
–2.790 |
–4.981 to –0.666 |
|
|
e410 Individual attitudes of immediate family members |
–4.734 |
–7.723 to –1.739 |
–1.699 |
–3.582 to –0.041 |
|
|
e425 Individual attitudes of acquaintances, peers, colleagues, neighbours and community members |
–0.877 |
–2.218 to –0 |
–0.456 |
–1.588 to 0.322 |
|
|
e450 Individual attitudes of health professionals |
–1.236 |
–2.798 to –0 |
–0.532 |
–2.033 to 0.472 |
|
|
e460 Societal attitudes |
0.420 |
–0.209 to 1.644 |
0.904 |
+0 to 2.584 |
|
|
e580 Health services, systems and policies |
–1.265 |
–3.292 to –0 |
|
–0.574 |
–2.283 to 0.611 |
|
Significant predictors are shown in bold; +0 very small positive value; –0 very small negative value. aThe reference value is no barrier/no facilitator. bThe coefficients of the following 13 EF ICF categories were not significantly different from 0 and are therefore not included in the table: e115 Products and technology for personal use in daily living; e135 Products and technology for employment; e150 Design, construction and building products and technology of buildings for public use; e240 Light; e320 Friends; e360 Other professionals; e420 Individual attitudes of friends; e455 Individual attitudes of health-related professionals; e465 Social norms, practices and ideologies; e540 Transportation services, systems and policies; e550 Legal services, systems and policies; e570 Social security services, systems and policies; e575 General social support services, systems and policies. |
|||||
For example, since the regression coefficient of e355 Health professionals is negative for the persons who rated it as a facilitator, they will have a lower performance score than persons who rated it as no barrier/no facilitator.
Table IV showed that there was a strong positive effect of capacity on performance. Health condition, gender and age did not show a significant effect on the 90% confidence level.
|
Table IV. Results from group lasso: regression coefficients for non environmental factors (EF) International Classification of Functioning, Disability and Health (ICF) categories controlled for in group lasso analyses. For each independent variable the mean over the 1,000 bootstrap regression coefficients and its pointwise 90% confidence interval is provided |
|||
|
Variable: non-EF ICF categories |
Value |
Mean regression coefficient |
90% confidence interval |
|
Intercept |
30.941 |
25.249 to 36.454 |
|
|
Capacity score |
0.704 |
0.657 to 0.753 |
|
|
Health condition |
CWP |
0 |
0 to 0 |
|
LBP |
0.596 |
–1.532 to 2.803 |
|
|
OA |
0.201 |
–2.788 to 3.217 |
|
|
OP |
–0.068 |
–2.230 to 2.027 |
|
|
RA |
–1.951 |
–4.500 to 0.674 |
|
|
Gender |
Female |
0 |
0 to 0 |
|
Male |
–0.911 |
–2.495 to 0.649 |
|
|
Age |
0.038 |
–0.010 to 0.084 |
|
|
EF and control variables (capacity score, age, gender and health conditions) explained 87% of the variance of the performance score (the percentage of variance explained was calculated via R2 statistic for the model). Significant predictors are shown in bold. CWP: chronic widespread pain; LBP: low back pain; OA: osteoarthritis; OP: osteoporosis; RA: rheumatoid arthritis. |
|||
DISCUSSION
In this investigation, we propose an approach for identifying the environmental factors associated with performance when controlling for persons’ capacity. Based on this approach we identified 13 EF ICF categories that were significantly associated with performance. They cover all aspects of the environment, including the physical, social, attitudinal and political environment. The results of our study also showed that the ICF is useful for understanding and measuring both capacity and performance.
Rasch modelling of the ordinal data was used for assessing the levels of capacity and performance. Our study is a major step forward in developing capacity and performance measures compared with a previous study, in which the development of a CS and PS using similar data and classical test theory (CTT) was pursued (34). Rasch modelling is an attractive approach for transforming ordinal data to interval-scaled data and, thus, for avoiding 2 problems with the use of summed scores in statistical analysis, such as regression analysis, namely, non-normality and “incoherence” between the test score scale and the latent trait scale (35). Moreover, item parameter estimates based on the Rasch model are consistent and stable across different samples. Thus, the capacity and performance scores obtained in this investigation are suitable for studying the association between performance and EF (36, 37).
We included the capacity score, age, gender and the health condition in the regression model, to control for internal influences in addition to the influences of the external environment. The results of group lasso regression showed that capacity is highly associated with performance, which is common sense, and this has also been confirmed in another study (38). When both capacity and performance are measured, we highly recommend controlling for capacity when aiming to quantify the association of the person’s performance with other factors. This has not always been the common practice in the past (39, 40). We have also carried out the analyses without including capacity (results available from the authors on request) and the results show that, even though the EF selected remain the same, their importance is overestimated. In addition, the amount of variance explained by the model is approximately 20% less. This paper presents an approach on how to create separate measures for these 2 highly related variables, so that both of them can be included in the same model.
All EF identified in this study were also considered highly relevant by clinicians when ranking the level of importance of EF in the consensus conferences that took place as part of the development of the respective ICF Core Sets (16–20). Weigl et al. (7) confirmed the relevance of the same EF based on existing literature, but emphasized that additional evidence is needed, since they did not draw their conclusions based on statistical significance. This investigation represents a contribution of required evidence. However, since we only used cross-sectional data, we cannot say whether changes in EF produce changes in performance (causal relationship). To obtain this information, future studies with longitudinal data are needed. In our study, when an EF had a positive parameter it indicates that individuals who considered this EF as barrier (or facilitator) would have, on average, higher levels of performance than those who considered it as no barrier/no facilitator. It may be possible that severe patients with satisfactory environmental accommodation (facilitator) have worse performance than those without accommodation (no barrier/no facilitator) only because the latter have better health and do not require environmental accommodation.
Study limitations
This study has some limitations. Firstly, the overall sample sizes in each MCS condition were small. To obtain more precise item locations and person abilities within 0.5 logits, a larger sample size (at least 20 times the number of items) should be used in future replications of this study. Secondly, our cut-off point for missing data (< 40%) is high. Although RUMM 2030 accounts for missing data in capacity and performance items, and imputation is an efficient statistical solution for replacing the missing values in EF items, our results need to be validated with samples without missing data. Thirdly, some items had to be deleted. However, the inclusion of deleted items would not affect the unidimensionality of the final CS and PS. This was confirmed by the bifactor analyses carried out a posteriori with all items (also including those deleted from the analyses), with all items loading highly on the general factor. Finally, there are results that are difficult to interpret. For example, while e310 Immediate family when rated as facilitator is positively associated with performance, e410 Individual attitudes of immediate family members is negatively associated. Even though this result is theoretically plausible, actual support provided and attitudes usually go together. Further research is needed to investigate this result.
Conclusion
This study proposes a method to overcome the challenge of controlling for capacity when explaining performance. Thirteen EF highly related to performance were identified. Even though this investigation was primarily methodological, the results should be considered as a starting point for studying whether there is a causal relation between performance and the EF associated with performance. The more we know about the impact of a person’s environment on their level of performance, the more we can accurately and effectively target our interventions to these factors, as well as to the underlying health condition.
ACKNOWLEDGEMENTS
The authors would like to thank Johana Jonsdottir, Giovanni Rainero and Vittorio Racca from the Rehabilitative Neurology Department, IRCCS “Santa Maria Nascente” Fondazione Don Gnocchi, Milan, Italy and Andrea Gläßel from the Institute for Health and Rehabilitation Sciences at the Ludwig-Maximilians-University for performing the data collection in this study. The authors also thank Susanne Schwarzkopf, Andreas Winkelmann and the whole team of the Clinic for Physical Medicine and Rehabilitation at the Ludwig-Maximilians-University, Munich, for their support during data collection. Finally, especial thanks go to all the patients participating in the study.
REFERENCES

