Jan W. van der Scheer, MSc1, Sonja de Groot, PhD1,2, Marga Tepper, MD3, David Gobets, MD4, DirkJan H. E. J. Veeger, PhD5,6, ALLRISC group* and Lucas H. V. van der Woude, PhD1,3
From the 1University of Groningen, University Medical Center Groningen, Center for Human Movement Sciences, Groningen, 2Amsterdam Rehabilitation Research Center | Reade, Amsterdam, 3University of Groningen, University Medical Center Groningen, Center for Rehabilitation, Department of Rehabilitation Medicine, Groningen,4Heliomare, Rehabilitation Center, Wijk aan Zee, 5Research Institute MOVE, Faculty of Human Movement Sciences, VU University, Amsterdam and 6Department of Mechanical, Maritime and Materials Engineering, Delft University of Technology, Delft, The Netherlands
*ALLRISC group name is provided at the end of the article.
OBJECTIVES: To describe wheelchair-specific anaerobic work capacity, isometric strength and peak aerobic work capacity of physically inactive people with long-term spinal cord injury using outcomes of tests that are feasible for use in rehabilitation centres, and to determine associations among these fitness components.
DESIGN: Cross-sectional study.
PARTICIPANTS: Manual wheelchair users with spinal cord injury for at least 10 years, who were inactive based on a norm score of a physical activity questionnaire (n = 29; 22 men; 20 with paraplegia; median age 53 years).
METHODS: Participants performed 3 exercise tests in their own wheelchair to determine: highest 5-s power output over 15-m overground sprinting (P5–15m); highest 3-s isometric push-force (Fiso); and peak power output (POpeak) and peak oxygen uptake (VO2peak) over a peak test.
RESULTS: Median (interquartile range) was in P5–15m 16.1 W (9.4–20.9); in Fiso 399 N (284–610); in POpeak 40.9 W (19.1–54.9); and in VO2peak 1.26 l/min (0.80–1.67). Correlations among outcomes of fitness components were weak (r = 0.50–0.67, p < 0.01), except for P5–15m with POpeak (r = 0.79, p < 0.001).
CONCLUSION: All fitness components measured in this sample were at relatively low levels, implying a specific need for interventions to improve wheelchair-specific fitness. The weak-to-moderate associations among components imply that separate tests should be used when monitoring wheelchair-specific fitness in rehabilitation centres.
Key words: paraplegia; physical fitness; tetraplegia; wheelchairs; work power; aerobic capacity; mechanical efficiency; anaerobic power; isometric strength.
J Rehabil Med 2015; 47: 00–00
Correspondence address: Jan W. van der Scheer, Center for Human Movement Sciences, University Medical Center Groningen, sector F; PO Box 196, NL-9700 AD, Groningen, The Netherlands. E-mail: j.w.van.der.scheer@umcg.nl
Accepted Oct 22, 2014; Epub ahead of print Jan 16, 2015
Introduction
The maintenance of wheelchair-specific fitness is considered important for many people with spinal cord injury (SCI), as most depend on a manual wheelchair in daily life (an estimated 81% in the Netherlands) (1, 2). Wheelchair-specific fitness, defined as physical fitness measured during manual wheelchair propulsion tests, has a positive association with health, participation and quality of life of people with SCI (3–5). Physically inactive people with long-term SCI are a group that is specifically expected to suffer from low wheelchair-specific fitness (6). This group not only has an inactive lifestyle that has been associated with lower wheelchair-specific fitness (7), but also has a relatively high incidence of secondary health complications that can lead to reduced wheelchair-specific fitness (8–10).
Descriptions of wheelchair-specific fitness of inactive people with long-term SCI are limited (11–13). A detailed description of wheelchair-specific fitness should include anaerobic work capacity, isometric strength, and peak aerobic work capacity, as these fitness components are assumed to reflect the capacity needed in essential wheelchair activities such as propelling a long distance, propulsion over uneven surfaces, and ascending a ramp (14). Such a description is not yet available for inactive people with long-term SCI using outcomes of tests feasible for use in rehabilitation centres. Feasible tests are a prerequisite for systematic fitness monitoring in rehabilitation centres, which can support maintenance of fitness (1, 15).
Furthermore, it is not clear if and how wheelchair-specific fitness components are associated in inactive people with long-term SCI performing tests that are feasible for use in rehabilitation centres. If the outcomes of different components are strongly associated, it implies that separate tests for each component are not necessary, since an outcome of 1 component could be used to predict another, which may reduce measurement burden (16–18). Furthermore, strong associations may also imply that different exercise forms can improve various wheelchair-specific fitness components of inactive people with long-term SCI; for example, strength exercise improving peak aerobic work capacity or endurance exercise improving isometric strength (16, 17, 19). Strong associations among wheelchair-specific anaerobic work capacity, isometric strength and peak aerobic work capacity have already been found in a group with long-term SCI (r = 0.81–0.90), but in this study laboratory-based wheelchair ergometer tests were used (16).
The aims of this cross-sectional study were i) to describe levels of wheelchair-specific anaerobic work capacity, isometric strength and peak aerobic work capacity of a group of physically inactive people with long-term SCI using outcomes of tests that are feasible for use in rehabilitation centers; and ii) determining associations among the group’s fitness components. Our hypotheses were to find i) relatively low fitness levels when compared to previous studies in people with SCI such as those on lab-based tests (13, 20, 21); and ii) strong associations among components similar to those found using lab-based tests (16).
Methods
Participants, procedures and outcomes in this cross-sectional study were part of baseline measurements in a multi-centre randomized controlled trial (RCT) on low-intensity wheelchair exercise (22).
Participants
Participants were physically inactive people with a long-term SCI who were community-dwelling manual wheelchair users (Table I). Long-term SCI was defined by a time since injury > 10 years, while physical inactivity was defined by a score on the Physical Activity Scale for Individuals with Physical Disabilities (PASIPD) < 75th percentile of a Dutch cohort with SCI (23). Participants were included after providing voluntary agreement, written informed consent and eligibility screening (22). Exclusion criteria comprised: cardiovascular contraindications (for example systolic blood pressure > 180 mmHg and metabolic conditions such as uncontrolled diabetes and thyrotoxicosis); musculoskeletal complaints contraindicating manual wheelchair propulsion; mental contraindications; and insufficient mastery of Dutch language (22, 24). The study was approved by the medical ethical committee of the VU University Medical Center (Amsterdam, The Netherlands) and the 2 participating rehabilitation centres.
|
Table I. Participants’ characteristics |
||||
|
Total N |
Para n |
Tetra n |
Para vs Tetra p |
|
|
Group size |
29 |
20 |
9 |
|
|
Men/women |
22/7 |
15/5 |
7/2 |
1.00 |
|
Complete/incompletea |
20/9 |
15/5 |
5/4 |
0.40 |
|
AIS A/B/C/D |
17/3/7/2 |
14/1/4/1 |
3/2/3/1 |
N.A. |
|
C4–6/C7–8/Th1–9/Th10–L5 |
5/4/13/7 |
0/0/13/7 |
5/4/0/0 |
N.A. |
|
Married or partner/single |
18/11 |
12/8 |
6/3 |
1.00 |
|
Cohabiting/not cohabiting |
19/10 |
13/7 |
6/3 |
1.00 |
|
Employed/not employed |
20/9 |
13/7 |
7/2 |
0.68 |
|
Low/medium/high education level |
14/13/2 |
9/10/1 |
5/3/1 |
N.A. |
|
Help in daily-self care/no helpb |
17/12 |
9/11 |
8/1 |
0.04 |
|
Help in household/no helpb |
25/4 |
18/2 |
7/2 |
0.57 |
|
Median (IQR) |
Median (IQR) |
Median (IQR) |
||
|
Age, years |
57 (45–63) |
54 (44–61) |
63 (43–65) |
0.30 |
|
Height, m |
1.80 (1.69–1.86) |
1.79 (1.69–1.85) |
1.80 (1.65–1.93) |
0.80 |
|
Body mass, kg |
88 (78–100) |
89 (82–102) |
82 (74–99) |
0.37 |
|
BMI, kg/m2 |
28 (25–32) |
28 (25–33) |
27 (17–38) |
0.56 |
|
Time since injury, years |
17 (14–29) |
18 (14–28) |
14 (13–33) |
0.80 |
|
Age at onset SCI, years |
30 (23–44) |
30 (22–43) |
30 (25–49) |
0.69 |
|
PASIPD, MET h/weekc |
8.0 (4.2–14.6) |
9.2 (6.9–15.2) |
4.7 (1.6–12.9) |
0.15 |
|
Statistical comparison based on Fisher’s tests and Mann-Whitney U tests (p < 0.05). aPara defined as lesion < Th1; Complete defined as motor complete lesion (39). bHelp from partner and/or healthcare professional. cPASIPD < 30 used as the criterion for being physically inactive (22); missing in n = 2 (paraplegia: n = 1). AIS: American Spinal Injury Association Impairment Scale (39); BMI: body mass index; SCI: spinal cord injury; MET: metabolic equivalent; PASIPD: Physical Activity Scale for Individuals with Physical Disabilities (23); Para: paraplegia; Tetra: tetraplegia; IQR: interquartile range; N.A.: Fisher’s tests not applicable. |
||||
Procedures and outcomes
On a single day in a standardized procedure (22), participants performed 3 exercise tests in their own wheelchair: a 15-m overground sprint test with an instrumented wheel; an isometric-push test; and a graded peak exercise test on a treadmill. These tests were used to assess wheelchair-specific anaerobic work capacity, isometric strength, and peak aerobic work capacity, respectively.
Anaerobic work capacity (15-m test). Anaerobic work capacity was determined in a 15-m overground sprint test in the participants’ own wheelchairs, similar to a protocol in a pilot study on able-bodied people (25). This protocol was based on a 15-m sprint test used in previous SCI cohort studies as part of a wheelchair skill test battery (5, 26). The right rear wheel of the participant’s wheelchair was replaced with an instrumented wheel that sampled 3-dimensional forces and moments applied to the handrim throughout the test at 200 Hz (OptiPush, MAX Mobility, Antioch, USA). The left wheel was replaced with an inertia-compensated wheel. Total weight of the wheels was 11.4 kg.
The outcome was the highest mean unilateral power output over successive 5-s intervals of the 15-m test (P5–15m) (25). Concurrent validity of P5–15m was seen as acceptable given its strong association with outcomes on a Wingate-like test on a wheelchair ergometer found in a pilot study (r = 0.75–0.77) (25).
Isometric strength (isometric-push test). Isometric strength was determined using a protocol in which participants performed a maximal isometric contraction for 5 s with their hands on top of their handrims, while their wheelchair with regular wheels was attached via a rope and a force transducer to a wall (22, 27). The set-up is shown in Fig. 1. During the test, an investigator held the front castors of the wheelchair on the floor. The participant performed 3–5 trials of the test interspersed with 2-min rest periods between trials.
In data processing, the force was doubled as the transducer was connected to only 1 of the 2 anchor points (Fig. 1). The outcome of the isometric wheelchair push-test was the highest mean consecutive 3-s force interval over 3 successful trials (Fiso, a bilateral force outcome), similar to a wheelchair ergometer test (13).
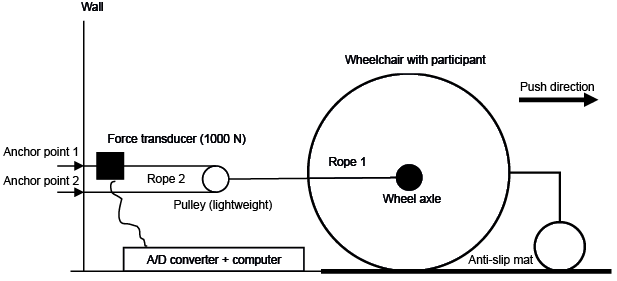
Fig. 1. Set-up of the isometric wheelchair push-test (see (22) for a photograph). The participant’s wheelchair was blocked by attaching it, via a system of ropes and a pulley, to a one-dimensional strain gauge transducer. A computer received the signal of the strain gauge transducer so that force could be determined at 100 Hz.
Peak aerobic work capacity (peak exercise test). Peak aerobic work capacity was determined with a protocol similar to that used in previous SCI cohort studies on people with SCI (26, 28). The protocol consisted of: familiarizing the participant with treadmill propulsion including determination of treadmill velocity during the tests, that is < 0.56, 0.56, 0.83 or 1.11 m/s; a drag test to determine a participant’s power output at each inclination angle of the treadmill; 2 blocks of 3 min of submaximal treadmill propulsion; and an incremental exercise test in which the inclination angle of the treadmill increased every minute by about 0.3° until the participant could no longer maintain treadmill velocity (26).
Outcomes were mean power output over the last 30 s of the test (POpeak) and the highest mean 30-s oxygen uptake over the test (VO2peak). As a reference for peak performance, the highest 30-s respiratory exchange ratio over the test was determined, in addition to assessing the rate of perceived exertion immediately after the test (scale of 0–10) (29).
Statistical analysis
Descriptive statistics were determined over the total group as well as subgroups with paraplegia and tetraplegia for all participant characteristics and outcomes. All data of the total group was normally distributed based on tests for skewness and kurtosis (p < 0.10), in contrast to data for the subgroups with paraplegia and tetraplegia. For descriptive purposes, participant characteristics and outcomes of the subgroups were compared using Fisher’s tests and Mann-Whitney U tests (p < 0.05).
Over the total group, Pearson’s r was calculated among P5–15m, Fiso, POpeak and VO2peak. High correlations were defined as r ≥ 0.90, moderate as r = 0.70–0.90 and weak as r < 0.70 (30). Significance was set at p < 0.05.
Results
Participants
The majority of the 29 participants were middle-aged and had a complete paraplegia for approximately 17 years. Mean activity scores were as low as 4.7 metabolic equivalents (MET) h × week, while only 2 participants engaged in sports (either 2 h of badminton or 1 h of handcycling). Other demographics and lesion characteristics are described in Table I.
Procedures
Participants used wheelchairs with a rear wheel diameter of 0.61 (n = 21), 0.64 (n = 4) or 0.66 m (n = 4), while all tyre pressures were set at 6 × 10⁵ Pa. All participants used regular handrims, except for 2: a participant with a complete T11 lesion used handrims integrated with the wheel rim, and 1 participant with an incomplete C4 lesion used handrims with rods perpendicular to the handrim.
All participants performed all tests according to protocol, except for the 15-m test (n = 2) and peak test (n = 1). The 15-m test could not be performed by a participant with an incomplete T3 lesion due to the instrumented wheels not fitting the wheelchair axle of the participants’ wheelchair, while the participant with the incomplete C4 lesion was not able to use the instrumented wheels given the need for handrims with rods. A participant with an incomplete C6 lesion preferred to perform the peak test without the mask used to determine VO2peak. In addition, missing data due to technical problems occurred in POpeak (n = 1), P5–15m (n = 4) and Fiso (n = 1). Table II shows the resulting sample sizes.
|
Table II. Description of wheelchair-specific fitness: outcomes over the total group and subgroups with paraplegia and tetraplegia |
||||||||||
|
Total |
Para |
Tetra |
Para vs Tetra |
|||||||
|
Median (IQR) |
n |
|
Median (IQR) |
n |
Median (IQR) |
n |
p |
|||
|
P5–15m, W |
16.1 (9.4–20.9) |
23 |
18.3 (14.5–26.4) |
17 |
8.0 (4.8–15.5) |
6 |
0.02 |
|||
|
Fiso, N |
399 (284–610) |
28 |
525 (334–677) |
19 |
211 (128–375) |
9 |
< 0.001 |
|||
|
POpeak, W |
40.9 (19.1–54.9) |
28 |
51.2 (36.3–59.0) |
19 |
18.7 (8.3–33.1) |
9 |
< 0.001 |
|||
|
VO2peak, l/min |
1.26 (0.80–1.67) |
28 |
1.52 (1.07–1.75) |
20 |
0.68 (0.54–1.07) |
8 |
0.01 |
|||
|
Statistical comparison based on Fisher’s tests and Mann-Whitney U tests (p < 0.05). P5–15m: highest 5-s power output over 15-m overground sprinting (unilateral); Fiso: highest 3-s isometric push-force (bilateral); POpeak: peak power output; VO2peak: peak oxygen uptake; Para: paraplegia; Tetra: tetraplegia; IQR: interquartile range. |
||||||||||
Description of outcomes
In the total group, median P5–15m was 16.1 W, median Fiso 399 N, median POpeak 40.9 W and median VO2peak 1.26 l/min (Table II and Fig. 2). Variance over the group was high for all outcomes (Fig. 2). Although the subgroup with paraplegia had significantly higher outcomes than the subgroup with tetraplegia (Table II), overlap between these subgroups was apparent: some participants with tetraplegia had outcomes equal to or higher than those with paraplegia (Fig. 2).
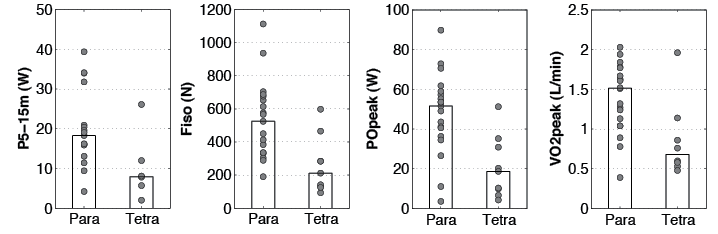
Mean respiratory exchange ratio in the peak test was > 1.00 for the total group (median [interquartile range]: 1.02 [0.91–1.12]), indicating that mean peak aerobic performance was reached. Mean rate of perceived exertion on a 0–10 scale was 6 for the total group (interquartile range 5–9).
Associations among fitness components
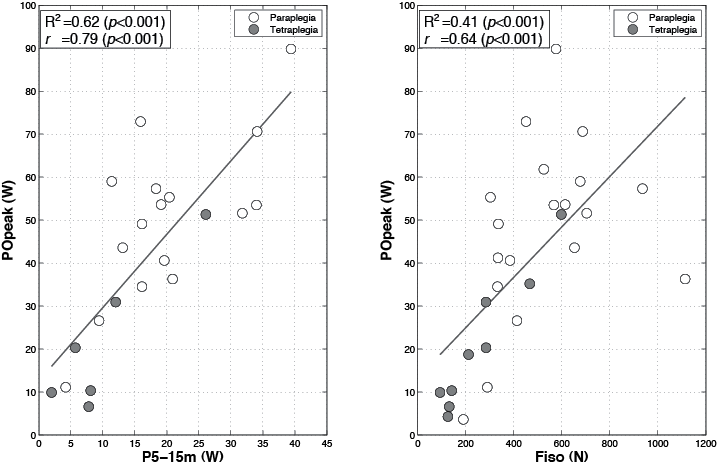
Correlations among outcomes of fitness components were all significant but weak (r = 0.50–0.67, p < 0.01), except for P5–15m with POpeak (r = 0.79, p < 0.001) (Table III, Fig. 3). A moderate-to-high correlation was found within outcomes of the peak exercise test (POpeak with VO2peak: r = 0.89, p < 0.001).
|
Table III. Associations among fitness components: Pearson’s r among outcomes in the total group |
|||||||||||
|
POpeak |
VO2peak |
P5–15m |
|||||||||
|
r |
95% CI of r |
n |
|
r |
95% CI of r |
n |
|
r |
95% CI of r |
n |
|
|
VO2peak |
0.89** |
0.77–0.95 |
27 |
||||||||
|
P5–15m |
0.79** |
0.55–0.91 |
22 |
0.67* |
0.35–0.85 |
22 |
|||||
|
Fiso |
0.64** |
0.35–0.82 |
28 |
0.50* |
0.15–0.74 |
27 |
0.55* |
0.17–0.79 |
22 |
||
|
*p < 0.01, **p < 0.001. POpeak: peak power output; VO2peak: peak oxygen uptake; P5–15m: highest 5-s power output over 15-m overground sprinting; Fiso: highest 3-s isometric push-force; 95% CI: 95% confidence interval. |
|||||||||||
Discussion
The study group had relatively low outcome levels for wheelchair-specific anaerobic work capacity, isometric strength and peak aerobic work capacity, compared with previous studies in people with SCI such as those using laboratory-based tests (13, 20, 21). Variance over the group was high for all outcomes. Weak-to-moderate associations were found among the group’s wheelchair-specific fitness components (r = 0.50–0.79).
Description of wheelchair-specific fitness
Anaerobic work capacity in our study was lower than in studies on more active people with SCI in which a similar 5-s power output outcome was determined in laboratory-based Wingate tests of 20 or 30 s (20, 21). In part, this may be due to a lower resistive load in our overground-sprint test compared with the body-mass standardized load in the Wingate test. Regardless of fitness level, power output outcomes seem to be lower in wheelchair sprint tests with less resistive load (25, 31). P5–15m has only been determined in novice able-bodied people (mean 38.1 W) (25), and was much higher than found in the groups with paraplegia and tetraplegia in our study (approximately 2–4 times, respectively). Lower wheelchair-specific anaerobic work capacity of people with SCI has been associated with higher physical strain during activities of daily living (ADL) (32).
The study group had relatively low wheelchair-specific isometric strength, for example in comparison with a study with normative values based on active as well as inactive people with SCI performing laboratory-based wheelchair ergometer tests (13). The mean Fiso of the subgroups with paraplegia and tetraplegia would be placed in the lower to middle categories of this norm study (13). Isometric strength has been determined in an inactive group with SCI performing laboratory-based wheelchair ergometer testing, and found to be similarly low as in our study (on average 288 N vs 211 N in our study) (11). Reduced wheelchair-specific isometric strength has been associated not only with higher strain in ADL (32), but also with increased upper-body pain (33).
Wheelchair-specific peak aerobic work capacity was also relatively low, as exemplified by the relatively low POpeak in comparison with previous studies on people with SCI using similar outcomes (12, 13, 28, 34). POpeak in the subgroup with paraplegia would be ranked in the lowest category of a study on norm values of fitness of people with SCI including both active as well as inactive people (13). The mean POpeaks in the subgroups with paraplegia (51 W) and tetraplegia (19 W) were approximately 30% lower than the mean POpeak determined in a systematic review of studies on fitness of people with paraplegia (74 W) and tetraplegia (26 W) (12). Such low POpeak values are alarming, as POpeak has been negatively associated with strain during ADL, health, participation and even quality of life (3–5, 32). Furthermore, mean POpeak in our study (41 W) was approximately equal to that of a group of people at the start of inpatient SCI rehabilitation (35 W) (28). That group showed an increase in mean POpeak to 52 W at discharge from inpatient rehabilitation, which was eventually maintained up to 5 years after discharge (56 W) (28). It seems that the people in our study never reached such a level of POpeak or, alternatively, they might not have been able to maintain it over their relatively long SCI-lifespan due to an inactive lifestyle and/or incidence of secondary health complications that can lead to reduced wheelchair-specific fitness (7–10).
An explanation for the group’s highly variable fitness levels might be found in the group’s variance in factors such as age, gender, body mass, physical activity levels, time since injury, lesion level and completeness (13), in addition to factors such as spinal deformities and history of secondary health complications (9). This remains a topic for future study, given the cross-sectional design and relatively small sample size in our study. For example, cross-sectional studies on larger samples of inactive people with long-term SCI can be used to study the participant and lesion characteristics in multiple regression analyses (13). The influence of activity and fitness-impairing secondary complications on fitness in people with long-term SCI can further be investigated using longitudinal designs.
Although a comprehensive review was beyond the scope of this study, it seems that physically inactive people with long-term SCI are a group in the population with SCI with relatively low wheelchair-specific anaerobic work capacity, isometric strength and peak aerobic work capacity. Possible causes for these low levels may lie in their inactive lifestyle and higher incidence of fitness-impairing secondary complications with increasing time since injury (7–10).
Associations among the fitness components
Associations among the group’s wheelchair-specific fitness components were lower than found in a previous study in which people with SCI performed laboratory-based wheelchair ergometer tests (r = 0.81–0.90) (16). A possible explanation for this may be found in differences between our tests and the ergometer tests. For example, the 15-m overground sprint test has been suggested to depend more on skill than the 30-s wheelchair ergometer sprint test, as high handrim velocities may occur in an overground sprint that are prevented in the ergometer test due to a body-mass standardized load (25). The higher dependence on skill in the 15-m test might therefore have resulted in a relatively weak association between anaerobic work capacity and the other fitness components. This skill dependence might also partly explain why associations among the fitness components in our study were lower than found in most previous studies on people with SCI performing non-wheelchair specific fitness tests, such as arm cranking and strength-dynamometry tests (17, 19).
Although associations among the fitness components in the present study were weaker than in previous studies on people with SCI, they do appear to be stronger than what has been found in able-bodied groups (16, 18, 35). In these groups, no or weaker associations were apparent among upper-body and lower-body fitness components of able-bodied people (16, 18, 35). A possible explanation for this difference is that, on a group level, wheelchair users with SCI are more homogenous in their development of upper-body aerobic, lactic and alactic metabolism compared with upper-body and lower-body metabolism of able-bodied people (36). Wheelchair users with SCI always depend on their upper-body in daily life, for example in ADL, such as propelling a long distance (aerobic), ascending a ramp (lactic) and body-weight transfers (alactic) (14, 36). A more homogenous development of aerobic, lactic and alactic metabolism might be specific for disability groups, as relatively strong associations were also found among lower-body fitness components of people with cerebral palsy compared with able-bodied people (18). Another explanation for the difference found in able-bodied people might be the coordination problems and low muscular strength levels in groups with tetraplegia and cerebral palsy (18). Low strength and coordination levels could limit oxygen transport during a peak test due to impediment of local muscle blood flow, leading to a relatively strong association between peak aerobic work capacity and strength (17).
Anthropometrics, such as body mass, have been suggested to influence associations among fitness components (16). Therefore, we checked whether correlations were different among outcomes divided by body mass, and found that correlations were similar to those shown in Table II (e.g. r = 0.83 for POpeak/kg with P5–15m/kg vs r = 0.79 for POpeak with P5–15m). Other possible influences on associations among fitness components require further study in a larger sample, for example on heterogeneity over a group in fitness levels, lesion characteristics and physical activity levels (17, 18, 27).
Implications and limitations
The low fitness levels found in our study imply that physically inactive people with long-term SCI are a group in the population with SCI that is in specific need of interventions to improve wheelchair-specific fitness. Low-intensity wheelchair exercise training may be such an intervention, since it might lead to less dropout and upper-body overuse in a deconditioned group (22). Furthermore, the low fitness levels in our study suggest that rehabilitative aftercare models are needed to prevent low wheelchair-specific fitness in people with long-term SCI (6). Systematic monitoring of wheelchair-specific fitness after inpatient rehabilitation could be part of such a model, since it can support the maintenance of fitness (1). Maintaining wheelchair-specific fitness in people with long-term SCI can help to support health, participation in society and quality of life (3–5, 9). Monitoring can also help to target those in most need of interventions; this need may differ between inactive people with long-term SCI, as indicated by the high variance in fitness in our study.
For systematic monitoring, tests feasible for use in rehabilitation centres are recommended (15), such as the tests used in our study. The relatively weak associations among fitness components imply that separate tests are needed to assess each component when monitoring wheelchair-specific fitness of inactive people with long-term SCI. For example, it does not appear to be possible to predict performance on a peak wheelchair exercise test using the 15-m test or isometric-push test, due to the weak correlations among outcomes of the tests. However, P5–15m can provide a rough estimate of POpeak, which can be used for the purpose of individualizing power output increments in a peak wheelchair exercise test. For example, estimating that an inactive person with long-term SCI needs only small increments in the peak test can help them to reach peak performance, which was difficult for some participants with tetraplegia in our study (mean respiratory exchange ratio of the subgroup with tetraplegia = 0.88). Whether peak performance was reached during the 15-m test and isometric-push remains a topic for future study, as parameters indicating peak performance are not yet available for these tests.
A limitation of our study might be generalization to the inactive population with long-term SCI given the relatively small sample size and possibility of selection bias. Participants participated voluntarily in our study, following invitation, based on archival information from rehabilitation centres and a patient organization (22). It is possible that people with somewhat higher fitness levels did not participate due to work or social obligations, while people with very low fitness levels may have experienced too many barriers to be able to visit the rehabilitation centre and perform exercise tests (37).
A set-up was chosen with participants using their own wheelchair, since it was expected that wheelchair configuration would be optimal and support reaching peak performance in the tests. However, a limitation of this type of testing is that wheelchair configuration differs between participants. For example, variation between participants in horizontal axle position could have influenced wheelchair propulsion in the 15-m test and peak test (38), while results in the isometric-push test might have been influenced by variation in the ratio between the handrims and wheel radii. Furthermore, it remains unclear whether the results for peak aerobic work capacity were influenced by between-participant variation in peak inclination angle, as varying inclination angles are suggested to influence propulsion technique (38).
Care should be taken when interpreting P5–15m as an outcome of wheelchair-specific work capacity, given the role of wheelchair skill in the 15-m test (25). However, nearly all of the participants were able to perform the 15-m test and reached P5–15m in the first 5 s of the test, including those with the lowest fitness levels. This suggests that the additional weight of the instrumented wheels did not limit the performance of participants with the lowest fitness levels, which was also indicated by the non-significant difference in time over the 15-m sprint with and without the instrumented wheels (respectively, 8.2 s [7.2–10.8] vs 8.1 s [7.1–9.9], Z = –1.25 p = 0.21; these times recorded as part of wheelchair skills tests in the RCT) (22).
Conclusion
Physically inactive people with long-term SCI seem a group in the population with SCI with relatively low wheelchair-specific anaerobic work capacity, isometric strength and peak aerobic work capacity. This implies they are a group in the population with SCI in specific need of interventions to improve wheelchair-specific fitness. The weak-to-moderate associations among their fitness components imply that separate tests should be used for each component when monitoring wheelchair-specific fitness with the 15-m test, isometric-push test and peak exercise test.
Acknowledgements
*ALLRISC group name:
Ferry Woldring, University Medical Center Groningen, Center for Rehabilitation, Department of Rehabilitation Medicine, The Netherlands.
Linda Valent (PhD), Heliomare, Rehabilitation Center, Wijk aan Zee, The Netherlands.
Hans Slootman (MD), Heliomare, Rehabilitation Center, Wijk aan Zee, The Netherlands.
Willemijn Faber (MD), Heliomare, Rehabilitation Center, Wijk aan Zee, The Netherlands.
For their assistance in measurements, the authors would like to thank Anita Fijen and Joke Sprik of rehabilitation centres “Heliomare” and “Beatrixoord” as well as a large group of (under)graduate students including Thijs Hoogantink, Karin Lubberding, Jacqueline Pot and Marco Soesman. We thank the technical personnel of the Center of Human Movement Sciences (University of Groningen, University Medical Center Groningen) for technical assistance and Riemer Vegter (MSc) for support with figure layout.
The study was part of research programme “ALLRISC” (6), which is supported financially by “Fonds NutsOHRA” under the responsibility of the “ZonMw” (project number 89000006).
The authors certify that they have no affiliations with, or involvement in, any organization or entity with any interest in the subject matter or materials discussed in this article.
References

