Peter Kent, PhD1, 2, Margreth Grotle, PhD3,4, Kate M. Dunn, PhD5, Hanne B. Albert, PhD6 and Henrik H. Lauridsen, PhD1
From the 1Department of Sports Science and Clinical Biomechanics, University of Southern Denmark, Odense, 2Research Department, Spine Centre of Southern Denmark, Lillibaelt Hospital, Institute of Regional Health Services Research, University of Southern Denmark, Middelfart, Denmark, 3FORMI (Communication Unit for Musculoskeletal Disorders), Oslo University Hospital, Ullevaal, 4Department of Physiotherapy, Faculty of Health Sciences, and Akershus University College of Applied Sciences, Oslo, Norway, 5Arthritis Research UK Primary Care Centre, Keele University and 6Department of Orthopaedics, St. Bartholomew’s Hospital, London, UK
OBJECTIVE: To determine the psychometric properties of the 23-item version of the Roland Morris Disability Questionnaire (RMDQ-23) and to quantify their stability across 2 cultures/languages and 2 types of care-settings.
METHODS: Rasch analysis of data from 1,000 patients with low back pain from primary care (UK and Denmark) and secondary care (Denmark).
RESULTS: The RMDQ-23 is unidimensional if local item dependency issues are accommodated, but contains several misfitting or overdiscriminating items, some poor targeting of items, and the scoring of 4–5 items is differentially affected by common clinical characteristics (such as age, gender, pain intensity, pain duration and care setting), depending on the country.
CONCLUSION: As similar results have been found for the RMDQ-24, we believe it is timely to reconsider whether: (i) the RMDQ should be reconstructed using an item-response theory-based approach that includes consideration of new items and response options; or (ii) the use of alternative questionnaires should be recommended, such as the Oswestry Disability Index, that have shown evidence of fitting the Rasch model; or (iii) a completely new condition-specific questionnaire should be developed, perhaps utilizing a computerized adaptive testing platform.
Key words: Roland Morris Disability Questionnaire; Rasch analysis; back pain; rehabilitation; questionnaires.
J Rehabil Med 2015; 47: 00–00
Correspondence address: Peter Kent, Department of Sports Science and Clinical Biomechanics, University of Southern Denmark, Campusvej 55, DK-5230 Odense M, Denmark. E-mail: pkent@health.sdu.dk
Accepted Oct 22, 2014; Epub ahead of print Jan 16, 2014
Introduction
Back pain affects many different aspects of people’s lives, and an important index of this is how pain affects people’s ability to perform functional activities (activity limitation) (1). Measuring activity limitation not only provides an index of which functional activities are affected, but also identifies barriers to return to full participation in people’s social and occupational roles. The measurement of activity limitation has therefore become increasingly central in the clinical assessment of people with back pain.
Activity limitation is usually measured by questionnaires that are self-completed by patients. The Roland Morris Disability Questionnaire (RMDQ) is the most commonly used, self-reported questionnaire for measuring this construct in people with low back pain (LBP) (2), having been recommended as part of the core set of outcomes for assessing LBP (3, 4). Using traditional research methods based on classical test theory, the RMDQ has been shown to have measurement properties comparable to the available alternative questionnaires for measuring activity limitation in LBP (5–7).
Measurement science is progressing, however, and the performance criteria expected of questionnaires are becoming more stringent. For example, there is an increasing expectation that high-quality questionnaires produce scores for which there is evidence that they can be used mathematically to calculate scores such as means (interval level scores), and that they are stable across important clinical characteristics of patients, such as age and gender.
Rasch analysis is an example of a method of instrument development that is related to item-response theory. In the current context, Rasch analysis is a tool that can determine: whether a questionnaire can produce interval level measures (although this would require a score transformation); whether it measures only a single construct (unidimensionality), such as activity limitation; whether it contains questions on activities whose difficulty levels are evenly spaced; and whether it detemines if these properties are constant across age, gender and other clinical variables (referred to as person factors) (8). If a questionnaire does not fit the Rasch model, such analysis also provides diagnostic information as to which components require further development.
There are 6 English-language versions of the RMDQ, and they vary in the number of questions they contain, their content and their response options (9–14). The two versions most commonly used in research are the original 24-item version (RMDQ-24) (11) and a 23-item version (RMDQ-23) (10); all the others are shortened versions of these. The RMDQ-23 contains 23 items measuring activity limitation associated with back and leg pain. Each item is dichotomously scored yes/no according to the affirmation of an item statement associated with activity limitation “today”. The RMDQ-23 was created by Patrick et al. (10) by removing 5 RMDQ-24 items and adding 4 new items from the original source of the RMDQ items – the 136-item Sickness Impact Profile (15). These 4 new items were believed by Patrick et al. to increase the responsiveness of the RMDQ-23, although this was not reported in statistical terms. In addition, the RMDQ-23 has the practical advantage of asking about both back pain and back-related leg pain, making it also suitable for people with sciatica.
Four studies have used Rasch analysis to investigate the psychometric properties of the RMDQ-24 (16–19). Their results concur that the RMDQ-24 does not fit the Rasch model due to misfitting and redundant items, although in some samples they came close to fitting. They also concur that there is poor targeting of items to person ability, which in this case means that it lacks sufficient items effectively to assess people with relatively little activity limitation and those with relatively high activity limitation. However, there is also some inconsistency in their findings, with little concordance as to which items misfit and which items indicate a lack of unidimensionality. Each of those RMDQ-24 studies analysed a sample from a different country; Australia, Norway, Turkey and the UK.
It may be that this inconsistency of Rasch results for the RMDQ-24 is the outcome of technical differences between the studies, the different Rasch statistical packages used, and normal sampling variation. However, the psychometric properties of an instrument can also vary depending on the social and clinical characteristics of the study, such as the culture, language and care-setting of the participants, their pain severity, co-morbidity, and the distribution of specific and non-specific LBP in the sample (person factors). The interpretability of results would be enhanced by studies that use the same Rasch methods to analyse samples from different settings and thereby provide more stable insights into RMDQ psychometric properties, as unlike traditional methods, the Rasch Model is able to investigate whether items are biased by person factors by applying Differential Item Functioning (DIF) analyses.
The RMDQ-23 has not been studied using Rasch analysis and it is not known whether its measurement properties are improved, compared with the RMDQ-24, due to its having 4 different questions. For example, 2 of the items identified as misfitting in the RMDQ-24 are not in the RMDQ-23. The measurement properties of the RMDQ-23 have been studied using traditional techniques and its internal consistency, concurrent validity, reproducibility and responsiveness found to be similar to other questionnaires measuring the same construct (7, 20). DIF in the RMDQ-23 has also been studied using a hybrid item response theory/logistic regression approach, which found that 18 of the 23 items displayed DIF on such person factors as age, education, marital status, employment status, surgical status and general health, though the authors conclude that this DIF had minimal impact on group-level scores (21). DIF occurs when the probability of endorsing an item varies across person factors, even when statistically controlling for the underlying construct being measured.
Therefore, the aims of this study were to use Rasch analysis to describe the psychometric properties of RMDQ-23 (DIF, unidimensionality, fit to the Rasch model, item difficulty, item misfit or overdiscrimination) and to determine how these were influenced by care setting and language/culture.
Methods
Samples
The total sample comprised 1000 patients with LBP: 500 from primary care in the UK, plus 250 from primary care and 250 from secondary care in Denmark. Patients with red flag diagnoses, such as cancer, fracture and spinal infection, were excluded. Ethics approval was obtained from the relevant local ethics committees, all participants received usual care from their clinicians and all participants provided written informed consent.
The UK cohort was a secondary analysis of data drawn from the Backpain Research in North Staffordshire (BaRNS) Study, in which 935 people, aged 30–59 years, were recruited from 5 general practices in North Staffordshire between October 2001 and October 2002. These general practices covered a heterogeneous population, both socio-economically and geographically. The sample included patients with non-specific LBP, of varying pain duration and different pain location (including pain radiating to the lower extremity) who were seeking care from general practitioners (GPs). Further details of patient recruitment and data collection are reported elsewhere (22). For the current study, data from a random sample of 500 people were selected.
The Danish primary care sample was also a secondary analysis of data that were collected between February and May 2011 for a cohort study of 289 LBP patients seeking care from GPs (23). All GPs in the administrative region of Southern Denmark were invited to participate in a quality assurance programme focusing on patients with LBP, and the patient self-reported data used in the current study were recorded at or after the first consultation. Inclusion criteria were being aged 18–65 years, attending the GP for the first time due to the current episode of LBP and having adequate Danish language competency. Exclusion criteria were: suspicion of inflammatory or pathological pain; and nerve root involvement requiring acute referral to surgery. For the current study, data from a random sample of 250 people were selected.
The Danish secondary care sample consisted of consecutive, consenting patients attending the medical department of The Spine Centre of Southern Denmark, and originally matched the 935 sample size of the UK sample. This outpatient department is a non-surgical unit in a publically-funded hospital that principally performs multidisciplinary assessment and treatment planning for primary care referrers (GPs, chiropractors and medical specialists) of patients with persistent spine pain. The Danish secondary care sample included patients seeking care with either non-specific LBP, stenosis or radiculopathy, of varying pain duration. Approximately 70% had pain radiating into the leg and approximately 47% had lower limb neurological signs. For the current study, data from a random sample of 250 people were selected and combined with those from Danish primary care to form the total Danish cohort of 500 people.
Patients self-completed questionnaires, included the RMDQ-23 (UK participants in the English language version (10) and Danish participants in the Danish version (24)), about the current back pain episode. Pain intensity was measured using numeric rating scales (scored 0–10) and re-coded as: no pain to mild pain (0–4), moderate pain (5–6) and severe pain (7–10), as recommended by Jensen et al. (25) and Zelman et al. (26). Pain duration was measured in the Danish cohort as months of duration and in the UK cohort as months since the last pain-free month, and due to this difference in metric, was included in the Rasch analysis only in the Danish cohort. For the same reasons, previous episodes (coded as yes/no) was also included in the Rasch analysis only in the Danish cohort. Age was coded as < 30, 30–39, 40–49, 50–59, 60 years and above, as this classification allowed for sufficient numbers of participants in each group.
The mean missing data on the RMDQ questions was 0.07% (range 0–0.3%) and missing data in the descriptive variables ranged from 0.5% to 2.8%. All the available data were used without imputation, as Rasch analysis is able to cope with missing data.
Statistical analysis
Data were analysed with SPSS version 16 (SPSS Statistics/IBM Corp, Chicago IL, USA) and RUMM2030 (RUMM Laboratory P/L, Duncraig WA, Australia). First, the frequency of responses, including missing data, for each item was analysed. Then the RMDQ-23 was assessed for its unidimensionality, item fit, redundancy and DIF using a dichotomous Rasch model (8, 27, 28). This model assumes that as a patient’s activity limitation increases, the probability of a maximum score on the item increases. Patient and item scores are used to “calibrate” items on a logit scale. Items at one end of the scale are “easier”, while items at the other end are “more difficult”. The difficulty of individual items is determined by the probability of answering “yes”. The adequacy of the fit of each item to the Rasch model was assessed as follows:
Overall fit for the model for the scale. This was given by χ2 item-trait interaction statistic. A non-significant probability value indicates that there is no substantial deviation from the model and that the hierarchical ordering of the items is consistent across all levels of the underlying trait.
Power of the scale to discriminate amongst respondents with different levels of activity limitation. This is indicated by the person separation index, which is equivalent to Cronbach’s alpha, as values of 0.8 and 0.9 indicate that the scale can discriminate statistically between at least 3 and 4 groups, respectively (28).
Overall person fit and item fit. These were assessed by inspecting the mean and standard deviation (SD) of the fit residuals. A mean value of approximately 0.0 and a SD of 1.0 were expected. Misfitting items were identified by fit residuals of greater than plus or minus 2.5 or a significant χ2 probability value (8, 29). High negative residuals are normally interpreted to indicate items are displaying an overdiscrimination, which can occur for a variety of reasons, including item redundancy or item dependency. High positive residuals are interpreted as indicating misfitting items.
Differential Item Functioning. DIF was investigated to identify items that operated differently for people of the same level of ability (i.e. having the same amount of activity limitation), but who differ on some other clinical feature. DIF by age (< 30, 30–39, 40–49, 50–59, 60 years and above), gender, previous episodes (no, yes), pain intensity (no pain to mild pain, moderate pain and severe pain), country (Denmark, UK), and in the Danish cohort only, care-setting (primary, secondary care) were investigated and considered significant if the χ2 probability value was less than 0.05 (Bonferroni adjusted within RUMM2030 to < 0.0022, (0.05/23)). Two types of DIF can be identified: uniform and non-uniform DIF. A uniform DIF indicates that 1 subgroup, such as males, is displaying a consistently greater ability to confirm an item than another subgroup (analysis of variance (ANOVA) main effect), such as females. A non-uniform DIF indicates that the ability differences are inconsistent amongst the subgroups (ANOVA interaction effect).
The presence of true DIF (30) was examined by running separate analyses on the 2 samples, sequentially splitting items displaying most DIF, beginning with the one showing greatest DIF. If an analysis resolving item DIF also removed DIF in other items, this confirmed artificial DIF in those other items, and we discarded this as an artefact of the DIF procedure. Only true DIF is reported.
Unidimensionality. This was tested using the t-test method, as described by Smith (31).
Local item dependency. This was identified where any item displayed a correlation of item residuals that was 0.3 or more above the mean for all the items. As local response dependency can disrupt fit, inflate reliability estimates and result in spurious multimensionality, we also tested the effect of clustering locally dependant items into “testlets”, which created polyotomous items (super items) from those original dichotomous items (32).
All analyses were conducted separately on each of the 2 cohorts and these samples were not pooled to carry out a cross-cultural DIF analysis due to the psychometric problems observed within each country sample. Initially, the Rasch models were run with all available participants and then repeated without the people whose scores were located either at the floor or the ceiling of the scale (extreme scores), with the differences being reported. Extreme scores indicate that those people’s activity limitation was beyond the range measured by the scale. We identifed extreme score people by use of the default setting in RUMM2030, which is an “extreme person criterion” of 0.220.
Sample-size calculations
Linacre (29) proposed that the minimum sample size should be 20 participants for every questionnaire item, and a preliminary analysis of some of our data using randomly selected and mutually exclusive samples of approximately 200 people showed there was considerable variability of results across samples of that size. We therefore opted to analyse a cohort of 500 people from each country, recognizing that this may have increased the possibility of over-identifying DIF (type 2 error), despite Bonferroni adjustment.
Results
Table I describes the demographic similarities and differences between the samples. Predictably and desirably, there was variability between the samples on almost all the demographic variables, due to differences in care-seeking patterns between countries and the different care settings.
|
Table I. Characteristics of the UK and Danish samples |
||||
|
UK primary care sample n = 500 |
Denmark primary care sample n = 250 |
Denmark secondary care sample n = 250 |
Differences between samples |
|
|
Age, years, median (IQR) [range] |
46 (39–53) [30–59] |
47 (39–55) [18–71] |
40 (33–50) [2–81] |
Danish secondary care < the othersa |
|
Pain intensity (NRS 0–10), median (IQR) [range] |
4 (2–6) [0–10] |
7 (6–8) [1–10] |
6 (5–8) [0–10] |
UK primary care < the others, Danish secondary care < Danish primary carea |
|
Activity limitation (RMDQ 0–23), median (IQR) [range] |
8 (4–15) [0–23] |
14 (10–18) [0–22] |
12 (8–17) [0–23] |
UK primary care < the others, Danish secondary care < Danish primary carea |
|
Gender, female |
56.0 |
56.0 |
51.2 |
No statistically significant differencesb |
|
Duration of this pain episode, less than 3 months since onset of episode, % |
21.9 |
66.7
|
17.3 |
Danish secondary care < Danish primary careb |
|
Reported previous low back pain episodes, % |
82.4 |
87.0
|
70.5 |
Danish secondary care < the othersb |
|
aKruskal-Wallis with Mann-Whitney post-hoc comparisons, indicating which samples have statistically significant lower scores than other samples. bBonferroni-adjusted χ2. NRS: numeric rating scale; RMDQ: Roland Morris Disability Questionnaire. |
||||
Endorsement frequency and item difficulty
The endorsement frequencies of the RMDQ-23 in each cohort are shown in Table II. The difficulty order of the 23 items is reflected by the logit measure and suggests the relative degree of activity limitation for each item. In both cohorts, the item with the highest endorsement (73.8% UK, 92.6% Denmark) and lowest logit value (–2.35 UK, –2.80 Denmark) was item 2 (“I change positions frequently to try and get my back or leg comfortable”), as it was endorsed even by people with relatively little activity lmitation. In contrast, the item with the lowest endorsement (3.2% UK, 8.8% Denmark) and highest logit value (4.43 UK, 3.44 Denmark) was item 19 (“I stay in bed most of the time because of my back or leg pain (sciatica)”), as it was endorsed only by people with relatively high activity lmitation.
Fig. 1 shows the item maps for both cohorts with the 23 items plotted to the right and the number of people to the left of the vertical line (which reflects the difficulty level). The items endorsed by only the least physically able people with the most activity limitation are at the top (with increasing positive logit value) and the items endorsed even by the more physically able people with less activity limitation are at the bottom (increasingly negative logit value). Although the distribution of activity limitation was different in each cohort (item difficulty UK cohort mean –0.66 (SD 1.99), Danish cohort 0.39 (SD 1.51)), there was the same pattern of there being some poor distribution of items, with the the RMDQ-23 lacking items towards either end of the difficulty scale.
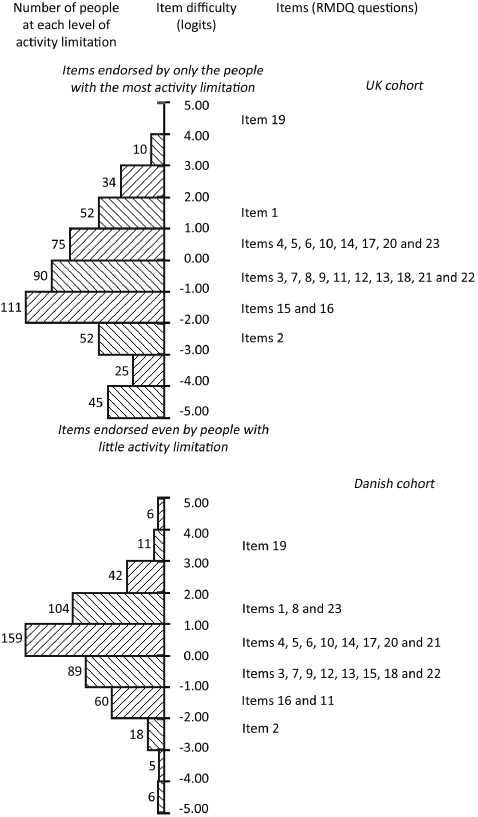
Fig. 1. Ranking of question (item) difficulty in the UK and Danish cohorts for the 23-item version of the Roland Morris Disability Questionnaire (RMDQ-23).
Item misfit and overdiscrimination
Table II also shows that, in the UK cohort, one of the 23 items (item 23) displayed evidence of item misfit (χ2 p-values < 0.002) and 3 items (items 3, 18 and 22) displayed evidence of overdiscrimination (fit statistics < –2.5). In the Danish cohort, 4 items (items 15, 17, 21 and 23) displayed evidence of item misfit (fit statistics > 2.5 or χ2 p-values < 0.002) and 3 items (items 3, 7 and 14) displayed evidence of item overdiscrimination (fit statistics < –2.5).
|
Table II. Endorsement frequency and fit statistics, from Rasch analyses of the 23-item version of the Roland Morris Disability Questionnaire cohorts |
||||||||||
|
Item |
Statement |
UK cohort (n = 500)a |
|
Danish cohort (n = 500)b |
||||||
|
Endorse-ment n (%) |
Logit measurec |
Fit residuald |
χ2 p-valuee |
|
Endorse-ment n (%) |
Logit measure |
Fit residual |
χ2 p-value |
||
|
1 |
Stay home |
112 (22.4) |
1.40 |
–2.14 |
0.0288 |
154 (40.0) |
1.57 |
–1.74 |
0.0668 |
|
|
2 |
Change position frequently |
369 (73.8) |
–2.35 |
0.39 |
0.1634 |
462 (92.6) |
–2.80 |
0.42 |
0.4778 |
|
|
3 |
Walk more slowly |
258 (51.6) |
–0.94 |
–3.29d |
0.0009e |
|
353 (70.9) |
–0.83 |
–2.77d |
0.0123 |
|
4 |
Not doing jobs around the house |
146 (29.2) |
0.75 |
–1.30 |
0.4463 |
254 (51.3) |
0.35 |
–0.09 |
0.2758 |
|
|
5 |
Use a handrail up stairs |
148 (29.6) |
0.70 |
–1.55 |
0.4170 |
269 (54.2) |
0.23 |
–1.94 |
0.0640 |
|
|
6 |
Hold onto something to get out of easy chair |
175 (35.0) |
0.31 |
–2.16 |
0.0844 |
275 (55.3) |
0.16 |
–0.82 |
0.0464 |
|
|
7 |
Dressed more slowly |
213 (42.6) |
–0.25 |
–0.40 |
0.6646 |
322 (64.5) |
–0.41 |
–3.00d |
0.0066 |
|
|
8 |
Stand for short periods |
193 (38.6) |
0.00 |
1.35 |
0.6009 |
182 (36.6) |
1.18 |
–0.43 |
0.8891 |
|
|
9 |
Try not to bend or kneel down |
247 (49.4) |
–0.71 |
–0.62 |
0.9515 |
309 (61.9) |
–0.23 |
0.07 |
0.0281 |
|
|
10 |
Difficult to get out of a chair |
159 (31.8) |
0.54 |
–0.81 |
0.4749 |
288 (57.7) |
0.02 |
–0.40 |
0.9149 |
|
|
11 |
Back or leg painful almost all the time |
211 (42.4) |
–0.22 |
–1.02 |
0.5138 |
401 (80.4) |
–1.48 |
–1.19 |
0.3206 |
|
|
12 |
Difficult to turn over in bed |
245 (49.0) |
–0.62 |
1.49 |
0.3080 |
327 (65.5) |
–0.44 |
–0.71 |
0.6985 |
|
|
13 |
Trouble putting on shoes or socks |
239 (47.8) |
–0.58 |
–0.56 |
0.9322 |
295 (59.4) |
–0.08 |
–1.29 |
0.4215 |
|
|
14 |
Only walk short distances |
166 (33.2) |
0.43 |
–1.64 |
0.1035 |
245 (49.1) |
0.49 |
–3.02d |
0.0008e |
|
|
15 |
Sleep less well |
283 (56.6) |
–1.06 |
2.29 |
0.0050 |
341 (68.6) |
–0.58 |
2.33 |
0.0001e |
|
|
16 |
Avoid heavy jobs around the house |
301 (60.2) |
–1.51 |
–1.48 |
0.1079 |
407 (81.7) |
–1.63 |
–0.77 |
0.6987 |
|
|
17 |
More irritable and bad tempered |
190 (38.0) |
0.06 |
1.45 |
0.0461 |
297 (53.6) |
0.22 |
2.92d |
0.0041 |
|
|
18 |
Go upstairs more slowly |
197 (39.4) |
–0.04 |
–3.22d |
0.0431 |
346 (69.6) |
–0.76 |
–2.39 |
0.0049 |
|
|
19 |
Stay in bed most of the time |
16 (3.2) |
4.43 |
–0.56 |
0.6403 |
44 (8.8%) |
3.44 |
1.54 |
0.8565 |
|
|
20 |
Decreased sexual activity |
187 (37.4) |
0.12 |
–0.62 |
0.6307 |
242 (49.3) |
0.50 |
–2.11 |
0.3029 |
|
|
21 |
Keep rubbing or holding areas of my body that hurt |
276 (55.2) |
–0.99 |
2.34 |
0.0748 |
220 (44.3) |
0.65 |
4.44d |
0.0000e |
|
|
22 |
Doing less of daily work around the house |
219 (43.8) |
–0.34 |
–4.41d |
0.0001e |
|
352 (70.5) |
–0.82 |
–2.29 |
0.0703 |
|
23 |
Express concern about my health |
127 (25.4) |
0.88 |
1.82 |
0.0000e |
|
158 (31.7) |
1.26 |
4.05d |
0.0000e |
|
a51 with extreme scores. 449 valid scores. 8 class intervals. b12 with extreme scores. 488 valid scores. 7 class intervals. cHigher score logits represent harder items to endorse, that is, activities that were difficult (answered “yes”) only for people with the most activity limitation due to low back pain. dFit residuals with greater than plus or minus 2.5 are marked; negative values indicate overdiscrimination for reasons including redundant or dependant items. Positive values misfitting items. eχ2 probability value (p-value) < 0.002 (0.05/23). |
||||||||||
Fit to the Rasch model
In both cohorts, there was significant deviation (p < 0.0001) from the model on the χ2 item-trait interaction statistics (see Table III). However, the person separation reliability index (PSI) values approximated 0.9, indicating an ability to discriminate between participants with 3 or 4 different levels of disability.
In the UK cohort, 51 of 500 had extreme scores. The fit statistics of the data with the misfitting people, were PSI of 0.873, mean person location –0.67 (SD 1.93), and without the misfitting people were PSI 0.867, mean person location –0.40 (SD 1.63). In the Danish cohort, 12 of the 500 had extreme scores. The fit statistics with the misfitting people were PSI 0.846, mean person location 0.38 (SD 1.50), and without the misfitting people were PSI 0.831, mean person location 0.39 (SD 1.36).
The t-tests showed evidence of RMDQ-23 multidimensionality in both cohorts (Table III).
|
Table III. Detailed results from Rasch analyses of UK and Danish cohorts of the 23-item version of the Roland Morris Disability Questionnaire |
||
|
UK primary care cohort n = 500a |
DK primary and secondary care cohort n = 500b |
|
|
Fit to model |
Highly significant deviation from Rasch model |
Highly significant deviation from Rasch model |
|
χ2, p-value |
χ2 = 272.46 (df = 161), p < 0.0001 |
χ2 = 310.68 (df = 138), p < 0.0001 |
|
Multidimensionality, t-tests, % (CI)c |
6.7 (4.7–8.7) |
8.0 (6.1–9.9) |
|
Item misfit |
Misfitting items Item 23 (χ2 p-value 0.0000) |
Misfitting items Item 15 (χ2 p-value 0.0001) Item 17 (fit residual 2.92) Item 21 (fit residual 4.44 and χ2 p-value 0.0000) Item 23 (fit residual 4.05 and χ2 p-value 0.0000) |
|
Overdiscriminating itemsd Item 3 (fit residual –3.29 and χ2 p-value 0.0009) Item 18 (fit residual –3.22) Item 22 (fit residual –4.41) |
Overdiscriminating itemsd Item 3 (fit residual –2.77) Item 7 (fit residual –3.00) Item 14 (fit residual –3.02 and χ2 p-value 0.0008) |
|
|
Local dependencies |
Items: 4 and 22 5 and 18 7 and 13 |
Items: 3 and 18 6 and 10 7 and 13 16 and 22 |
|
Systematic DIFe by care setting |
Not tested |
Uniform DIF for items 7, 13 |
|
Systematic DIF by age |
Uniform DIF for item 17 |
Uniform DIF for items 17 |
|
Systematic DIF by gender |
Uniform DIF for item 12 |
Uniform DIF for item 12 |
|
Systematic DIF by pain intensity |
Uniform DIF for items 1 and 11 |
Uniform DIF for item 23 |
|
Systematic DIF by pain durationf |
Not tested |
Uniform DIF for items 7 and 13 |
|
Systematic DIF by previous episodesf |
Not tested |
No DIF |
|
All results based on a Bonferroni adjusted p-value < 0.0022. a500 included, 51 with extreme scores, 449 valid scores, 8 class intervals. b500 included, 12 with extreme scores, 488 valid scores, 7 class intervals. ct-test method as described by Smith (31). dHigh negative fit residuals indicate overdiscriminating items, that may be due to item redundancy or to other reasons, including item dependancy. eOnly real DIF is reported (tested by the method described by Andrich et al. 2011 (30)). No non-uniform DIF was found. fOnly comparably collected in the Danish samples. DIF: Differential Item Functioning; CI: confidence interval. |
||
Differential Item Functioning
Systematic DIF by care setting (tested Danish cohort only) was found for 2 items: items 7 and 13 (uniform DIF). DIF by age was found for item 17 (uniform DIF) in both the UK and Danish cohorts, DIF by gender for item 12 (uniform DIF) in both cohorts, and DIF by pain intensity was found for items 1 and 11 (uniform DIF) in the UK cohort and item 23 (uniform DIF) in the Danish cohort. Systematic DIF by pain duration and previous back pain episodes was also tested in the Danish cohort only, with items 7 and 13 showing DIF by pain duration (uniform DIF), but no items showed DIF by previous episodes.
Additional detail of the characteristics of DIF found within each of the 2 cohorts is reported in Table IV and an overall summary of RMDQ-23 item performance across both cohorts displayed in Table V. The only consistency across the cohorts was that females were more likely to answer yes to having difficulty turning over in bed, and that people of various ages differed in their being likely to answer yes to being more irritable and bad-tempered, indicating that all other DIF findings were specific to one country.
|
Table IV. Summary of real differential item functioning (DIF) |
||
|
DIF by: |
UK cohort |
Danish cohort |
|
Care setting |
Not tested |
Patients in primary care had a higher probability of affirming item 7 [dressed more slowly] and item 13 [trouble putting on shoes or socks] |
|
Age group |
Patients aged 40–49 years had a higher probability of affirming item 17 [More irritable and bad tempered] |
Patients aged 30–39 had higher probability of affirming item 17 [more irritable and bad tempered] |
|
Gender |
Female patients had a higher probability of affirming item 12 [difficult to turn over in bed] |
Female patients had a higher probability of affirming item 12 [difficult to turn over in bed] |
|
Pain intensity |
Patients with high pain intensity had a higher probability of affirming item 1 [stay home], whereas patients with mild to moderate pain intensity had a higher probability of affirming item 11 [difficult to get out of a chair] |
Patients with no to mild pain have higher probability of affirming item 23 [express concern about my health] |
|
Pain duration |
Not tested |
Patients with pain duration of 0–2 weeks had higher probability of affirming item 7 [dressed more slowly] and item 13 [trouble putting on shoes or socks] |
|
Abbreviated item wording in square brackets. |
||
|
Table V. Summary of 23-item version of the Roland Morris Disability Questionnaire item performance in the UK and Danish cohorts |
||||||||
|
Item |
Statement |
Item misfit |
Local depend-ence |
Real DIF by |
||||
|
Care setting |
Age |
Gender |
Pain intensity |
Pain duration |
||||
|
1 |
Stay home |
Uniform (UK) |
||||||
|
2 |
Change position |
|||||||
|
3 |
Walk more slowly |
Redund (UK, DK) |
To item 18 (DK) |
|||||
|
4 |
Not doing jobs around the house |
To item 22 (UK) |
||||||
|
5 |
Use a handrail up stairs |
To item 18 (UK) |
||||||
|
6 |
Hold onto something to get out of easy chair |
To item 10 (DK) |
||||||
|
7 |
Dressed more slowly |
Redund (DK) |
To item 13 (UK) |
Uniform (DK) |
Uniform (DK) |
|||
|
8 |
Stand for short periods |
|||||||
|
9 |
Try not to bend or kneel down |
|||||||
|
10 |
Difficult to get out of a chair |
|||||||
|
11 |
Back or leg painful almost all the time |
Uniform (UK) |
||||||
|
12 |
Difficult to turn over in bed |
Uniform (UK, DK) |
||||||
|
13 |
Trouble putting on shoes or socks |
Uniform (DK) |
Uniform (DK) |
|||||
|
14 |
Only walk short distances |
Redund (DK) |
||||||
|
15 |
Sleep less well |
Misfit (DK) |
||||||
|
16 |
Avoid heavy jobs around the house |
To item 22 (DK) |
||||||
|
17 |
More irritable and bad tempered |
Misfit (DK) |
Uniform (DK, UK) |
|||||
|
18 |
Go upstairs more slowly |
Redund (UK) |
||||||
|
19 |
Stay in bed most of the time |
|||||||
|
20 |
Decreased sexual activity |
|||||||
|
21 |
Keep rubbing or holding areas of my body that hurt |
Misfit (DK) |
||||||
|
22 |
Doing less of daily work around the house |
Redund (UK) |
||||||
|
23 |
Express concern about my health |
Misfit (UK, DK) |
Uniform (DK) |
|||||
|
Misfit: misfitting item; Redund: redundancy or dependency; Uniform: systematic real uniform; DIF: Differential Item Functioning. |
||||||||
Local item dependency
Local item dependency was identified between 3 pairs of items in the UK cohort and 4 pairs of items in the Danish cohort (Table III). Clustering locally dependent items into testlets and re-running the analysis resulted in evidence of unidimensionality and fewer misfitting/overdiscriminating items, but the RMDQ23 still did not fit the Rasch model, as the fit residuals and χ2 results were still unsatisfactory (Table VI).
|
Table VI. Comparison 23-item version of the Roland Morris Disability Questionnaire item performance, when locally dependent items were clustered into “testlets” |
|||||
|
UK cohort (n = 500) |
Danish cohort (n = 5500) |
||||
|
Original analysis |
Analysis with testlets |
Original analysis |
Analysis with testlets |
||
|
Items combined into testlets |
4 and 22, 5 and 18, 7 and 13 |
3 and 18, 6 and 10, 7 and 13, 16 and 22 |
|||
|
Item fit residual, mean (SD) |
–0.64 (1.82) |
–0.55 (1.64) |
–0.4 (2.15) |
–0.29 (2.06) |
|
|
Person fit residual, mean (SD) |
–0.14 (0.57) |
–0.15 (0.55) |
–0.18 (0.7) |
–0.16 (0.68) |
|
|
χ2 interaction |
272.25 (df = 161) p < 0.001, PSI 0.87 |
230.61 (df = 140) p < 0.001, PSI 0.86 |
310.68 (df = 138) p < 0.001, PSI 0.85 |
239.36 (df = 114) p < 0.001, PSI 0.82 |
|
|
Unidimensionality, % tests < 5% (95% CI) |
6.7 (4.7– 8.7) |
4.9a (2.9– 6.9) |
8.0 (6.1–9.9) |
4.7a (2.8–6.6) |
|
|
Items displaying misfit |
23 |
23 |
15, 17, 21, 23 |
21, 23b |
|
|
Items displaying overdiscrimination |
3, 18, 22 |
3, 6b |
|
3, 7, 14 |
14, 20b |
|
aThe assumption of unidimensionality was fulfilled when locally dependent items were clustered. bThe number of misfitting or overdiscriminating items was reduced when locally dependent items were clustered. |
|||||
Discussion
The aims of this study were to use Rasch analysis to describe the psychometric properties of RMDQ-23 (DIF, unidimensionality, fit to the Rasch model, item difficulty, item misfit and overdiscrimination/redundancy) and to determine how these were influenced by care setting and language/culture. The first finding was that the RMDQ-23 is a unidimensional measure of activity limitation, if local item dependancy issues are accomodated. Furthermore, items 3 and 15 in the UK cohort and items 14, 15, 17, 21 and 23 in the Danish cohort showed misfit to the Rasch model. For items 17, 21 and 23 this is a plausible finding as these items (“I am more irritable and bad tempered with people than usual”, “I keep rubbing or holding areas of my body that hurt or are uncomfortable” and “I often express concern to other people over what might be happening to my health”) do not appear to have face validity as measures of activity limitation. While this finding differs from previous Rasch analysis of the RMDQ-24, in that items 21 and 23 are unique to the RMDQ-23 version, it was not consistent, as only item 15 displayed misfit in both cohorts. That item misfit was not eliminated by accomodating local item dependency indicates that misfit was caused by other factors.
The second finding was that 1 item consistently showed overdiscrimination (item 3) and 4 items inconsistently showed overdiscrimination (items 18 and 22 in the UK cohort only, and items 7 and 14 in the Danish cohort only). This result is also reflected in Fig. 1, where most of these items bunch together with other items that have the same item difficulty, suggesting some item redundancy. There was also some poor targeting of items to person ability, specifically that the RMDQ-23 has few items for people with relatively little activity limitation and also for people with relatively high activity limitation. This mirrors the non-ideal targeting of items that other authors have found during Rasch analysis of the RMDQ-24 (16–18).
An additional finding was that 4 items displayed real DIF in the UK cohort and 5 items in the Danish cohort, with only 2 items showing consistent DIF across countries (items 12 by gender and 17 by age). In the Danish cohort, real systematic DIF by care setting was found for 2 items, indicating that people seeking care in Denmark responded culturally or linguistically in different ways to these items, depending on the care setting.
A strength of this study is that, to our knowledge, it is the first to use Rasch analysis to investigate the measurement properties of the RMDQ-23. DIF has only previously been studied in the RMDQ-23 using a non-Rasch approach on data from the USA, finding that 18 of the 23-items displayed DIF on such factors as age, education, marital status, employment status, surgical status and general health scores (21). All of the items that displayed DIF in our cohorts also displayed DIF in the US study.
Other strengths of the current study are the size of the cohorts and the ability to quantify the measurement properties of the RMDQ-23 questionnaire across 2 cultures/languages, 2 types of care-settings, and in people with diverse episode duration. However, it would also be ideal to replicate the current findings in other samples, such as other languages, cultures and other types of patients, such as surgical patients. As there have been no previously published Rasch analyses of the RMDQ-23, direct comparisons of our results with previous findings are constrained to those involving the RMDQ-24. A limitation of the study is that the available data did not allow analysis of the separate influences of culture and language.
In conclusion, this Rasch analysis showed that the measurement properties of the RMDQ-23 are not ideal. It is unidimensional if local item dependancy issues are accomodated, but it contains evidence of misfitting or overdiscriminating items, has sparse items to adequately assess people with relatively little or relatively high activity limitation, and the scoring of most items is affected by 1 or more common clinical characteristics (age, gender, pain intensity, care setting and country). These results are similar to those from Rasch analysis of the RMDQ-24 (16–19), which have also shown that version of the questionnaire to contain some misfitting items and to have poor targeting of items with high and low activity limitation. Therefore, in our view it is timely to reconsider whether: (i) the RMDQ should be reconstructed using an instrument development approach based on item-response theory, including the consideration of different items and response options; or (ii) the use of alternative questionnaires should be recommended, such as the Oswestry Disability Index, that have shown evidence of fitting the Rasch model (33); or (iii) a completely new questionnaire should be developed, perhaps utilizing a computer adaptive testing delivery platform (34).
AcknowledgementS
The authors would like to thank Lise Hestbæk for access to the Danish primary care data used in this study.
Kate M. Dunn is funded through a Research Career Development Fellowship from the Wellcome Trust [083572]. Peter Kent is partially funded by a grant from the Danish Foundation for Chiropractic Research and Postgraduate Education. No benefits in any form have been, or will be, received from a commercial party related directly or indirectly to the subject of this manuscript.
References

