Franco Franchignoni, MD1, Marco Monticone, MD, PhD2, Andrea Giordano, PhD3 and Barbara Rocca, Psy2
From the 1Unit of Occupational Rehabilitation and Ergonomics, Salvatore Maugeri Foundation, Scientific Institute of Veruno, 2Unit of Physical Medicine and Rehabilitation, Salvatore Maugeri Foundation, Scientific Institute of Lissone and 3Unit of Bioengineering, Salvatore Maugeri Foundation, Scientific Institute of Veruno, Italy
OBJECTIVE: To create a new outcome measure of mobility in people with lower limb amputation, based on a pool of 14 items assessing prosthetic mobility, comprising the 12-item Prosthesis Evaluation Questionnaire (Mobility Section) plus 2 new items.
DESIGN: Cross-sectional study.
SUBJECTS: A total of 100 subjects (median age 58 years; 46 males; median body mass index 23.8) who had recently undergone lower limb amputation.
METHODS: Each patient completed the 14-item questionnaire twice: (i) at admission to the rehabilitation unit for prosthetic rehabilitation training; (ii) at 6-month follow-up after discharge.
RESULTS: After Rasch analysis, 2 items were deleted (one due to misfit, the other because showing large (> 0.30) positive correlation of residuals with two other items (local dependence). The remaining items fitted the Rasch model (internal construct validity), giving a new 12-item scale with a 5-level response format, the Prosthetic Mobility Questionnaire (PMQ), which demonstrated unidimensionality, lack of differential item functioning, and good reliability indices (person-separation reliability = 0.87; Cronbach’s alpha 0.88).
CONCLUSION: Although further studies are needed to increase confidence in clinical use of the PMQ, this new questionnaire appears to be a promising, psychometrically-sound patient-reported outcome measure for assessment of mobility in subjects with lower limb amputation who use a prosthesis.
Key words: lower limb amputation; leg prosthesis; outcome assessment; measurement; Rasch analysis.
J Rehabil Med 2015; 47: 00–00
Correspondence address: Marco Monticone, Via Monsignor Bernasconi 16, 20035 Lissone MB, Italy. E-mail: marco.monticone@fsm.it
Accepted Dec 23, 2014; Epub ahead of print Mar 17, 2015
INTRODUCTION
Lower-limb amputation (LLA) is a prevalent clinical condition that is expected to increase greatly over the next few decades due to ageing of the general population and a related increase in the number of people with vascular diseases, often linked to diabetes (1). A large proportion of people with LLA experience impaired mobility and reduced physical functioning, and experience pain syndromes (including phantom limb pain), and report discomfort and dissatisfaction with the fit of their prosthetic limbs (2). Therefore, defining the impact of LLA on activities of daily living, mobility, participation, and quality of life is a crucial means to support healthcare providers in improving the quality of their services (3).
However, there is a lack of consensus in the literature as to precisely what outcome reflects successful LLA rehabilitation and what outcome instrument is most appropriate to quantify that selected outcome (3). Hence, there is increasing interest in psychometrically sound outcome measures of mobility in people with LLA, in order to accurately monitor the impact of therapeutic interventions, in particular of prosthetic trials. A recent review of the psychometric properties of the outcome instruments suitable for prosthetic practice has recommended for clinical use very few LLA-specific functional tools (4). Among them, the recently revised version of the Prosthesis Evaluation Questionnaire–Mobility Scale (PEQ-MS 12/5) represents a promising self-report tool, because it has been created through a Rasch validation process, shows good psychometric properties, and includes a limited number of items (n = 12) able to cover a wide range of subjects’ ability (5). However, the questionnaire requires further analysis before its clinical use, which should include: (i) the actual performance of the 5-level response structure; and (ii) the stability of item hierarchy across sub-samples defined according to potentially relevant clinical criteria, such as age, amputation level, etc. (differential item functioning). In addition, some scale refinements appear to be warranted because PEQ-MS 12/5 did not cater for patients with higher levels of prosthetic mobility.
This study analysed a set of 14 items assessing mobility in people with LLA (which contained the 12 PEQ-MS 12/5 items), with the aim of corroborating and expanding previous results, and refining item selection, in order to create a new questionnaire able to optimize content coverage and technical quality with the fewest possible items.
METHODS
Subjects
A convenience sample of patients was consecutively recruited between January 2011 and June 2013 at the Salvatore Maugeri Foundation, Department of Physical Medicine and Rehabilitation, Scientific Institute of Lissone (MB), Italy. Inclusion criteria were: transfemoral and transtibial LLA due to diabetes, peripheral artery disease, trauma or malignancy; adult age (>18 years); ability to read and write Italian; and use of modular prostheses. Selection also took into account the patient’s rehabilitation potential, which was also based on analysis of mental and physical conditions that could restrict the appropriate use of prostheses. Exclusion criteria were: presence of cognitive or language function deficits; any condition that prohibited prosthetic fitting and use; non-ambulation before LLA for reasons unrelated to peripheral artery disease or diabetes; and bilateral LLA. A total of 125 persons was invited to participate in the study, of whom 18 declined and 7 did not return the questionnaire. Thus, 100 persons formed the final study group (giving valid answers to all items): their main clinical and demographic characteristics are shown in Table I.
|
Table I. Clinical and demographic characteristics of the study sample (n=100). For both the Prosthesis Evaluation Questionnaire–Mobility Scale (PEQ-MS 12/5) and the Prosthetic Mobility Questionnaire (PMQ): minimum score 0, maximum score 48 |
|
|
Variable |
Value |
|
Age, years, median (IQR) |
58 (48–65) |
|
Gender, male/female, n |
46/54 |
|
Body mass index, median (IQR) |
23.8 (22.2–26.3) |
|
Smoking, yes/no, n |
24/76 |
|
Employment, % |
|
|
Employed |
72 |
|
Unemployed or retired |
28 |
|
Educational level, % |
|
|
Elementary school |
4 |
|
Middle school |
11 |
|
Upper school |
45 |
|
University |
40 |
|
Cause of amputation, % |
|
|
Peripheral vascular disease and/or diabetes mellitus |
71 |
|
Trauma |
29 |
|
Amputation level, % |
|
|
Unilateral, above the knee |
58 |
|
Unilateral, below the knee |
42 |
|
Time since amputation at admission, days, median (IQR) |
38 (36–39) |
|
Length of stay, days, median (IQR) |
18 (18–20) |
|
PEQ-MS 12/5 score, median (IQR) |
|
|
Admission |
12 (9–15) |
|
Follow-up |
30 (28–32) |
|
PMQ score, median (IQR) |
|
|
Admission |
10 (8–13) |
|
Follow-up |
28 (25–30) |
|
IQR: interquartile range. |
|
The study was approved by our local ethics committee and was undertaken in compliance with the Declaration of Helsinki. All participants gave their written informed consent before enrolment.
Prosthetic Mobility Questionnaire
To create a new tool measuring the construct of mobility in people with LLA using a prosthesis, the starting point was the revised version of the Prosthesis Evaluation Questionnaire – Mobility Section (PEQ-MS12/5), a recently proposed scale composed of 12 items rated with a 5-level scale (5). Based on the results of our previous studies (5–7) and clinical experience, the expert committee decided to change the wording of 2 items of the PEQ-MS12/5 (adding more detail), simplify the wording of the 5 response options (from 0 = unable, to 4 = no problems), and add to its 12 items 2 new items of higher difficulty (in order to allow better measurement of the “high performer” group of more mobile persons with LLA): “Walk up to two hours” and “Run one block”, selected from the modified Lower Extremity Functional Status module of the Orthotics and Prosthetics Users’ Survey (8). The resulting item set evaluated mobility capabilities as perceived by the patient when using the lower limb prosthetic devices. The common stem was “Over the past week, rate your ability to…”, followed by the 14 items. Higher scores always indicated greater prosthetic mobility.
In order to examine and compare the performance of the scale at 2 different levels of functional mobility, the 14-item questionnaire was completed twice by each subject: (i) at admission to the Rehabilitation Unit after LLA (median time since amputation 38 days) for prosthetic training: at that time-point the subjects were already fitted with their provisional prosthesis, and were ready to start walking training with an assistive device (i.e. walking aid); and (ii) at a 6-month follow-up after discharge from the rehabilitation unit.
The questionnaires were distributed by physical therapists, who collected and checked them, returning any uncompleted part to the patients for completion.
Statistical analysis was carried out on collected data as a whole (n = 200, 100 patients × 2), as well as on the comparison between admission and follow-up data (see below).
The final version of the questionnaire was termed the Prosthetic Mobility Questionnaire (PMQ).
Statistical analysis
Rasch analysis. Following the above analysis, the matrix of item responses underwent RA (rating scale model) (9), with WINSTEPS software (10), according to the following sequence of steps:
1. Scale diagnostics. We investigated whether the rating scale options were being used effectively and consistently. We followed Linacre guidelines (11) requiring: (i) at least 10 responses for each category (frequency of use); (ii) an increase across categories from those representing lower ability to those representing higher ability (observed person measures); (iii) a threshold measure that increases with increasing category number (representing higher ability); finally, (iv) an outfit mean square for each category < 2.0 to check the consistency of use of the category.
2. Validity was examined by evaluating how well the empirical data fit the Rasch model: information-weighted (infit) and outlier-sensitive (outfit) mean-square statistics (MnSq) for each item were calculated, considering (according to our sample size) an MnSq between 0.80 and 1.2 as an indicator of acceptable fit (10). Items outside this range were considered misfitting, i.e. either underfitting (MnSq > 1.2) or overfitting (MnSq<0.80), having, respectively, at least 20% more or less variance than expected.
3. Reliability was evaluated in terms of person separation reliability, an index (similar to Cronbach’s alpha) estimating how well one can differentiate between different individuals’ performances on the variable being measured; for the range 0–1, coefficients > 0.80 are considered as good (9).
4. Dimensionality and local independence. The Rasch model requires that the scale is unidimensional (the information content of the items taps a single latent trait) and that the items are locally independent (they do not share significant amounts of variance). We verified these assumptions, following a PCA on the standardized residuals obtained after removal of the main component (the so-called Rasch factor):
a. calculating the proportion of variance attributable to both Rasch factor and the first residual factor and evaluating them according to the criteria proposed by Fisher (12);
b. analysing the correlation between items once the underlying Rasch dimension is conditioned out. Large positive correlations of residuals for 2 items (usually above > 0.30) indicate that they may not be locally independent (13).
5. Differential item functioning (DIF) analysis was performed (10) to search for possible differences due to context effects between the measures obtained, respectively, in: males vs females, young vs older subjects (split at the sample median age of 58 years), higher (above knee) vs lower (below knee) amputation level, admission vs follow-up data. DIF was investigated separately, calibrating the scale to obtain an estimate of the item-difficulties in each group, using as anchor values the person calibrations on the global sample, then performing pairwise t-tests between the 2 sets of item-difficulties (2-sided, α 0.05 Bonferroni adjusted for 12 comparisons to p ≤ 0.004). The “a priori” hypothesis was to not find DIF between the analysed groups.
In order to investigate possible violation of independence introduced by using the pooled data coming from admission and follow-up, we followed the procedure proposed by Mallinson (14): (i) a random sample of patients across admission and follow-up was selected so that each patient figured only once in the data-set, but all time-points were equally represented; (ii) this “random” data-set was analysed and estimates of the item-difficulties and Rasch-Andrich thresholds were produced; (iii) using these values as anchors, person abilities at all time-points were estimated (if the differences between the estimates of person abilities at each time-point with those obtained after anchoring to the random set do not differ noticeably, then there is no important local dependence across the 2 time-points). Difference was evaluated using Pearson’s correlation between person abilities estimated at 1 time-point vs person abilities after anchoring and by comparing the corresponding standard error (SE) with the SE of the person measures of the pooled (admission + follow-up) data.
RESULTS
At Rasch analysis, the 5-level rating scale of the questionnaire fulfilled the category functioning criteria. Concerning the fit of individual items to the latent trait (prosthetic mobility), the item “Walking on slippery surfaces” showed an underfitting value (Infit MnSq = 1.58), demonstrating the presence of unexpectedly high variability of the responses. Moreover, the standardized residual correlations of the item “Sit down and get up from the toilet” with both the item “Sit down and get up from a low, soft chair” and the item “Sit down and get up from a common chair without armrests” were high (respectively, 0.46 and 0.32), showing a local dependence of that item.
When the analysis was re-run after deletion of the item “Walk on slippery surfaces” (misfitting) and “Sit down and get up from the toilet” (locally dependent), all 12 remaining items fitted the Rasch model (i.e. showed MnSq values between 0.80 and 1.2) (Table II). Fig. 1 shows the item-person map for the 12-item PMQ, while Table III contains the “raw score to measure estimate” conversion table, and Table IV shows, as content analysis, the linking between each PMQ item and the International Classification of Functioning, Disability and Health (ICF).
|
Table II. Summary of Rasch analysis of the 12-item Prosthetic Mobility Questionnaire, containing item calibration (measures in descending order of difficulty, with standard errors (SE)) and fit information |
||||
|
Item |
Measure |
SE |
INFIT Mnsq |
OUTFIT Mnsq |
|
12. Run one block |
1.61 |
0.11 |
0.89 |
0.84 |
|
11. Walk up to two hours |
0.99 |
0.1 |
1.02 |
1.04 |
|
6. Walk down a steep hill |
0.30 |
0.08 |
0.87 |
0.83 |
|
5. Walk up a steep hill |
0.12 |
0.08 |
1.19 |
1.17 |
|
10. Sit down and get up from a soft deep chair |
0.05 |
0.08 |
1.13 |
1.09 |
|
3. Walk upstairs |
0.02 |
0.08 |
0.90 |
0.89 |
|
4. Walk downstairs |
–0.02 |
0.08 |
1.15 |
1.10 |
|
7. Walk on sidewalks and streets |
–0.15 |
0.08 |
1.01 |
0.97 |
|
8. Get in and out of a car |
–0.30 |
0.08 |
0.87 |
0.80 |
|
9. Sit down and get up from a common chair without armrests* |
–0.35 |
0.08 |
0.95 |
0.92 |
|
2. Walk in confined spaces |
–0.69 |
0.08 |
1.18 |
1.18 |
|
1. Walk indoors |
–1.58 |
0.09 |
0.85 |
1.01 |
|
*Firm seat surface, approximately 100% of lower leg length (i.e. starting with thighs horizontal). |
||||
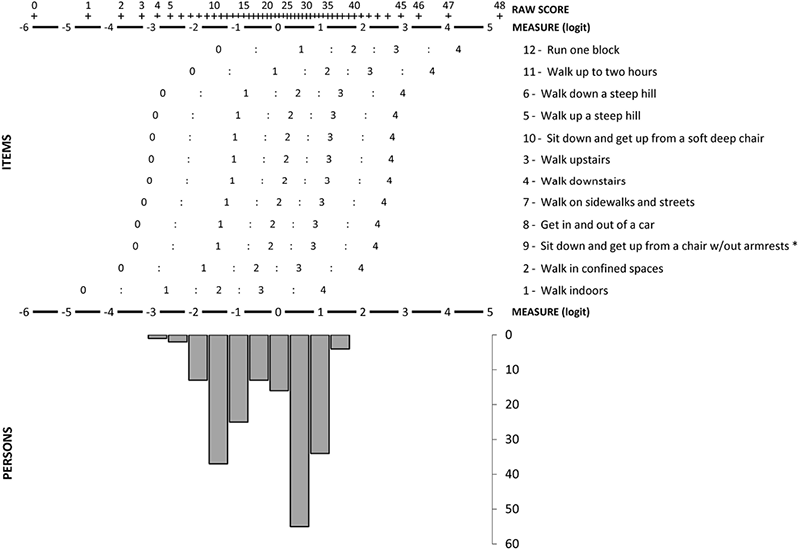
Fig. 1. The Prosthetic Mobility Questionnaire (PMQ) ruler, with items and subjects mapped on the latent trait (“prosthetic mobility”), as indicated by Rasch analysis. “Prosthetic mobility” increases toward the right of the graph. The first 2 lines contain the Rasch nomogram, which allows conversion of the total raw score (no missing data) into a logit measure (centred at the mean item-difficulty). Middle: item-difficulty measures for each category along the construct, according to the rating scale model; the rating scale is based on 5 categories (from “0 = unable”, to “4 = no problems”). The threshold between adjacent categories is marked “:”. Bottom: the distribution of subjects according to their measured amount of “prosthetic mobility”.
|
Table III. Raw score to measure estimate conversion table for the Prosthetic Mobility Questionnaire, based on the original sample calibrations (measures on complete test). The column “Meas100” presents the measures rescaled on a 0–100 interval |
|||||
|
Raw score |
Measure estimate |
Meas100 |
Raw score |
Measure estimate |
Meas100 |
|
0 |
–5.8 |
0.0 |
25 |
0.21 |
54.3 |
|
1 |
–4.53 |
11.5 |
26 |
0.3 |
55.1 |
|
2 |
–3.74 |
18.6 |
27 |
0.4 |
56.0 |
|
3 |
–3.25 |
23.0 |
28 |
0.49 |
56.8 |
|
4 |
–2.88 |
26.4 |
29 |
0.58 |
57.7 |
|
5 |
–2.58 |
29.1 |
30 |
0.67 |
58.5 |
|
6 |
–2.32 |
31.4 |
31 |
0.77 |
59.4 |
|
7 |
–2.09 |
33.5 |
32 |
0.87 |
60.3 |
|
8 |
–1.89 |
35.3 |
33 |
0.97 |
61.2 |
|
9 |
–1.7 |
37.0 |
34 |
1.07 |
62.1 |
|
10 |
–1.53 |
38.6 |
35 |
1.18 |
63.1 |
|
11 |
–1.37 |
40.0 |
36 |
1.29 |
64.1 |
|
12 |
–1.22 |
41.4 |
37 |
1.41 |
65.2 |
|
13 |
–1.08 |
42.6 |
38 |
1.54 |
66.3 |
|
14 |
–0.95 |
43.8 |
39 |
1.67 |
67.5 |
|
15 |
–0.82 |
45.0 |
40 |
1.82 |
68.9 |
|
16 |
–0.7 |
46.1 |
41 |
1.98 |
70.3 |
|
17 |
–0.59 |
47.1 |
42 |
2.17 |
72.0 |
|
18 |
–0.48 |
48.1 |
43 |
2.37 |
73.8 |
|
19 |
–0.37 |
49.1 |
44 |
2.62 |
76.1 |
|
20 |
–0.27 |
50.0 |
45 |
2.93 |
78.9 |
|
21 |
–0.17 |
50.9 |
46 |
3.35 |
82.7 |
|
22 |
–0.07 |
51.8 |
47 |
4.06 |
89.1 |
|
23 |
0.03 |
52.7 |
48 |
5.26 |
100.0 |
|
24 |
0.12 |
53.5 |
|||
|
Table IV. Linking between the Prosthetic Mobility Questionnaire (PMQ) and the categories of the International Classification of Functioning, Disability and Health (ICF) |
||
|
Item |
ICF Code |
Description |
|
1. To walk indoors |
d4600 d4601 |
Moving around within the home Moving in buildings other than the home |
|
2. To walk in confined spaces |
d4600 d4601 |
Moving around within the home Moving in buildings other than the home |
|
3. To walk upstairs |
d4551 |
Climbing stairs |
|
4. To walk downstairs |
d4551 |
Climbing stairs |
|
5. To walk up a steep hill |
d4502 |
Walking on different surfaces |
|
6. To walk down a steep hill |
d4502 |
Walking on different surfaces |
|
7. To walk on sidewalks and streets |
d4602 |
Moving around outside the home and other buildings |
|
8. To get in and out of a car |
d4208 |
Transferring oneself, unspecified |
|
9. To sit down and get up from a common chair without armrests |
d4103 |
Sitting |
|
10. To sit down and get up from a low, soft chair (e.g. a deep sofa) |
d4103 |
Sitting |
|
11. To run a block |
d4552 |
Running |
|
12. To walk up to two hours |
d4501 |
Walking long distances |
Ability levels spanned 4.42 logits (from –3.24 to 1.18) and the item-difficulty estimate spanned 3.19 logits (from –1.58 to 1.61). Mean item-difficulty and mean person ability were acceptably close, because the average measure of patient ability was –0.50 (less than 2 measurement errors). The easiest item to endorse was “Walk indoors”, while the most difficult was “Run one block”. Person separation reliability was 0.87 (Cronbach’s alpha 0.88).
The variance explained by the estimated Rasch measures was fair (53.5%; eigenvalue 13.8), and that explained by the first contrast in the residuals was quite low (6.5%; eigenvalue 1.7). At the PCA of standardized residuals, no correlation higher than 0.30 was found between the 12 PMQ items.
No differential item functioning was found in any group comparison, except for the item “Walk on sidewalks and streets”, which was calibrated as more difficult at the start of rehabilitation (measure = 0.66) than after 6 months (measure = –0.22) (Fig. 2).
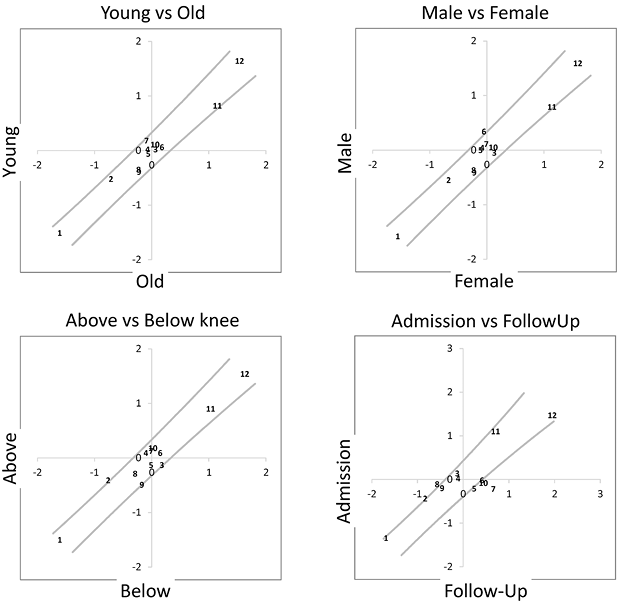
Fig. 2. Graphic comparisons of item calibrations between investigated groups, along with 95% confidence interval lines.
The influence of local dependency introduced by using admission and follow-up data in the same analysis was negligible, with Pearson’s correlation in both cases r > 0.99 and SE much smaller (0.004 or less) than the corresponding SE of the pooled set (0.08).
DISCUSSION
The Prosthesis Evaluation Questionnaire (PEQ) is an 82-item questionnaire developed to assess function and prosthesis-related quality of life. It is subdivided into 10 scales related to 4 content areas: prosthesis function (4 scales), mobility (2 scales), psycho-social aspects (3 scales), and well-being (1 scale) (15). In 2001, the mobility subscale of the PEQ (PEQ-MS) was proposed by Miller et al. as an autonomous self-reported measure for assessing lower extremity prosthetic mobility (16). The PEQ-MS consists of the 2 PEQ scales assessing ambulation (8 items) and transfers (5 items), that were combined into a single mobility measure. Subsequently, a psychometric study improved the PEQ-MS, deleting 1 original item (“Shower/bathe”), and proposing to reduce the number of response categories (from 11 to 5), and thus creating the PEQ-MS12/5 (5).
Our present study performed a Rasch analysis on a group of items (also containing those of the PEQ-MS12/5) of varying difficulty in assessing mobility in people with LLA. The results permitted the selection of a parsimonious item set with high psychometric quality. This item set constitutes a new scale, the 12-item PMQ, with good metric properties (favourably comparing with those of the PEQ-MS12/5).
Correct functioning of the 5 rating categories of the PMQ was confirmed by scale diagnostics: each option was seen to indicate a distinct level of the variable, compared with the adjacent ones. The number and wording of these 5 response options represents an appropriate point of balance between respondent’s ability to appreciably discern between them, and the best accuracy of the measure (17).
The 12 items comprising the PMQ fit the Rasch model. The misfit of the item “Walk on slippery surfaces (e.g. wet tile, snow, a rainy street, or a boat deck)” was not surprising. It represents a task subject to various personal and environmental confounding factors that could induce some subjects to respond with an idiosyncratic answer. Similarly, the item “Walk outside in inclement weather” of the Locomotor Capability Index was misfitting in the Rasch analysis of that scale (6). According to expert opinion, deletion of the item “Walk on slippery surfaces” did not negatively influence metric properties or content validity of the scale.
As an additional demonstration of the internal construct validity of the PMQ, the general hierarchical arrangement found by Rasch analysis was consistent with clinical expectations: the 2 easiest items to endorse were those connected with normal walking (indoors, or in a confined space), while the 2 most difficult items were those related to sustained walking (up to 2 h), and running ability. Furthermore, the linking process between PMQ items and the ICF categories permits rapid identification of the questionnaire’s content (18, 19), which covers 9 different categories of the chapter “Mobility”, in the ICF Activity and Participation component.
In addition, the local dependence of the item “Sit down and get up from the toilet (no aids) with both item 11 “Sit down and get up from a low, soft chair” and item 10 “Sit down and get up from a common chair without armrests” was somewhat predictable, because they require similar movements. Rasch analysis tells us that deleting these items for the sake of parsimony in the study sample would not decrease the precision of estimation of general locomotor ability, and this was what happened. A higher cut-off as sign of local dependency (inter-item residual correlation > 0.70, instead of our cut-off > 0.30) such as the one selected by Jarl et al. for the modified Lower Extremity Functional Status module of the Orthotics and Prosthetics Users’ Survey (8) led to a 27-item scale with slightly higher reliability indexes (due to item redundancy), but a more than double respondent burden.
Rasch reliability indexes showed high values (> 0.85), leading to a good degree of confidence in the consistency of both person-ability and item-difficulty estimates. Targeting of the PMQ (i.e. how much the items were of appropriate difficulty for the mean sample mobility) was fair (the mean measure of our patient mobility was 0.50 logits less than mean item-difficulty); this finding is positive because it indicates that the questionnaire can ensure a precise measurement even in subjects with high levels of mobility (e.g. younger subjects, with traumatic amputation at transtibial level, and powered ankle-foot or running-specific prostheses).
The present study has some limitations. First, the study was restricted to unilateral LLA, and it is uncertain whether the findings can be extended to bilateral LLA. Secondly, subjects with elevated prosthetic mobility were under-represented in our sample, which was composed mainly of middle-aged adults; therefore, care should be taken in generalizing these results to the wider population of people undergoing LLA, which also includes younger subjects with higher motor performances.
In conclusion, Rasch analysis allowed the development of a new scale, the 12-item PMQ, through identification of those items that are most useful to measure the intended construct (as per the indexes of unidimensionality, item local independence, and internal construct validity), and showed that one can place confidence in the consistency (reliability) of both person-ability and item-difficulty estimates obtained by the scale. Although further studies are needed to increase confidence in the clinical use of the scale, the PMQ (see Appendix I) represents a promising patient-reported outcome measure that can provide a psychometrically sound assessment of mobility in subjects with LLA who use a prosthesis.
REFERENCES
Appendix I. Prosthetic Mobility Questionnaire. Over the past week, please rate your ability to do the following activities when using your prosthesis: “Check x for each statement” | |||||
Unable (0) | High difficulty (1) | Moderate difficulty (2) | Little difficulty (3) | No problems (4) | |
1. To walk indoors | ¨ | ¨ | ¨ | ¨ | ¨ |
2. To walk in confined spaces | ¨ | ¨ | ¨ | ¨ | ¨ |
3. To walk upstairs | ¨ | ¨ | ¨ | ¨ | ¨ |
4. To walk downstairs | ¨ | ¨ | ¨ | ¨ | ¨ |
5. To walk up a steep hill | ¨ | ¨ | ¨ | ¨ | ¨ |
6. To walk down a steep hill | ¨ | ¨ | ¨ | ¨ | ¨ |
7. To walk on sidewalks and streets | ¨ | ¨ | ¨ | ¨ | ¨ |
8. To get in and out of a car | ¨ | ¨ | ¨ | ¨ | ¨ |
9. To sit down and get up from a common chair without armrests* | ¨ | ¨ | ¨ | ¨ | ¨ |
10. To sit down and get up from a low, soft chair (e.g. a deep sofa) | ¨ | ¨ | ¨ | ¨ | ¨ |
11.To run a block | ¨ | ¨ | ¨ | ¨ | ¨ |
12. To walk up to two hours | ¨ | ¨ | ¨ | ¨ | ¨ |
*Firm seat surface, approximately 100% of lower leg length (i.e. starting with thighs horizontal). | |||||

