Peter W. New, MBBS, MClinEpi, FAFRM (RACP)1,2,3, Keith Stockman, BS, MBA4, Peter A. Cameron, MBBS, MD, FACEM1, John H. Olver, MBBS, MD, FAFRM(RACP)3 and Johannes U. Stoelwinder, MD, MBBS, FRACMA, FACHE, FAFPHM1
From the 1Department of Epidemiology and Preventive Medicine, Monash University, 2Rehabilitation and Aged Care Services, Department of Medicine, Monash Health, 3Epworth-Monash Rehabilitation Medicine Unit and 4Operations Research and Projects, General Medicine Program, Monash Health, Victoria, Australia
OBJECTIVE: To estimate the potential improvement in acute and rehabilitation hospital length of stay for rehabilitation patients from hypothetical scenarios that address barriers to patient flow.
DESIGN: Data about the duration of key processes for patients (n = 360) admitted to acute hospitals and subsequently transferred to inpatient rehabilitation in 2 wards in Melbourne, Australia were used to develop a computer simulation model.
SUBJECTS: Simulated patients.
METHODS: A computer model of length of stay was developed, validation checks performed and alternate care pathways simulated.
RESULTS: Almost all scenarios resulted in significant changes in the length of stay compared with baseline. The effect size for the changes was typically small to medium. The duration of the rehabilitation discharge barriers showed significant changes in all hypothetical scenarios. The effect size was smaller when changes were made to a single barrier, but larger when multiple barriers were changed simultaneously.
CONCLUSION: Health system modelling can provide information regarding potential improvements in length of stay from addressing barriers to patient flow affecting rehabilitation patients. This can inform reforms to models of care and assist with cost benefit analyses.
Key words: computer simulation; health services research; length of stay; rehabilitation; health services accessibility.
J Rehabil Med 2015; 47: 00–00
Correspondence address: Peter New, Kingston Centre, Warrigal Road, Cheltenham 3192 Victoria, Australia. E-mail: peter.new@monashhealth.org
Accepted Jan 13, 2015; Epub ahead of print Mar 17, 2015

*An earlier version of this manuscript was presented as a poster at the 21st Annual Scientific Meeting of the Australasian Faculty of Rehabilitation Medicine, 17–20th September 2013 in Sydney, NSW, Australia.
INTRODUCTION
Addressing the challenge of increasing demand for hospital services is a global problem (1–4). It is vital that the flow of rehabilitation patients is considered as part of dealing with this challenge (5, 6). The whole healthcare system needs to be considered when optimizing patient flow because focusing on only 1 hospital setting, either acute or rehabilitation, will miss crucial bottlenecks. Relatively little attention, however, has been given to studying access barriers for acute hospital patients waiting for inpatient rehabilitation, or discharge barriers for rehabilitation inpatients after they are deemed to no longer require inpatient rehabilitation, despite reports indicating problems in these areas (6–13).
There are important reasons for addressing the lack of research on rehabilitation patient flow. These include the increased risk of iatrogenic complications arising from patients being in hospital unnecessarily (14); the poorer outcomes for patients who wait longer for rehabilitation (7, 15); the financial waste associated with the inefficient use of healthcare resources; and the flow-on effect of reduced access to beds in 1 setting impacting adversely on patient flow through the continuum of hospital care.
Computer simulation can be used to solve problems when it is not possible or practical to experiment using real subjects. Scenarios can be replicated and parameters altered to assess the impact in ways that are not otherwise possible or practical due to constraints in time, finances, environment, training or equipment (16). The process of developing a computer model for simulation assumes a degree of abstraction, where details felt to be less relevant are omitted. A computer model is always less complex than the original system (16). Simulation of patient flow through the hospital system can be used to illustrate the potential changes in length of stay (LOS) due to alterations in care processes (17, 18).
The aim of this project was to develop a computer simulation model of patients who are admitted to an acute hospital and subsequently transferred to inpatient rehabilitation. The objective was to use this model to estimate the potential changes in acute and rehabilitation hospital LOS from a number of hypothetical scenarios that simulate alternate care pathways for patients transferring from acute hospital to rehabilitation and from hypothetical changes to the barriers to discharge from rehabilitation. The information on potential LOS changes presented here will be useful to clinicians, hospital management, process improvement project leaders, governments and other funders involved in the development of alternative models of patient care, particularly those concerned with timely quality care and optimizing patient flow.
METHODS
Simulation design
A computer model was developed using established principles (19–21) to simulate the various stages of the patient journey from acute hospital admission to inpatient rehabilitation and subsequent discharge.
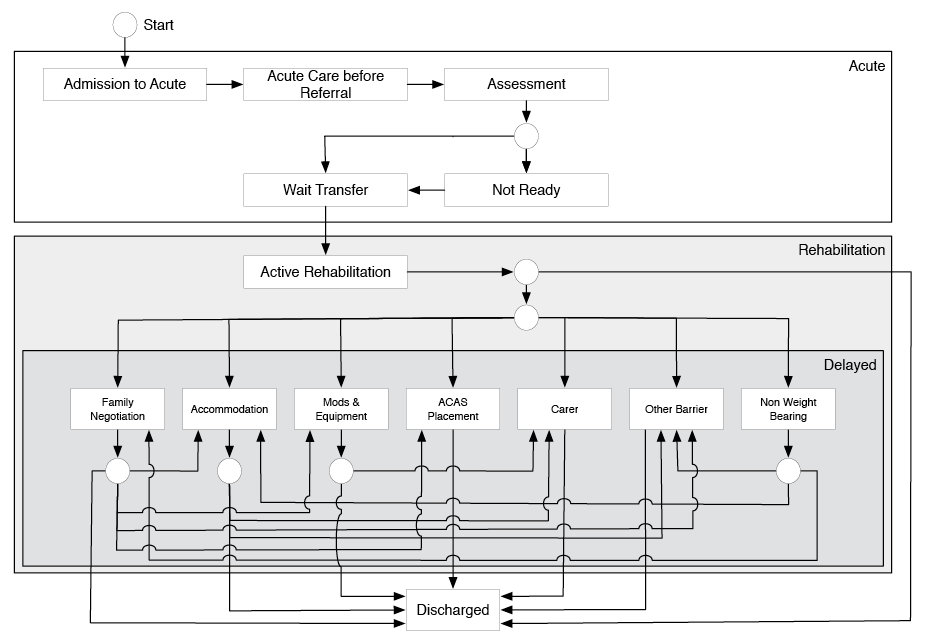
Agent-based modelling (ABM) was used for simulating patient flow (21–23). ABM uses state transitions, where agents (in this case patients) are represented in a state diagram at various stages of care (21), for example in an acute or rehabilitation hospital. Nested within the state diagram are various treatment or wait states (e.g. the period of active rehabilitation or waiting for home modifications to be completed before discharge can occur). The patients move from one state to the next in a stochastic process (http://statprob.com/encyclopedia/StochasticProcesses.html); that is, one whose behaviour is non-deterministic. In other words, the time patients spend in each state is not a fixed period that can be defined by an equation, but is a random process with indeterminacy. The duration patients spend in each state has a distinct probability distribution. The probability distribution of an event is the list of probabilities associated with each of its possible values. Fig. 1 shows the state diagram used in the model.
Compared with alternative computer modelling methods, such as discrete event or system dynamics (16, 20), ABM offers numerous advantages. We were not modelling queues for a single scenario, but multiple sequential processes, including nested states (i.e. states within states, such as the various process barriers that occur within acute hospital admission), which the other methods do not handle as easily. The capture of patient movement between transitions and waiting time in each state is also better suited to ABM than other modelling methods.
The model structure was based on our previous studies of process barriers for acute hospital patients admitted to rehabilitation (13) and barriers to discharge from rehabilitation (12). The definition of barrier to rehabilitation discharge used was that “a discharge barrier is considered to occur when the treating team believes that there are no longer any goals of therapy or treatment that require inpatient rehabilitation, and yet the patient is unable to be discharged” (24). In our previous studies data were collected on 360 consecutive patients admitted for inpatient rehabilitation into 2 wards in the largest public hospital Network in Victoria, Australia, which provides healthcare to more than 1 million people living in the southeast of Melbourne. Time in the model states was based on this previous data. The states in the model were as follows: between admission to acute hospital and referral for rehabilitation; between referral for rehabilitation and rehabilitation assessment completed; between assessment and patient deemed ready for transfer to rehabilitation; between ready for transfer from acute hospital to rehabilitation and admission into rehabilitation; between admission into rehabilitation and ready for discharge from rehabilitation; between ready for discharge from rehabilitation and actual discharge (Fig. 1). The states reflect sequential non-overlapping processes that each patient passes through in their journey from acute hospital admission until discharge from inpatient rehabilitation. In an earlier study information was collected regarding the occurrence of any rehabilitation discharge barrier, the cause(s), and the number of additional days in hospital arising as a consequence (12). These barriers were also included in the simulation model (Fig. 1).
The duration of each state in our model was stochastically modelled using Pert probability distributions, which require only the minimum, modal and maximum values (20). This approach offers numerous advantages compared with alternative methods for generating probability distributions. A major practical advantage is the simplicity and intuitive nature for setting the parameters that determine the probability distribution. In addition, the Pert distribution is continuous but bounded on both sides. We confirmed that the probability distribution for the duration of the key processes between acute hospital admission and transfer to rehabilitation and duration of rehabilitation LOS and rehabilitation discharge barriers in our previous studies could be approximated using the Pert method. Our previously collected data were used as the basis for generating the parameters (minimum, mode and maximum) for each of the Pert distributions used in the baseline simulation model. In a few instances the data in our observed distribution were uniform, that is, there was no single modal value. In these instances the data were descretized by plotting a histogram that allowed a modal value to be obtained.
Our previously developed classification of discharge barriers has 15 categories (24) but in order to simplify the model we collapsed these into 7 barrier states. Non-weight bearing, family negotiations, and accommodation were used in the model as per the classification system. Those barriers with infrequent occurrences (occupational therapy home assessment, competency assessment, specialist review, waiting for ambulatory rehabilitation, guardian/power of attorney appointment) were collapsed into an “other” group. Categories of related problems were combined from the remaining barriers. Equipment and home modifications were merged in the model as these are both related to overcoming physical barriers and are either self-funded by patients or paid through insurance. Assessment and approval of long-term supported care was combined with the time waiting for an alternative setting of care (typically a nursing home). Carer funding was combined with carer recruitment and training (Fig. 1).
In our previous study of inpatient rehabilitation discharge barriers numerous patients had sequential barriers to discharge (12). We designed the model to simulate the occurrence of these sequential barriers in a way that mirrored those observed as closely as possible. In our study a small number of patients had multiple discharge barriers simultaneously. In the model patients could only be in 1 state at a time, which was dealt with in the model by allocating the overlapping time proportionally to each state (i.e. discharge barrier).
We did not directly include in the model the number of available beds as a resource for 2 reasons. Firstly, the data from our prior studies did not include information on non-rehabilitation patients admitted into rehabilitation beds or rehabilitation patients admitted into other beds (e.g. aged-care wards) (12, 13). Secondly, for the model to be generalizable, access was better represented as a time delay. It is important to note, however, that the problem of rehabilitation bed availability for acute hospital patients was included in the model by way of the time that patients spent waiting for a bed.
Several assumptions were made in designing the model. These were: that the data collected in our previous studies on time in the various processes and waits (model states) are generalizable to delays typically seen across the sector for this cohort of patients; that the pert distribution is a reasonable approximation of the real world distribution of time in the various processes and delays; and that the time in any model state is independent of the time in any prior state.
The computer model was designed with 100 patients (agents) in each simulation run, equivalent to approximately 10 weeks of admissions into the 2 wards. The model generated the following outputs: LOS in acute hospital, time patients spent waiting in acute hospital after deemed ready for transfer to rehabilitation, LOS in rehabilitation, number of days in rehabilitation with a barrier to discharge, and the number of days in rehabilitation that had no barrier to discharge.
There are numerous approaches for determining the number of runs needed in computer simulations (21, 25, 26). An important principle is to ensure an adequate number of runs so that stable predictions and outputs are generated (26). It is also important to consider that although the effect size is important, the distribution of output variables is often more important, which are often not normal distributions (25). Furthermore, because of the fixed relationship between effect size, significance levels and the sample size (or number of runs), any relationship between simulation parameters and output can be “made significant” (25). With our project we initially determined the number of simulation runs by performing a power calculation and then confirming that acute and rehabilitation hospital LOS cumulative values for the median, average, 25th and 75th quartiles, standard deviation and standard error of the mean had stabilized by the specified number of runs. For the power calculation we set a 2-tailed alpha of 0.05, power of 99% and a medium Cohen’s effect size (27) of 0.5 to give an estimate of 142 runs (26), which we rounded up to 150. This generated the equivalent of over 8 years of patient admissions into the 2 wards (15,000 patients) based on the number of admissions during the previous data collection (12, 13).
Validation and testing
Suggested frameworks for testing ABM were followed in confirming the validity of the model (19, 28, 29). Verification testing was conducted to confirm that the model behaved as expected, including using extreme and single numbers. Refinements were made after testing indicated that the “tail” of the probability distribution in some states was too skewed (i.e. the duration of states in the model was much longer than in the observed data). In these instances the extreme outliers from our data (typically less than 5% of participants) were excluded when generating the parameters for the Pert probability distributions. After making these changes the median duration of each state in the model was approximately the same as in our previously collected data.
Hypothetical scenarios
Twelve hypothetical scenarios were developed that simulated changes to the barriers for the flow of patients through the hospital system. The detail of what these scenarios entail and how they compare to the baseline is explained in Table I. Eleven scenarios had improvements and 1 had a worsening of parameters. The improvement scenarios were based on our clinical expertise with working in patient flow and health systems redesign, including proposals outlined in our previous publications (12, 13). Table II shows the stages of care that patients progress through (transition states), the values used for the parameters in the Pert distributions for the baseline model and the hypothetical scenarios, the probability of various barriers occurring, and the corresponding results from our previous studies. These values are the basis for generating the modelling parameters. The parameters for the Pert distributions for the hypothetical scenarios were based on the premise that it is feasible to develop programmes, strategies or alternative models of patient care that target the barriers identified to provide a more efficient care pathway. Practical examples of how these hypothetical scenarios could be operationalized by systems redesign programs that improve processes are presented in Table III.
|
Table I. Hypothetical scenarios of changes to process barriers for the flow of patients through the hospital system |
|
• “Major improvements”: reduced the baseline maximum and modal pert values by approximately 15–25% for the acute hospital referral till assessment and waiting for transfer processes, and all rehabilitation discharge barriers. • “Major improvements plus”: used the same parameters as the “major improvements” scenario, but in addition included a 10% improvement in the probability that patients were ready for transfer when assessed. This was based on the premise that earlier referral to rehabilitation during the acute hospital phase of care would result in functional and medical benefits resulting in this improvement. In addition, a 10% reduction in the active rehabilitation LOS was modelled, based on the principal that efforts to improve team processes and discharge planning could achieve this without compromising patient care. • “Extreme improvements”: reduced the baseline maximum and modal pert values by approximately 33% for the acute hospital referral till assessment and waiting for transfer processes, and all rehabilitation discharge barriers, except for non-weight bearing, which was modelled as in the “targeting non-weight bearing scenario”. In addition, the “approval & waiting for nursing home” minimum waiting was reduced from 17 to 10 days. • “Targeting non-weight bearing”: This only had changes made to the parameters for patients non-weight bearing as a result of a lower limb fracture who were unable to be discharged and not able to benefit from ongoing intensive therapy until they could partially weight-bear. This was the most common barrier to discharge from rehabilitation in our previous study and was responsible for the greatest number of unnecessary days in hospital (12). The same parameters for these processes used in the “extreme improvements” scenario were applied. • Scenarios were also run that simulated changes to other individual key processes in the rehabilitation (“accommodation”, “family negotiations”, “modifications and equipment” and the rehabilitation LOS independent of any discharge barrier) and acute hospital (acute admission until referral for rehabilitation and waiting for a rehabilitation bed after deemed ready) using the same parameters for these processes used in the “extreme improvements” scenario. This allowed for a comparison of the impact of single process change compared with combined effect of multiple process changes. • “Extreme improvements plus”: used the same parameters as the “extreme improvements” scenario, and in addition included a 25% improvement in the maximum and modal time from admission to acute hospital till referral, a 10% improvement compared with baseline in the probability that patients were ready for transfer when assessed (from 0.63 to 0.7), a reduction from 16.4% to 10% in the probability of a patient in rehabilitation had a discharge barrier and an approximate 20% reduction compared with baseline in the active rehabilitation LOS mode and maximum pert values. • “Deteriorated”: This was based on the challenges arising from an ageing population and increased pressure on rehabilitation units from acute hospitals to accept patients sooner, but without increased resources or other systems changes to address rehabilitation discharge barriers. The scenario included a worsening from the baseline probabilities for occurrence of the following barriers: family negotiations, demand for nursing homes and hostel beds; access to alternative accommodation for people unable to return to their previous home; availability of carers; and inadequate resourcing for aids, equipment and home modifications (see Table II for specific parameter changes). We also increased the pert distribution mode and maximum by approximately 15% for these barriers. The acute hospital processes were not altered in this scenario. |
|
Table II. Values for probability distributions of the model of rehabilitation patient flow and hypothetical alternatives scenarios |
||||||
|
Variable parameters |
Baseline |
Major improvements |
Major improvements plus |
Extreme improvements |
Extreme improvements plus |
Deteriorated |
|
Acute hospital process barriers states |
||||||
|
Acute hospital admission till referral |
||||||
|
minimum, mode, maximum |
0, 4, 35 |
0, 4, 35 |
0, 4, 35 |
0, 4, 35 |
0, 3, 28 |
0, 4, 35 |
|
Referral till assessment by rehabilitation team |
||||||
|
minimum, mode, maximum |
0, 1, 4 |
0, 0.75, 3 |
0, 0.75, 3 |
0, 0.5, 2 |
0, 0.5, 2 |
0, 1, 4 |
|
Pr (ready transfer when assessed) |
0.63 |
0.63 |
0.7 |
0.63 |
0.7 |
0.63 |
|
Not ready when assessed until ready for rehabilitation |
||||||
|
minimum, mode, maximum |
1, 1, 14 |
1, 1, 14 |
1, 1, 14 |
1, 1, 14 |
1, 1, 14 |
1, 1, 14 |
|
Waiting for transfer to rehabilitation after ready |
||||||
|
minimum, mode, maximum |
0, 1, 6 |
0, 0.75, 5 |
0, 0.75, 5 |
0, 0.5, 4 |
0, 0.5, 4 |
0, 1, 6 |
|
Inpatient rehabilitation to discharge barriers |
||||||
|
Pr (discharge barrier) |
0.164 |
0.164 |
0.164 |
0.164 |
0.10 |
0.20 |
|
Rehabilitation LOS if no discharge barrier |
||||||
|
minimum, mode, maximum |
2, 9, 105 |
2, 9, 105 |
2, 8, 95 |
2, 9, 105 |
2, 7, 84 |
2, 9, 105 |
|
Non-weight bearing |
||||||
|
Pr (non-weight bearing) discharge barrier |
0.34 |
0.34 |
0.34 |
0.34 |
0.34 |
0.16 |
|
minimum, mode, maximum |
14, 38, 100 |
14, 30, 80 |
14, 30, 80 |
7, 14, 21 |
7, 14, 21 |
14, 38, 100 |
|
Family negotiations |
||||||
|
Pr (family negotiations) discharge barrier |
0.13 |
0.13 |
0.13 |
0.13 |
0.13 |
0.18 |
|
minimum, mode, maximum |
2, 21, 60 |
2, 19, 50 |
2, 19, 50 |
2, 14, 40 |
2, 14, 40 |
2, 24, 69 |
|
Accommodation |
||||||
|
Pr (accommodation) discharge barrier |
0.12 |
0.12 |
0.12 |
0.12 |
0.12 |
0.17 |
|
minimum, mode, maximum |
5, 14, 60 |
5, 12, 50 |
5, 12, 50 |
5, 9, 40 |
5, 9, 40 |
5, 16, 69 |
|
Equipment and home modifications |
||||||
|
Pr (equipment and home modifications) discharge barrier |
0.13 |
0.13 |
0.13 |
0.13 |
0.13 |
0.18 |
|
minimum, mode, maximum |
3, 18, 180 |
3, 15, 145 |
3, 15, 145 |
3, 12, 120 |
3, 12, 120 |
3, 21, 207 |
|
Approval & waiting for nursing home |
||||||
|
Pr (approval & waiting for nursing home) discharge barrier |
0.07 |
0.07 |
0.07 |
0.07 |
0.07 |
0.12 |
|
minimum, mode, maximum |
17, 30, 86 |
17, 24, 70 |
17, 24, 70 |
10, 20, 57 |
10, 20, 57 |
17, 35, 99 |
|
Carer funding, recruitment and training |
||||||
|
Pr (carer) discharge barrier |
0.1 |
0.1 |
0.1 |
0.1 |
0.1 |
0.15 |
|
minimum, mode, maximum |
5, 28, 120 |
5, 22, 100 |
5, 22, 100 |
5, 19, 80 |
5, 19, 80 |
5, 32, 138 |
|
Other barriers |
||||||
|
Pr (other barriers) discharge barrier |
0.11 |
0.11 |
0.11 |
0.11 |
0.11 |
0.04 |
|
minimum, mode, maximum |
1, 8, 45 |
1, 7, 36 |
1, 7, 36 |
1, 5, 30 |
1, 5, 30 |
1, 8, 45 |
|
Pr: probability; LOS: length of stay. |
||||||
|
Table III. Practical examples of how hypothetical scenarios could be operationalized in clinical practice and changes programs |
|
|
Scenario |
Practical suggestions for operationalization of hypothetical scenarios |
|
Acute hospital process barriers |
|
|
Acute hospital admission till referral |
Systematic approach to raising awareness of acute hospital teams to commence the discharge planning processes immediately after admission. This would also include processes to improve the recognition of patients potentially requiring rehabilitation, either inpatient or ambulatory, and the improvement of rehabilitation services in acute hospitals, including assessment and inreach programmes. |
|
Referral till assessment by rehabilitation team |
Improved rehabilitation assessment staffing and organization of assessment services in acute hospital. |
|
Waiting for transfer to rehabilitation after ready |
Improved rehabilitation bed access through the development of “flexible” bed numbers and addressing barriers to rehabilitation discharge. Additional funding for increased number of rehabilitation inpatient beds may also be cost-efficient. |
|
Inpatient rehabilitation barriers |
|
|
Rehabilitation length of stay |
Improve inpatient rehabilitation team and systems processes. These include the following: increase the intensity of rehabilitation therapy, implement evidence-based practice; improve work practices and organizational management, including dealing with complexity and fragmentation of care, team processes and goal setting; the length of decision cycles and discharge coordination. |
|
Non-weight bearing |
Development of alternate level of care that meets patient care and therapy needs at a lower cost than the intensity provided in rehabilitation units until patient able to able to start weight-bearing. |
|
Family negotiations |
Formal staff training on dealing with difficult families and uncertainty in discharge planning. Develop strategies to identify potentially challenging discharge planning situations earlier in the patients’ hospital admission, including in acute hospital, and implement strategies to initiate discussions involving experienced staff with the patient and family sooner. |
|
Accommodation |
Involve government housing, social services and health departments as well as community-based non-governmental organizations providing accommodation in development of interim and long-term housing options specifically designated towards hospital patients who are unable at return home. Insurance and compensation companies may also have a role in this area. |
|
Equipment and home modifications |
Involve government disability and health departments in the development of improved access in terms of timeliness and scope of cover for providing these needs for hospitalized patients where they are necessary for discharge. Explore alternative models of funding and re-imbursement, including co-payment, deferred payment and low/zero interest loans to patients and their families to cover the costs. Develop a dedicated team of architects, draftsmen, and tradespeople to perform home modifications to for hospital patients in a timely way on a regional basis. Insurance and compensation companies may also have a role in this area. |
|
Approval and waiting for nursing home |
Develop systems and processes to improve the timeliness of the approval process required for services and care, including nursing home access. Allow for the earlier referral and approval for patients still in active rehabilitation for whom it is obvious that nursing home will be required. |
|
Carer funding, recruitment and training |
Involve government disability and health departments in the development of improved access in terms of timeliness and scope of cover for providing these needs for hospitalised patients where they are necessary for discharge. Explore alternative models of funding and re-imbursement, including co-payment, deferred payment and low/zero interest loans to patients and their families to cover the costs. Insurance and compensation companies may also have a role in this area. |
There were a number of assumptions made in generating the above scenarios. When acute hospital patients were assessed earlier in the hypothetical scenarios the assumption was made that the probability they are ready for transfer was unchanged or improved. This is based on the assumption that the earlier involvement of rehabilitation professionals in the patient journey will improve the chance of a patient being ready for rehabilitation sooner (30); and that there was no change in the distribution values for the “not ready when assessed until ready for rehabilitation” waiting period.
Data analysis
The median and interquartile range (IQR) was calculated for the outcomes generated by the baseline model and for the hypothetical scenarios. The Wilcoxon Mann-Whitney test was used to compare the distribution of the baseline model population with the various hypothetical scenarios and the effect size for the differences was calculated using recommended methods for non-parametric analysis (31). The percentage of the acute and rehabilitation hospital LOS patients spend waiting for transfer into or discharge from rehabilitation have been proposed as key performance indicators of rehabilitation patient flow (24) and these were calculated from the data generated. The 2-sample test of proportions was used to compare the baseline model proportions with those in the hypothetical scenarios. p-values less than 0.05 were deemed statistically significant.
The Monash Health and Monash University Human Research and Ethics Committees approved the project. The simulation model and hypothetical scenarios were run using the agent mode of Anylogic 6.9 (Anylogic 2007, XJ Technologies, Office 410, 49 Nepokorennykh pr. 195220, St. Petersburg, Russian Federation). Stata version 12 (StataCorp, College Station, TX, USA) was used for statistical analysis.
RESULTS
The outputs of the computer simulation of the baseline model and hypothetical scenarios, with corresponding comparisons to the results from our previous studies used for generating the model (12, 13), are presented in Table IV. This includes the results for the LOS in acute and rehabilitation hospitals and the key wait states (waiting for transfer from acute hospital to rehabilitation and the duration of discharge barriers) as well as the proportion of acute LOS waiting for transfer to rehabilitation and the proportion of rehabilitation LOS with a discharge barrier. The “extreme” series of hypothetical improvement scenarios show the results for only the parameter mentioned in the column or for those influenced by the parameter altered.
Almost all hypothetical scenarios resulted in significant changes in the LOS or duration in the various states, compared with the baseline. The effect size for the changes was typically small to medium (Cohen’s suggested guidelines: r = 0.1, small; r = 0.3, medium, and r = 0.5, large) (27).
|
Table IV. Key outcomes from previous results, the model baseline and hypothetical alternatives scenarios |
||||||||||||||
|
Variable |
Results from previous studies (12, 13) |
Baseline model |
Major improvements |
Major improvements plus |
Extreme improvements |
Extreme improvements acute hospital admission to referral only |
Extreme improvements waiting for transfer to rehabilitation only |
Extreme improvements for rehabilitation length of stay only |
Extreme improvements for non-weight bearing only |
Extreme improvements for family negotiations only |
Extreme improvements for accommodation only |
Extreme improvements for home modifications and equipment only |
Extreme improvements plus |
Deteriorated |
|
Acute hospital total LOS, days, median (IQR) |
12 (7–19) |
12 (8–17)a |
11 (7–16) |
11 (7–16) |
10 (7–15) |
10 (7–14) |
11 (7–16) |
8 (5–12) |
||||||
|
Acute hospital waiting for rehabilitation, days, median (IQR) |
1 (0–3) |
1 (1–2)b |
1 (1–2) |
1 (1–2) |
1 (0.5–1.5) |
1 (0.5–1.5) |
1 (0.5–1) |
|||||||
|
Rehabilitation hospital total LOS, days, median (IQR) |
23 (15–49) |
24 (13–41)c |
24 (13–33) |
22 (12–37) |
23 (13–38) |
23 (10–33) |
23 (13–39) |
24 (13–41) |
24 (13–41) |
24 (13–40) |
17 (10–29) |
25 (13–44) |
||
|
Duration rehabilitation discharge barriers, days median (IQR) |
34 (14–56) |
37 (23–57)d |
31 (20–46) |
31 (19–45) |
17 (13–29) |
37 (22–56) |
22 (14 –40) |
35 (21–56) |
36 (20–55) |
36 (21–54) |
17 (12–30) |
40 (26–62) |
||
|
Proportion of acute hospital LOS waiting for transfer to rehabilitation; % |
12.0 |
13.1e |
11.2 |
11.2 |
10.8 |
8.3 |
8.9 |
|||||||
|
Proportion of rehabilitation hospital LOS waiting for discharge; % |
21.0 |
21.8f |
19.7 |
18.1 |
13.0 |
25.3 |
16.5 |
20.6 |
20.7 |
20.4 |
10.4 |
28.6 |
||
|
aWilcoxon Mann-Whitney test, difference compared with baseline: major improvements p < 0.0001, Z = 9.5, r = 0.05; major improvements plus p < 0.0001, Z = 14.2, r = 0.18, extreme improvements p < 0.0001, Z = 21.2, r = 0.12; extreme improvements acute hospital admission to referral only p < 0.0001, Z = 27.8, r = 0.16; extreme improvements waiting for transfer to rehabilitation only p < 0.0001, Z = 10.2, r = 0.06; extreme improvements plus p < 0.0001, Z = 52.2, r = 0.30. bWilcoxon Mann-Whitney test, difference compared with baseline: major improvements p < 0.0001, Z = 27.5, r = 0.16; extreme improvements p < 0.0001, Z = 58.2, r = 0.34; extreme improvements waiting for transfer to rehabilitation only p < 0.0001, Z=58.8, r = 0.34. cWilcoxon Mann-Whitney test, difference compared with baseline: major improvements p < 0.0001, Z = 10.5, r = 0.06; major improvements plus p < 0.0001, Z = 36.8, r = 0.21, extreme improvements p < 0.0001, Z = 26.6, r = 0.15; extreme improvements for rehabilitation length of stay only p < 0.0001, Z = 53.5, r = 0.31; extreme improvements for non-weight bearing only p < 0.0001, Z = 10.5, r = 0.06; extreme improvements for family negotiations only p = 0.003, Z = 3.0, r = 0.02; extreme improvements for accommodation only p = 0.8. Z = 0.1, r < 0.01; extreme improvements for home modifications and equipment only p < 0.0001, Z = 6.9, r = 0.04; extreme improvements plus p < 0.0001, Z = 81.2, r = 0.47; deteriorated p < 0.0001, Z = 23.9, r = 0.14. dWilcoxon Mann-Whitney test, difference compared with baseline: major improvements p < 0.0001, Z = 15.9, r = 0.09; major improvements plus p < 0.0001, Z = 39.4, r = 0.23, extreme improvements p < 0.0001, Z = 34.8, r = 0.20; extreme improvements for rehabilitation length of stay only p < 0.0001, Z = 23.2, r = 0.13; extreme improvements for non-weight bearing only p < 0.0001; Z = 38.5, r = 0.22; Extreme improvements for family negotiations only p < 0.0001, Z = 4.7, r = 0.03; extreme improvements for accommodation only p < 0.0001, Z = 14.8, r = 0.09; extreme improvements for home modifications and equipment only p < 0.0001; extreme improvements plus p < 0.0001, Z = 41.6, r = 0.24; deteriorated p < 0.0001, Z = 41.5, r = 0.24. eTwo-sample test of proportions compared with baseline model: 2-sample test of proportions compared with baseline model: major improvements, major improvements plus, extreme improvements, extreme improvements waiting for transfer to rehabilitation only and extreme improvements plus all p < 0.0001. fTwo-sample test of proportions compared with baseline model: major improvements, major improvements plus, extreme improvements, extreme improvements for rehabilitation length of stay only, extreme improvements for non-weight bearing only, extreme improvements plus, and deteriorated all p < 0.0001; extreme improvements for family negotiations only and extreme improvements for accommodation only p = 0.02; extreme improvements for home modifications and equipment only p = 0.003. LOS: length of stay; IQR: interquartile range. |
||||||||||||||
The acute hospital LOS and the waiting time in acute hospital for transfer to rehabilitation values had significant reductions compared with baseline for all hypothetical scenarios. The rehabilitation LOS had significant reductions for all scenarios except for “extreme improvements for accommodation only”. The duration of the rehabilitation discharge barriers had significant changes for all hypothetical scenarios. The effect size was much smaller when changes were made to a single barrier. Correspondingly, the effect size was larger when multiple barriers were changed simultaneously.
The proportion of acute hospital LOS waiting for transfer to rehabilitation improved for all hypothetical scenarios. The proportion of rehabilitation LOS waiting for discharge improved for all scenarios except for “rehabilitation LOS independent of any discharge barrier”. The reason for the deterioration in this outcome for this scenario was because no changes occurred to discharge barriers, but the efficiency of the rehabilitation process was improved, giving a higher proportion of unnecessary time in hospital.
DISCUSSION
This paper describes the development of a computer model that simulates the hospital processes for rehabilitation patients moving through the acute and rehabilitation hospital system, which generates outputs that include the LOS in these 2 settings. We used this model to estimate the potential LOS improvements from hypothetical care pathways that address the important process delays for patients. These scenarios are contrasted with the baseline state and a worsening scenario.
Although almost all of the scenario changes were statistically significant, signifying differences in the distributions, the median values in many cases were not appreciably different (for example the extreme improvement scenarios with only a single parameter changed). These results reinforce the need for care among researchers and hospital administrators when planning and evaluating outcomes from process improvements targeting LOS. Because LOS is not normally distributed, but right skewed, descriptions of LOS should utilize measures of distribution as well as measures of central tendency, such as mean or median LOS (24, 32). Our simulations, involving cohorts of 15,000 patients illustrate that simply looking at LOS outcomes for a relatively small numbers of patients with such widely distributed LOS may give a false impression of the absence of significant change when there actually may be a significant effect present. The reverse could also occur.
The results of the hypothetical scenarios illustrate that it is important to address multiple barriers simultaneously as part of process improvement projects in order to maximize the improvement in hospital LOS and patient flow. Not surprisingly, scenarios that improved a single process had a much smaller effect size compared with those targeting multiple processes. It is important to emphasize that the model and simulations presented here are a tool to illustrate potential outcomes from hypothetical changes. It is not possible to use our findings to specify how resources should be allocated in order to address process barriers or what are the best combinations of barriers to address first. In each hospital this will need to be informed by the actual specific barriers that are responsible for the greatest delays and the cost and ease of addressing the barriers. Approaches to consider when developing strategies to address discharge and process barriers have been proposed (12).
Information generated by our model can potentially be used by clinicians, hospital management, government and other healthcare funders to guide the development of alternative models of care that improve patient flow, and subsequent patient outcomes, as well as hospital access for other patients and the overall efficiency of healthcare resource utilization. Our model could be combined with health system costs and estimates of the costs involved with funding the hypothetical scenarios to generate cost-benefit analyses.
Implications of this project are that the potential of modelling in rehabilitation for facilitating improvements in health service research and redesigning models of care and service delivery needs to be recognized and acted upon by a greater number of people involved in these activities. Furthermore, it can be seen that addressing both acute hospital and rehabilitation process barriers enhances the potential improvement in patient flow.
This project was limited by the use of data for designing the model from 2 inpatient rehabilitation units in Melbourne, Australia, collected in 2008–2009 and the use of a single modelling method. The process barriers in acute hospital and barriers to discharge from rehabilitation used in the model are based on results from our previous studies. These barriers were also reported as common in a survey of other rehabilitation units in Australia (11) as well as in 10 spinal rehabilitation units in different countries (33). We therefore assert that the principals underpinning our model and simulation are generalizable to other settings, both in Australia and internationally, although the exact duration of the delays will no doubt vary from 1 setting to another. Although the specific durations of the process and discharge barriers will vary in other settings, the critical issue is that the underlying principals are the same and that the potential of computer modelling to facilitate heath system improvements is generalizable.
We have listed the assumptions made for the baseline model and hypothetical scenarios. It is important to emphasize that even if more time and effort was spent on developing a more complex model, this would not necessarily improve the validity of the model in a cost-effective way, as any model only needs to be as detailed and complex to perform the objectives for which it was designed (19). Furthermore, it is important to note that the outcomes from the real-world health systems and simulations are non-stationary (distributions of successive observations vary with time) and that they are auto-correlated (outcomes from processes are correlated with each other).
The model developed in this study used a single-method and single-paradigm approach. Alternative mixed-modelling methods using multi-paradigms, additional states, and developed using a wider range of stakeholders would enable a more complex model to be developed that could allow a wider range of scenarios to be considered.
The major strength of the model developed in this study is that it has the potential to use a more comprehensive range of data collected prospectively and combined with process improvement programs to address barriers to patient flow. In this way it would be possible to test hypothetical improvements in a simulation and then assess these against achievements in a series of “plan-do-study-act” activities. By doing this the simulation model can be developed and integrated to run in parallel to routine clinical care as a part of continuous improvement processes. Collecting data dynamically and using this to refine simulation models, while at the same time informing system changes to optimize patient flow, has potential to improve health system efficiency enormously (16).
In conclusion, health system modelling is useful in providing the likely magnitude and direction of potential improvements in LOS by addressing barriers affecting rehabilitation patient flow. Information from modelling can be used to guide reforms directed at improving patient flow in hospital and associated cost benefit analyses.
ACKNOWLEDGEMENTS
Dr New would like to acknowledge the financial support received for his work on this project by way of the Royal Australasian College of Physicians (RACP) Pfizer Research Entry Scholarship. Neither the RACP nor Pfizer had any influence on the project.
REFERENCES

