Luzius Mader, MSc1,2, Marcel W. M. Post, PhD1,3,4, Carolina S. Ballert, MSc1,2, Gisela Michel, PhD2, Gerold Stucki, MD, MS1,2 and Martin W. G. Brinkhof, PhD1,2
From the 1Swiss Paraplegic Research (SPF), Nottwil, 2Department of Health Sciences and Health Policy, University of Lucerne, Lucerne, Switzerland, 3Brain Center Rudolf Magnus and Center of Excellence for Rehabilitation Medicine, University Medical Center Utrecht and De Hoogstraat Rehabilitation, Utrecht and 4Center for Rehabilitation, University of Groningen, University Medical Center Groningen, Groningen, The Netherlands
OBJECTIVE: To examine the metric properties of the Utrecht Scale for Evaluation of Rehabilitation-Participation (USER-Participation) in persons with spinal cord injury in Switzerland from a classical and item response theory perspective.
DESIGN: Cross-sectional survey.
SUBJECTS: Persons with spinal cord injury living in the Swiss community (n = 1,549).
METHODS: Score distributions and internal consistency were evaluated using Classical Test Theory. The Restrictions and Satisfaction scales were subjected to Rasch analysis. Anchored analyses were performed to account appropriately for items with structural missing.
RESULTS: Internal consistency was good for the Restrictions (α = 0.90) and Satisfaction scales (α = 0.90), but not for the Frequency scale (α = 0.65). Rasch analyses showed acceptable model fit for the Restrictions and Satisfaction scales after collapsing response categories of some items and merging some items into testlets. Differential item functioning was small. Anchoring allowed inclusion of the item work/education in the Restrictions scale and work/education and/or partner relationship in the Satisfaction scale.
CONCLUSION: The Restrictions and Satisfaction scales of the USER-Participation showed satisfactory metric properties. The Frequency scale showed fewer optimal properties, but nonetheless provides important additional information regarding participation. Conversion tables were performed to transform USER-Participation raw scores into a 0–100 interval scale using Rasch-based ability estimates for use in epidemiological studies.
Key words: spinal cord injury; social participation; validation studies; psychometrics; Rasch analysis; disability evaluation.
J Rehabil Med 2016; 48: 165–174
Correspondence address: Martin W. G. Brinkhof, Swiss Paraplegic Research, Guido A. Zäch Strasse 4, CH-6207 Nottwil, Switzerland. E-mail address: martin.brinkhof@paraplegie.ch
Accepted Jun 22, 2015; Epub ahead of print Feb 1, 2016
INTRODUCTION
Spinal cord injury (SCI) is associated with substantial changes in motor, sensory and autonomic functioning, resulting in high levels of disability (1). However, life expectancy and community discharge among persons with SCI have increased in recent decades due to improvement in acute medical treatment and rehabilitation care (1, 2). Community integration, social participation and quality of life are currently viewed as the ultimate goals of rehabilitation (3–5). Persons with SCI may, however, still experience restrictions or barriers to participation in different domains, including employment or social-recreational activities (4, 6, 7). Inadequate levels of social participation may be related to impaired life satisfaction, emotional and physical well-being (6, 8–10). The concept of participation was introduced in the International Classification of Functioning, Disability and Health (ICF) and is defined as “involvement in a life situation” (11). Major components of social participation include home and family roles, other productive roles (e.g. work, school, volunteering), social network, and leisure activities (3, 12).
The Utrecht Scale for Evaluation of Rehabilitation-Participation (USER-Participation) is a newly developed International Classification of Functioning, Disability and Health (ICF)-based participation measure assessing objective and subjective participation (13). It covers ICF chapters 6–9, described previously as the most characteristic of participation (14). The USER-Participation consists of 32 items and assesses 3 aspects of participation: Frequency, experienced Restrictions, and Satisfaction (15). An earlier version of the USER-Participation has been shown to be a valid measure in rehabilitation outpatients in the Netherlands (13). In this study, construct, concurrent, and discriminative validity were generally good (13). These findings were supported by a validation study of the slightly modified final version of the USER-Participation in an SCI population by van der Zee et al. (15). Reproducibility and responsiveness of the USER-Participation have also been shown to be generally satisfactory (16–18). To our knowledge, the USER-Participation has only been validated in the Netherlands by using Classical Test Theory (CTT). Consequently, its metric properties have to be further examined in different settings to support the validity of the USER-Participation in an international context, including the use of Rasch analysis as an emerging standard in questionnaire development (19). In addition, no information on the usefulness of the USER-Participation in evaluating population-based data on participation in the context of epidemiological studies is available. The overall objective of the present study was to examine the metric properties of the USER-Participation from a classical and item response theory perspective. Specifically, the basic metric properties of the USER-Participation scale were evaluated by investigating their fit to the Rasch model and in order to provide conversion tables for conversion of raw scores into Rasch-derived ability scores.
METHODS
Sample and procedure
Cross-sectional data from the community survey of the Swiss Spinal Cord Injury Cohort Study (SwiSCI) were analysed. The SwiSCI community survey includes persons with a diagnosis of traumatic or non-traumatic SCI, aged 16 years or older with a permanent residency in Switzerland (20). Exclusion criteria were congenital conditions leading to SCI (e.g. spina bifida), new SCI in the context of palliative care, neurodegenerative disorders (e.g. multiple sclerosis) and Guillain-Barré syndrome (20). The recruitment process for the SwiSCI community survey is outlined elsewhere (21). The survey contained 3 subsequent modules that were sent out with an interval of approximately 3 months (20). Participants were invited to complete the questionnaire on paper, online or via a telephone interview. The focal data for the present study were collected in the second module or Basic Module (20). In total 3,144 individuals with SCI were invited to participate in the SwiSCI community survey and a representative sample of 1,549 participated in the Basic Module, signifying a response rate of 49.3% (21). The SwiSCI community survey was formally approved by the respective regional Research Ethics Committees. All participants gave written consent for the anonymous use of their data.
Instrument
The USER-Participation is a self-report questionnaire of 32 items with 3 separate scales: Frequency, Restrictions, and Satisfaction (13, 15). The Frequency scale consists of 11 items, 4 items on vocational activities and 7 items on leisure and social activities. The 4 items on vocational activities address the number of hours spent per week, and are scored on a 6-point ordinal scale from 0 (not at all) to 5 (36 h or more). The 7 items on leisure and social activities address the frequency in the last 4 weeks scoring from 0 (not at all) to 5 (19 times or more). The Restrictions scale consists of 11 items that address activities that may be restricted by their health condition. The perceived difficulty in performing the activity is rated on a 4-point scale, ranging from 0 (not possible at all) to 3 (no difficulty at all). If any item is not relevant to the person or the restrictions are not related to the person’s health status, the option “not applicable” is available. The Satisfaction scale consists of 10 items on satisfaction with vocational, leisure and social activities. Items are rated on a scale from 0 (not satisfied at all) to 5 (very satisfied). For the items on vocational activities and partner relationship a “not applicable” option is available. The sum score of each scale is based on all applicable items and is converted to a 0–100 scale, with higher scores indicating better participation (more time spent/higher frequency, less restrictions, higher satisfaction). There is no total USER-Participation score aggregating the scores from each scale.
Statistical analyses
All analyses were performed using Stata version 13 (22) and R version 3.1.0 (23), in particular with the R-package TAM for Rasch analysis (24). We evaluated score distributions with descriptive statistics. Floor and ceiling effects were considered present if > 15% of participants achieved the minimum or maximum score on a scale (25). Applying the classical test theory (CTT) approach, we evaluated internal consistency with Cronbach’s alpha and item-rest correlations. A Cronbach’s alpha of > 0.70 was considered satisfactory (25) and item-rest correlations of 0.30 were used as the minimum standard as in previous studies (13, 15).
We established the interval properties of the Restrictions and Satisfaction scales with a model from the Rasch family, namely the Partial Credit Model (PCM) for polytomous response data (26). Rasch analysis allows the verification of important properties of measurement scales, such as monotonicity, independence, and unidimensionality. Rasch analysis substantiates whether scale properties are met or whether refinement of the scale is needed to improve internal consistency. Finally, the findings of the present Rasch analysis may contribute to the existing pool of evidence supporting use of the USER-Participation scale for measuring participation in the context of rehabilitation medicine (13). In Rasch analysis, the probability of a person scoring on an item can be modelled with a logistic function of the difference between the person’s ability and item difficulty (27). We did not perform Rasch analysis of the Frequency scale, since frequency of performance is not a good indicator of item difficulty (but rather is influenced by personal preference), and is not scaled on one dimension because different participation domains cannot be performed at the same time (15, 19).
Reliability was quantified with the Person Separation Index (PSI), which can be interpreted as Cronbach’s alpha (27). The fit of the data to the Rasch model was examined with infit and outfit mean square statistics. Infit and outfit mean square statistics ranging between 0.80 and 1.20 were considered acceptable (28). In addition, the Smith Interval was calculated to provide a sample size adjusted range of fit (29). A correct order of thresholds is present if each response option demonstrates the highest probability at a specific range of the measured construct with successive thresholds found at increasing levels of difficulty of the item. Disordered thresholds might be collapsed to refine the scale. Furthermore, targeting was investigated to verify that person abilities match the difficulties of the items, with good targeting signifying that both the mean item difficulties and the mean person abilities are centred towards zero. We analysed local item dependency (LID) to identify potential patterns in the item residuals. LID is present if standardized person-item residuals show correlations of > 0.20. To address local dependency, we added testlets that were created through the aggregation and summation of dependent items. We assessed dimensionality with principal component analysis (PCA) of residuals. Unidimensionality is present if the second eigenvalue is < 1.40 (30). Differential item functioning (DIF) was analysed to test whether item responses are influenced by group characteristics with an analysis of variance (ANOVA) of the residuals (27). The level of significance of the DIF analysis is Bonferroni corrected for repeated testing. In the present study, we investigated DIF for age and sex (male/female), as well as for type of SCI (paraplegia/tetraplegia), degree of SCI (complete/incomplete), age at injury, and time since injury. Invariance was also tested for language (German/French) and questionnaire type (non-paper-form/paper-form). We split age, age at injury, and time since injury at the median. The items work/education and partner relationships were marked as not applicable by 21.3% and 15.3% of the participants on the Restrictions scale, and by 28.4% and 19.0% on the Satisfaction scale. To account for the structural missingness in these 2 items anchored analyses were performed (31). In a first step, Rasch analysis of the Restrictions and Satisfactions scales was performed excluding the 2 items work/education and partner relationship. After the necessary adjustments to attain good fit to the Rasch model, the corresponding item difficulties and thresholds were computed. In a second step, for both scales the computed item difficulties and thresholds of these respective sets of items served as anchors to calculate the difficulties of the items work/education and partner relationship for responders to these items. This was done first separately for each item and then for responders to both items. Anchoring thereby allows a refinement of the person ability estimates for the subgroup with additional information on restriction due or satisfaction with work or partner. Conversion tables for all tested models were developed to transform responses obtained on different items into a common scale using Rasch-based ability estimates.
RESULTS
Characteristics of the study population
Demographic and SCI characteristics of the study population are shown in Table I. The mean age of our sample was 52.4 years and 71.5% were men. Two-thirds were paraplegics and the mean time since injury was 16.9 years.
|
Table I. Demographic and spinal cord injury (SCI) characteristics of the study population (n = 1,549) |
|
|
Variables |
|
|
Demographic characteristics |
|
|
Sex, n (%) |
|
|
Male |
1,107 (71.5) |
|
Female |
442 (28.5) |
|
Age, years, mean (SD) |
52.4 (14.8) |
|
Civil status, n (%) |
|
|
Single |
450 (29.1) |
|
Married/registered partnership |
815 (52.6) |
|
Divorced/widowed |
272 (17.6) |
|
Missing |
12 (0.8) |
|
Partnership, n (%) |
|
|
Yes |
1,004 (64.8) |
|
No |
483 (31.2) |
|
Missing |
62 (4.0) |
|
Education, years, mean (SD) |
13.6 (3.3) |
|
Employment, n (%) |
683 (44.1) |
|
SCI characteristics |
|
|
Time since injury, years, mean (SD) |
16.9 (12.7) |
|
Age at SCI, years, mean (SD) |
35.4 (17.4) |
|
Type of SCI, n (%) |
|
|
Paraplegia |
1,063 (68.6) |
|
Tetraplegia |
474 (30.6) |
|
Missing |
12 (0.8) |
|
Degree of SCI, n (%) |
|
|
Complete |
646 (41.7) |
|
Incomplete |
894 (57.7) |
|
Missing |
9 (0.6) |
|
Cause of SCI, n (%) |
|
|
Traumatic |
1,202 (77.6) |
|
Non-traumatic |
332 (21.4) |
|
Missing |
15 (1.0) |
|
SD: standard deviation. |
|
Internal consistency and score distributions of items and scales
Score distributions for items and scales are presented in Table II. No scale showed floor or ceiling effects. The Frequency scale showed a Cronbach’s alpha of 0.65 with several item-rest correlations below 0.30. The Restrictions and Satisfaction scales showed good reliability and high item-rest correlations (Table II).
|
Table II. Score distributions and internal consistency of the USER-Participation |
|||||||||
|
|
n |
Mean (SD) |
Median (IQR) |
Skewness |
Range |
Floor (%)a |
Ceiling (%)a |
Cronbach’s alpha |
Item-rest correlations > 0.30 |
|
Frequency |
1,474 |
34.2 (12.2) |
34.3 (26.1– 42.5) |
0.15 |
1.4–92.5 |
0.0 |
0.0 |
0.65 |
5/11 |
|
Restrictions |
1,491 |
70.0 (21.7) |
72.7 (54.5–87.9) |
–0.51 |
0.0–100.0 |
0.3 |
9.5 |
0.90 |
11/11 |
|
Satisfaction |
1,459 |
69.3 (18.0) |
72.5 (58.3–80.6) |
–0.83 |
0.0–100.0 |
0.3 |
3.0 |
0.90 |
10/10 |
|
USER-Participation: Utrecht Scale for Evaluation of Rehabilitation-Participation; SD: standard deviation; IQR: interquartile range; SD: standard deviation. aCalculated by dividing the number of participants scoring the minimum or maximum by the total number of participants. |
|||||||||
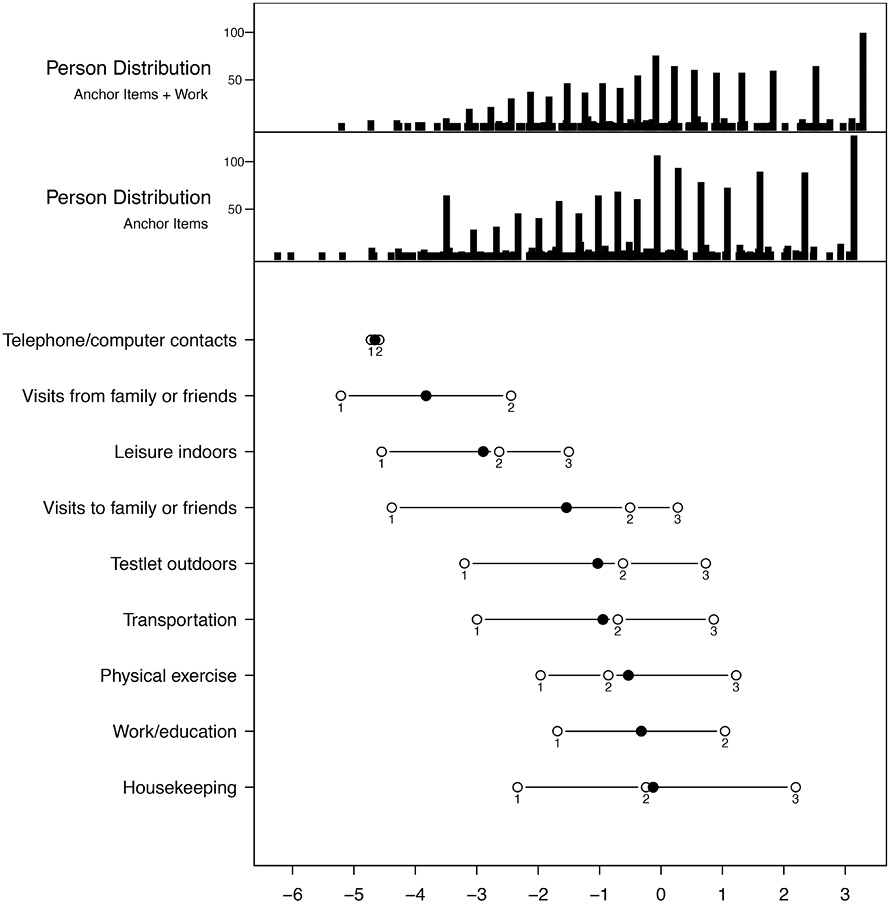
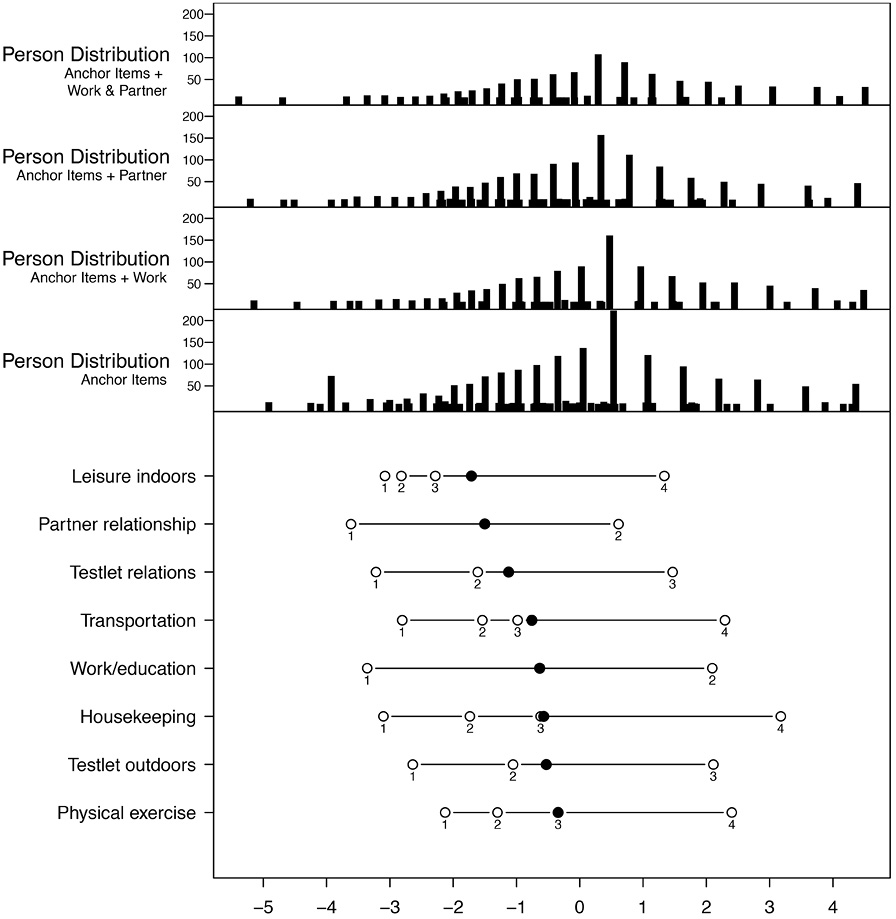
Rasch analysis of the Restrictions and Satisfaction scales with all items
Rasch analysis of the Restrictions and Satisfaction scales with all items revealed substantial misfit, disordered thresholds for several items and local item dependencies (data not shown). The most problematic items were work/education and partner relationship in both scales. No model including these 2 items showed acceptable fit. Both items have a substantial amount of missing values (24.2% up to 37.6%) because these were not applicable to many participants.
Rasch analysis of the anchor items of the Restrictions and Satisfaction scales
Acceptable model fit was achieved for the items of both scales when excluding work/education and partner relationship (Tables III and IV). Regarding the Restrictions scale, the response options with difficulty and no difficulty at all had to be collapsed for correct ordering of the items visits from family or friends and telephone/computer contacts (Fig. 1). No disordering was found in the Satisfaction scale (Fig. 2). The analysis of residuals identified LID between the items going out and outdoor activities (r = 0.31) of the Restrictions scale. Concerning the Satisfaction scale we found LID between the items family relationships and friends/acquaintances (r = 0.36) and outdoor activities and going out (r = 0.28). Consequently, we formed a testlet with the items outdoor activities and going out for both scales. We also formed a testlet with the items family relationships and friends/acquaintances of the Satisfaction scale. The final estimates are displayed in Tables III and IV. Reliability of the anchor items of the Restrictions and Satisfaction scales was good, with a Person Separation index (PSI) of 0.80 and 0.84, respectively (Table V). Mean person ability was –0.13 and –0.04 for the Restrictions and Satisfaction scales, with corresponding item difficulties of –1.94 and –0.84 (Table V). DIF for the anchor items was generally low (Table VI). Concerning the Restrictions scale, DIF was mainly associated with SCI characteristics and age at SCI, whereas the Satisfaction scale showed DIF for sex and language (4 items in total).
|
Table III. Fit statistics and item difficulties of the USER-Participation Restrictions scale |
|||||||||||
|
|
Location |
1st threshold |
2nd threshold |
3rd threshold |
Anchor Items |
|
Anchor Items + Work |
||||
|
n |
Outfit MSQ |
Infit MSQ |
|
n |
Outfit MSQ |
Infit MSQ |
|||||
|
Telephone/computer contacts |
–4.66 |
–4.72 |
–4.59 |
– |
1,438 |
0.50 |
0.94 |
|
1,051 |
0.29 |
0.78 |
|
Visits from family or friends |
–3.83 |
–5.21 |
–2.44 |
– |
1,409 |
0.89 |
1.02 |
|
1,036 |
0.92 |
1.06 |
|
Leisure indoors |
–2.90 |
–4.55 |
–2.64 |
–1.50 |
1,393 |
1.06 |
1.16 |
|
1,033 |
1.02 |
1.19 |
|
Testlet outdoors |
–1.54 |
–4.39 |
–0.51 |
0.27 |
1,409 |
0.89 |
0.94 |
|
1,037 |
0.86 |
0.88 |
|
Visits to family or friends |
–1.03 |
–3.20 |
–0.62 |
0.73 |
1,549 |
0.85 |
0.89 |
|
1,080 |
0.71 |
0.75 |
|
Transportation |
–0.95 |
–3.00 |
–0.70 |
0.86 |
1,395 |
0.87 |
0.91 |
|
1,056 |
0.87 |
0.90 |
|
Physical exercise |
–0.53 |
–1.96 |
–0.86 |
1.22 |
1,273 |
1.12 |
1.11 |
|
977 |
1.02 |
1.00 |
|
Work/education |
–0.32 |
–1.69 |
1.04 |
– |
n.a |
n.a |
n.a |
|
1,080 |
1.07 |
1.11 |
|
Housekeeping |
–0.13 |
–2.34 |
–0.24 |
2.19 |
1,352 |
1.11 |
1.11 |
|
1,030 |
1.08 |
1.08 |
|
Smith Cut-Off |
– |
– |
– |
– |
|
1.15 |
1.05 |
|
|
1.18 |
1.06 |
|
USER-Participation: Utrecht Scale for Evaluation of Rehabilitation-Participation; MSQ: mean square; n.a: not applicable. |
|||||||||||
Anchored analysis of the Restrictions scale
Adding the item work/education to the previously calculated item difficulties of the anchor items for responders to this item resulted in good item fit (Table III). However, the outfit, which is a more outlier sensitive statistic, was below the acceptable boundary of 0.8 for the telephone/computer contact item in all analyses of the Restrictions scale. Also, the item visits to family and friends showed infit and outfit values that were slightly below the cut-off values in the analysis of the anchor items with the work/education item. Low infit or outfit values indicate that the items overfit to the model, which is less a threat to a scale than underfit. The response options with help from others and with difficulty of the item work/education had to be collapsed for correct ordering (Fig. 1). No LID was identified. The reliability of the anchor items and work/education was good, with a PSI of 0.84 (Table V). The DIF found in the analysis with anchor items could not be confirmed in the anchored analysis (Table VI). Only for the item housekeeping did the DIF observed in the anchor item analyses persist. No model including the item partner relationship for those participants that responded to this item showed acceptable fit statistics in this scale (results not shown). Conversion keys are provided in Table VII.
|
Table IV. Fit statistics and item difficulties of the USER-Participation Satisfaction scale |
||||||||||||||||||||
|
|
Location |
1st threshold |
2nd threshold |
3rd threshold |
4th threshold |
Anchor Items |
|
Anchor Items + Work |
|
Anchor Items + Partner |
|
All Items |
||||||||
|
n |
Outfit MSQ |
Infit MSQ |
|
n |
Outfit MSQ |
Infit MSQ |
|
n |
Outfit MSQ |
Infit MSQ |
|
n |
Outfit MSQ |
Infit MSQ |
||||||
|
Leisure indoors |
–1.71 |
–3.08 |
–2.82 |
–2.28 |
1.34 |
1,455 |
0.99 |
1.04 |
|
960 |
0.99 |
1.05 |
|
1,119 |
0.97 |
1.03 |
|
776 |
0.97 |
1.03 |
|
Partner relationship |
–1.50 |
–3.61 |
0.61 |
– |
– |
n.a |
n.a |
n.a |
|
n.a |
n.a |
n.a |
|
1,133 |
1.21 |
1.18 |
|
778 |
1.21 |
1.16 |
|
Testlet relations |
–1.12 |
–3.22 |
–1.61 |
1.47 |
– |
1,549 |
1.17 |
1.16 |
|
966 |
1.16 |
1.13 |
|
1,133 |
1.07 |
1.06 |
|
778 |
1.10 |
1.07 |
|
Transportation |
–0.76 |
–2.81 |
–1.54 |
–0.98 |
2.29 |
1,425 |
0.94 |
0.95 |
|
954 |
0.96 |
0.98 |
|
1,100 |
0.96 |
0.99 |
|
772 |
0.97 |
0.99 |
|
Work/education |
–0.63 |
–3.36 |
2.10 |
– |
– |
n.a |
n.a |
n.a |
|
966 |
1.16 |
1.16 |
|
n.a |
n.a |
n.a |
|
778 |
1.19 |
1.20 |
|
Housekeeping |
–0.57 |
–3.10 |
–1.74 |
–0.62 |
3.18 |
1,408 |
1.05 |
1.04 |
|
942 |
1.12 |
1.07 |
|
1,083 |
1.09 |
1.07 |
|
762 |
1.14 |
1.09 |
|
Testlet outdoors |
–0.53 |
–2.64 |
–1.06 |
2.11 |
– |
1,549 |
0.79 |
0.81 |
|
966 |
0.73 |
0.74 |
|
1,133 |
0.78 |
0.79 |
|
778 |
0.71 |
0.72 |
|
Physical exercise |
–0.34 |
–2.13 |
–1.30 |
–0.34 |
2.40 |
1,400 |
1.05 |
1.05 |
|
939 |
1.09 |
1.10 |
|
1,086 |
1.05 |
1.06 |
|
763 |
1.05 |
1.06 |
|
Smith Cut-Off |
|
|
|
|
|
|
1.15 |
1.05 |
|
|
1.19 |
1.06 |
|
|
1.18 |
1.06 |
|
|
1.22 |
1.07 |
|
USER-Participation: Utrecht Scale for Evaluation of Rehabilitation-Participation; MSQ: mean square; n.a: not applicable. |
||||||||||||||||||||
Anchored analysis of the Satisfaction scale
Adding the item work/education and partner relationship (separately or together) for responders to 1 or both of those items resulted in acceptable item fit for all 3 models, i.e. anchor items plus work/education, anchor items plus partner relationship as well as for all items of the Satisfaction scale together (Table IV). Regarding the item work/education and partner relationship the response categories dissatisfied, neutral, and satisfied had to be collapsed for correct ordering (Fig. 2). All 3 models showed good fit except for 1 item (which overfit) (Table IV), good reliability (Table V) and no LID. DIF observed among the anchor items persisted only for the testlet relations and the testlet outdoors in the anchored analysis (Table VI). The testlet outdoor infit and outfit was below the acceptable boundary of 0.8 for all 3 analyses of the Satisfaction scale. Conversion keys for all models are provided in Table VIII.
|
Table V. Targeting of the USER-Participation Restrictions and Satisfaction scales |
||||
|
|
Mean |
Confidence interval |
Floor |
Ceiling |
|
Restrictions |
|
|
|
|
|
Anchor Items |
|
|
|
|
|
Ability |
–0.13 |
(–0.22; –0.03) |
140 |
246 |
|
Difficulty |
–1.94 |
(–3.09; –0.80) |
|
|
|
PSI |
0.80 |
|
|
|
|
Anchor Items + Work |
|
|
|
|
|
Ability |
0.13 |
(0.02; 0.24) |
44 |
188 |
|
Difficulty |
–1.76 |
(–2.83; –0.69) |
|
|
|
PSI |
0.84 |
|
|
|
|
Satisfaction |
|
|
|
|
|
Anchor Items |
|
|
|
|
|
Ability |
–0.04 |
(–0.13; 0.06) |
90 |
96 |
|
Difficulty |
–0.84 |
(–1.24; –0.44) |
|
|
|
PSI |
0.84 |
|
|
|
|
Anchor Items + Work |
|
|
|
|
|
Ability |
0.39 |
(0.28; 0.50) |
14 |
66 |
|
Difficulty |
–0.81 |
(–1.15; –0.46) |
|
|
|
PSI |
0.84 |
|
|
|
|
Anchor Items + Partner |
|
|
|
|
|
Ability |
0.20 |
(0.10; 0.30) |
25 |
78 |
|
Difficulty |
–0.93 |
(–1.32; –0.55) |
|
|
|
PSI |
0.84 |
|
|
|
|
Anchor Items + Work + Partner |
|
|
|
|
|
Ability |
0.40 |
(0.28; 0.52) |
13 |
54 |
|
Difficulty |
–0.90 |
(–1.24; –0.55) |
|
|
|
PSI |
0.85 |
|
|
|
|
USER-Participation: Utrecht Scale for Evaluation of Rehabilitation-Participation; PSI: Person Separation Index. |
||||
|
Table VI. Differential item functioning of the USER-Participation Restrictions and Satisfaction scales |
|||||||||
|
|
Work/education |
Housekeeping |
Transportation |
Physical exercise |
Leisure indoors |
Visits to family or friends |
Visits from family or friends |
Telephone/computer contacts |
Testlet outdoors |
|
Restrictions |
|
|
|
|
|
|
|
|
|
|
Sex |
|
|
|
|
1 |
|
|
|
|
|
Age |
|
|
|
|
|
|
|
|
|
|
SCI type |
|
|
|
|
1 |
|
|
|
|
|
SCI degree |
|
1, 2 |
|
|
|
|
|
|
|
|
Age at SCI |
2 |
1 |
|
1 |
|
|
|
|
|
|
Time since injury |
|
|
|
|
|
|
|
|
|
|
Language |
|
|
|
|
|
|
|
|
|
|
Questionnaire type |
|
|
|
|
|
|
|
|
1 |
|
|
Work/education |
Housekeeping |
Transportation |
Physical exercise |
Leisure indoors |
Partner relationship |
Testlet relations |
Testlet outdoors |
|
|
Satisfaction |
|
|
|
|
|
|
|
|
|
|
Sex |
|
|
1 |
|
|
|
1, 2 |
|
|
|
Age |
|
|
|
|
|
|
|
|
|
|
SCI type |
|
|
|
|
|
|
|
|
|
|
SCI degree |
|
|
|
|
|
|
|
|
|
|
Age at SCI |
|
|
|
|
|
|
|
|
|
|
Time since injury |
|
|
|
|
|
|
|
|
|
|
Language |
|
4 |
|
1 |
|
|
|
1, 3 |
|
|
Questionnaire type |
|
|
|
|
|
|
|
|
|
|
USER-Participation: Utrecht Scale for Evaluation of Rehabilitation-Participation; SCI: spinal cord injury. 1 = anchor items; 2 = anchor + work/education; 3 = anchor items + partner relationship; 4 = anchor items + work/education + partner relationship. |
|||||||||
|
Table VII. Conversion key for the USER-Participation Restrictions scale |
|||||
|
True Score |
Anchor Items |
|
Anchor Items + Work |
||
|
Ability |
0–100 score |
|
Ability |
0–100 Score |
|
|
0 |
–6.17 |
0 |
|
–6.18 |
0 |
|
1 |
–5.68 |
5 |
|
–5.69 |
5 |
|
2 |
–5.19 |
11 |
|
–5.20 |
10 |
|
3 |
–4.71 |
16 |
|
–4.73 |
15 |
|
4 |
–4.28 |
20 |
|
–4.30 |
20 |
|
5 |
–3.86 |
25 |
|
–3.89 |
24 |
|
6 |
–3.45 |
29 |
|
–3.50 |
28 |
|
7 |
–3.05 |
33 |
|
–3.12 |
32 |
|
8 |
–2.68 |
37 |
|
–2.77 |
36 |
|
9 |
–2.33 |
41 |
|
–2.44 |
39 |
|
10 |
–1.99 |
45 |
|
–2.13 |
43 |
|
11 |
–1.66 |
48 |
|
–1.82 |
46 |
|
12 |
–1.34 |
52 |
|
–1.53 |
49 |
|
13 |
–1.02 |
55 |
|
–1.24 |
52 |
|
14 |
–0.70 |
59 |
|
–0.95 |
55 |
|
15 |
–0.39 |
62 |
|
–0.67 |
58 |
|
16 |
–0.06 |
66 |
|
–0.38 |
61 |
|
17 |
0.28 |
69 |
|
–0.09 |
64 |
|
18 |
0.65 |
73 |
|
0.22 |
68 |
|
19 |
1.08 |
78 |
|
0.54 |
71 |
|
20 |
1.61 |
84 |
|
0.90 |
75 |
|
21 |
2.34 |
91 |
|
1.32 |
79 |
|
22 |
3.14 |
100 |
|
1.83 |
85 |
|
23 |
|
|
|
2.52 |
92 |
|
24 |
|
|
|
3.29 |
100 |
|
USER-Participation: Utrecht Scale for Evaluation of Rehabilitation-Participation. |
|||||
|
Table VIII. Conversion key for the USER-Participation Satisfaction scale |
|||||||||||
|
True score |
Anchor Items |
|
Anchor Items + Work |
|
Anchor Items + Partner |
|
Anchor Items + Work + Partner |
||||
|
Ability |
0–100 score |
|
Ability |
0–100 score |
|
Ability |
0–100 score |
|
Ability |
0–100 score |
|
|
0 |
–4.91 |
0 |
|
–5.15 |
0 |
|
–5.21 |
0 |
|
–5.39 |
0 |
|
1 |
–4.25 |
7 |
|
–4.47 |
7 |
|
–4.51 |
7 |
|
–4.70 |
7 |
|
2 |
–3.70 |
13 |
|
–3.89 |
13 |
|
–3.93 |
13 |
|
–4.12 |
13 |
|
3 |
–3.31 |
17 |
|
–3.49 |
17 |
|
–3.52 |
18 |
|
–3.69 |
17 |
|
4 |
–3.00 |
21 |
|
–3.17 |
20 |
|
–3.20 |
21 |
|
–3.36 |
21 |
|
5 |
–2.73 |
24 |
|
–2.90 |
23 |
|
–2.92 |
24 |
|
–3.08 |
23 |
|
6 |
–2.47 |
26 |
|
–2.65 |
26 |
|
–2.67 |
26 |
|
–2.83 |
26 |
|
7 |
–2.23 |
29 |
|
–2.41 |
28 |
|
–2.43 |
29 |
|
–2.60 |
28 |
|
8 |
–1.98 |
32 |
|
–2.18 |
31 |
|
–2.19 |
31 |
|
–2.37 |
31 |
|
9 |
–1.74 |
34 |
|
–1.94 |
33 |
|
–1.96 |
34 |
|
–2.15 |
33 |
|
10 |
–1.49 |
37 |
|
–1.71 |
36 |
|
–1.73 |
36 |
|
–1.92 |
35 |
|
11 |
–1.24 |
40 |
|
–1.47 |
38 |
|
–1.49 |
39 |
|
–1.70 |
37 |
|
12 |
–0.97 |
42 |
|
–1.22 |
41 |
|
–1.25 |
41 |
|
–1.47 |
40 |
|
13 |
–0.68 |
46 |
|
–0.96 |
43 |
|
–1.00 |
44 |
|
–1.23 |
42 |
|
14 |
–0.34 |
49 |
|
–0.68 |
46 |
|
–0.72 |
47 |
|
–0.99 |
44 |
|
15 |
0.05 |
54 |
|
–0.35 |
50 |
|
–0.42 |
50 |
|
–0.72 |
47 |
|
16 |
0.53 |
59 |
|
0.03 |
54 |
|
–0.07 |
54 |
|
–0.42 |
50 |
|
17 |
1.08 |
65 |
|
0.47 |
58 |
|
0.33 |
58 |
|
–0.09 |
54 |
|
18 |
1.64 |
71 |
|
0.96 |
63 |
|
0.78 |
62 |
|
0.29 |
57 |
|
19 |
2.20 |
77 |
|
1.46 |
69 |
|
1.26 |
67 |
|
0.71 |
62 |
|
20 |
2.81 |
83 |
|
1.95 |
74 |
|
1.76 |
73 |
|
1.14 |
66 |
|
21 |
3.57 |
91 |
|
2.45 |
79 |
|
2.28 |
78 |
|
1.58 |
70 |
|
22 |
4.36 |
100 |
|
3.01 |
85 |
|
2.86 |
84 |
|
2.03 |
75 |
|
23 |
|
|
|
3.72 |
92 |
|
3.61 |
92 |
|
2.51 |
80 |
|
24 |
|
|
|
4.49 |
100 |
|
4.39 |
100 |
|
3.05 |
85 |
|
25 |
|
|
|
|
|
|
|
|
|
3.75 |
92 |
|
26 |
|
|
|
|
|
|
|
|
|
4.51 |
100 |
|
USER-Participation: Utrecht scale for Evaluation of Rehabilitation-Participation. |
|||||||||||
Dimensionality of the USER-Participation
After refinement of the scales, unidimensionality of the USER-Participation Restrictions and Satisfaction scales were confirmed with a principal component analysis of the residuals with second factor eigenvalues of 1.38 and 1.26, respectively. The PCA of the residuals of the anchored Rasch analyses also showed unidimensionality with second eigenvalues of <1.40 for both scales.
DISCUSSION
This study evaluated the metric properties of the USER-Participation in a Swiss SCI population from a classical and item response theory perspective. Generally satisfactory basic metric properties of the USER-Participation were found. The Restrictions and Satisfaction scales had satisfactory internal consistency with excellent reliability according to De Wolf et al. (32). Only the Frequency scale showed internal consistency below the recommended 0.70 level, and low correlations between the items on vocational activities. These findings are in line with previous validation studies of the USER-Participation (13, 15). The underlying reason is probably that performing one activity competes with performing another, given the boundaries of limited time availability. High internal consistency has been described to be less relevant if items reflect different aspects of a complex construct, such as participation (15, 19, 33). Given that different participation activities are segregated, the Frequency scale is reminiscent of a formative measurement model. In formative measurement models, items jointly contribute to a latent construct, while the all-inclusive meaning is derived from the measured items (34, 35). In the case that the formative latent construct is represented by exclusive indicators reflecting heterogeneous causes (34, 36) formative variables are not necessarily correlated. The formative measurement model concept is applicable to the Frequency scale of the USER-Participation, in which all items can jointly be considered as useful indicators of the frequency of participation, while the frequency of distinct items, such as, for instance, going out and paid work, are not inevitably correlated. Regarding a formative measurement model, the Frequency scale provides important descriptive information with respect to engagement in certain activities. However, our results indicate that this scale does not provide a valid summary score for the degree of participation in the Swiss SCI population.
In the present study the anchor method was applied to appropriately account for items within the USER-Participation Restrictions and Satisfaction scales that are not applicable to some of the participants. This approach is important in Rasch analysis, because ignoring structural missing by the recoding and treatment of not applicable items as missing values may lead to bias and misleading inference regarding ability scores. Of note, this issue has been ignored in Rasch analysis of other participation measures, such as the World Health Organization Disability Assessment Schedule (WHODAS II) and the Impact on Participation and Autonomy scale, which similarly faced structural missing regarding work-related items (37, 38). By excluding such key domains of participation, content validity may be affected. Lund et al. suggested a separate scale for work-related items for the Impact on Participation and Autonomy scale (39). Regarding the Participation scale, best model fit was also found for a separate scale with work-related items (40, 41). The methodology used in the present study offers a valid alternative to the exclusion or separation of problematic (but regarding content validity, important) items.
Disordered thresholds, local item dependencies and differential item functioning were found for some items of the Restrictions and Satisfaction scales that could be solved by collapsing response categories and forming testlets. A possible explanation may be that participants were unable to differentiate between response options. Poor item fit indicates that the performance on these items cannot adequately be predicted by the person’s ability derived from the Rasch model. From a conceptual point of view, the items going out and outdoor activities as well as the items family relationships and friends/acquaintances cover similar aspects of participation and forming a testlet solved these problems. The anchoring approach worked well for the Satisfaction scale. All tested models of the Satisfaction scale, i.e. anchor items plus work/education, anchor items plus partner relationship as well as for all items, showed generally good fit (with few exceptions), good reliability, no LID and unidimensionality. Concerning the Restrictions scale, no items showed underfit in any of the analyses, and 2 items showed overfit to the model: telephone/computer contact in both analyses and visits to family and friends in the analysis of the anchor items + work/education. The anchoring approach did not work for the item partner relationship. The poor fit of the item partner relationship of the Restrictions scale may result from diverging interpretations. Participants might understand this question in the context of restrictions in creating a relationship or in maintaining a relationship. Participants might also interpret this item as a more physical problem with intercourse. However, this item has to be further validated in future studies.
The analysis of DIF revealed no systematic DIF for all models of both scales. The Restrictions scale was more sensitive to injury-related characteristics, whereas the Satisfaction varied mainly across socio-demographic or questionnaire-related variables. The suitability of DIF analyses (42, 43) regarding SCI level and SCI degree in the Restrictions scale might be questionable since the latent trait is intuitively associated with the severity of SCI. This has also been discussed extensively in a study investigating the metric properties of items included in the analysis of the functioning profile and the self-report version of the Spinal Cord Independence Measure (SCIM-SR) (44, 45) in this issue. Furthermore, future research should clarify whether DIF related to questionnaire language is related to translation issues or cultural differences.
Targeting showed a shift towards higher abilities for both scales, indicating that items do not completely match the expected participant’s abilities. This is also indicated by the higher proportion of maximum scores compared with minimum scores for both scales. Person ability and item difficulty patterns might diverge due to the heterogeneous characteristics of the study population (32). Among all participants, 68.6% were paraplegics and 57.7% had an incomplete lesion, which may partially explain the high ability level of our sample in regard to restrictions and satisfaction with participation. Social support may play a key role with regards to participation, in that individuals with insufficient access to social support may be more likely to perceive participation problems (46). Important contextual factors further include assistive devices, such as wheelchair or modern information and communication technology, which enable individuals with severe SCI to work, chat with friends or perform leisure activities.
A major strength of the present study is the use of an anchoring approach to include the items that inherently encounter structural missing, such as work/education and partner relationship. This study presents an approach to how to deal with such items and provides conversion keys to enable use of the USER-Participation for the collection of data in epidemiological studies. Furthermore, the sample size in the present study is large. The examination of properties of the USER-Participation from a Classical Test Theory and Item Response Theory perspective allowed us to go beyond the mere testing of the reliability and item total correlations and included a probabilistic approach of measurement, which takes into account the difficulty of items and ability of persons in evaluating the consistency of the metric properties of the questionnaire. DIF analysis with regard to language and questionnaire type is a further strength providing justification for the use of an instrument in a multilingual population, such as in Switzerland. Also, invariance of the mode of administration confirms that derived ability scores are unbiased with regards to the response mode chosen by participants.
In conclusion, this study showed that the basic metric properties of the USER-Participation Restrictions and Satisfaction scales are satisfactory. However, internal consistency of the Frequency scale is limited. Nevertheless, our findings revealed that the item partner relationship requires further attention. Future research should focus on the use of the USER-Participation as an outcome measure in different clinical settings, epidemiological studies and diagnostic groups.
ACKNOWLEDGEmeNTS
The authors would like to thank Veronika Lay for her assistance in data analysis.
Financial support: This study was funded by Swiss Paraplegic Research, Nottwil, Switzerland. G. Michel received structural financial support from the Domarena Foundation.
The authors declare no conflicts of interest.
REFERENCES

