Jane Dahm, BSc(Hons)1 and Jennie Ponsford, PhD1,2
From the 1School of Psychological Sciences, Monash Universityand 2Monash-Epworth Rehabilitation Research Centre, Epworth HealthCare, Melbourne, Australia
OBJECTIVE: To investigate the trajectory and predictors of employment over a period of 10 years following traumatic brain injury and traumatic orthopaedic injury.
DESIGN: Prospective follow-up at 1, 2, 5 and 10 years post-injury.
PARTICIPANTS: Seventy-nine individuals with traumatic brain injury and 79 with traumatic orthopaedic injury recruited from Epworth HealthCare in Melbourne, Australia during inpatient rehabilitation.
METHODS: Information was obtained from medical files and self-report questionnaires.
RESULTS: Individuals with traumatic brain injury were less likely to be competitively employed during the period up to 10 years post-injury compared with individuals with traumatic orthopaedic injury, although there was evidence of increasing employment participation during that time. More severe traumatic brain injury, older age, pre-injury psychological treatment, and studying or having a blue-collar occupation at time of injury were associated with poorer employment outcomes. Individuals with traumatic brain injury had spent less time with their current employer and were less likely to have increased responsibility since the injury than those with traumatic orthopaedic injury. At least half of each group reported difficulty at work due to fatigue.
CONCLUSION: Given the potential for gains in employment participation over an extended time-frame, there may be benefit in ongoing access to individualized vocational rehabilitation. Particular areas of focus would include managing fatigue and psychiatric disorders, and exploring supported occupational activity for all levels of injury severity.
Key words: traumatic brain injury; orthopaedics; employment; prospective studies.
J Rehabil Med 2015; 47: 932–940
Correspondence address: Jane Dahm, School of Psychological Sciences, Building 17, Monash University, Clayton, Victoria, 3800, Australia. E-mail: janedahm@bigpond.com
Accepted Jul 31, 2015; Epub ahead of print Nov 6, 2015
INTRODUCTION
Employment following traumatic brain injury (TBI) is an important aspect of participation (1) associated with better quality of life and psychosocial outcomes (2, 3). It is especially vital given that most individuals who sustain a TBI are of working age. Whilst there has been extensive reporting of employment outcomes up to 2 years following TBI, few studies have explored long-term employment outcomes. At 5 years or more post-TBI, reported employment rates range from 34% to 61% (4–7), with variation partly attributable to differences in injury severity, time post-injury, and definitions of employment across studies. In addition to difficulties obtaining employment, there are subsequent problems maintaining employment and gaining advancement (5). Changes in employment status can be impacted by capacity to work, as well as by life stage factors, such as transition to retirement or homemaking (6), which are often not captured in studies.
Other injuries frequently occur in conjunction with TBI. Whilst comorbid injuries, especially orthopaedic limb injuries, contribute to poorer outcomes over the first year following TBI (8), their influence seems to reduce over the longer term (4, 9). There are similarities, however, between patterns of employment following TBI and polytrauma (10–14). Given that studies of polytrauma include varying degrees of TBI, the extent to which these outcomes are influenced by TBI is unclear. Conversely, studies of TBI do not usually consider the influence of comorbid injuries. It is difficult, therefore, to identify the unique contribution of TBI in the context of other injuries, and how this evolves over time.
There is potential for ongoing improvement in return to work (RTW) for at least 5 years following polytrauma (11, 15), with a median time of up to 48 months for RTW (11). Hence, there is a need to understand the trajectory of employment status over an extended time-frame in a way that differentiates the contribution of TBI and comorbid injuries; in particular orthopaedic trauma, which has previously been used as a form of trauma control group in studies of TBI. This may assist in developing the most effective approaches to rehabilitation.
The aim of this study was to prospectively investigate the trajectory of employment status over 10 years for individuals with TBI and traumatic orthopaedic injury (TOI). A related aim was to study the nature of employment at 10 years post-injury. Based on the literature, and in keeping with the International Classification of Functioning, Disability and Health (ICF) framework (1), it was hypothesized that participation in employment would be negatively influenced by severity of TBI and TOI in the context of personal and environmental factors. It was further hypothesized that 10 years post-injury individuals with TBI would report lower rates of competitive employment with less stability, and would experience more difficulties at work than individuals with TOI.
METHODS
Participants
Individuals from Epworth HealthCare in Melbourne, Australia receiving inpatient rehabilitation following TOI or TBI were invited to participate in a longitudinal outcome study. All rehabilitation in this setting was provided in the context of an accident compensation system providing funding (regardless of fault or socio-economic status) for hospital, medical and rehabilitation costs; support for return to work or study, including funded work trials and integration aides; attendant care support; and other services as justified. Inclusion criteria were being aged 16 years or over, with sufficient English and cognitive abilities to complete questionnaires. Individuals with spinal cord injuries, major burns, traumatic amputations or any neurological disorder other than TBI were excluded. Participants in the TBI group had sustained complicated mild to severe TBI. Participants in the TOI group were excluded if they had sustained a brain injury other than uncomplicated mild TBI (mTBI; Glasgow Coma Scale (GCS) score 13–15 on acute hospital admission and post-traumatic amnesia (PTA) less than 24 h with no abnormal findings on computed tomography (CT)). The distinction between complicated and uncomplicated mTBI ensured that there was no overlap in severity of brain injury between the TOI and TBI groups.
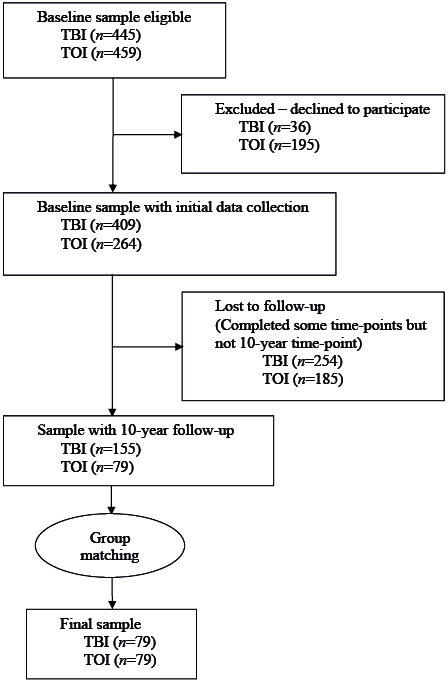
Participants in the TBI and TOI groups were invited to complete follow-up questionnaires at 1, 2, 5 and 10 years post-injury. Individuals who completed the 10-year follow-up and were not retired or non-vocational (i.e. unable to work) pre-injury, were included. Hence, participants were in the labour force (employed or unemployed) or otherwise productive, such as studying or homemaking, at time of injury. Non-retirees were included as they may subsequently enter or return to employment. Seventy-nine participants with TOI completed the 10-year follow-up. The same number of participants with TBI was selected from the pool available and group matched on age, education and gender. A recruitment tree is shown in Fig. 1.
Compared with all eligible patients with TOI admitted for rehabilitation, the TOI sample did not differ in severity of orthopaedic injury (Bethesda Scale of Fracture Severity; 16) or education; however, the sample comprised fewer females (χ2 = 4.51, p = 0.03), with older age at injury (t = 2.78, p = 0.01) and higher Injury Severity Scores (ISS; 17) (t = 2.57, p = 0.01). Compared with all eligible patients with TBI, the TBI sample did not differ with regard to gender or PTA, but had older age at injury (t = 3.03, p = 0.003), higher education (t = 2.90, p = 0.004) and higher GCS score (t = 2.07, p = 0.04).
Procedure
Ethics approval was obtained from Epworth HealthCare and Monash University. Participants provided written informed consent. Demographic, employment and injury information was obtained from medical files and questionnaires completed by participants. The Structured Outcome Questionnaire (17) was sent by post, completed over the phone, or completed in a face-to-face interview, depending on participant preference and capability.
Measures
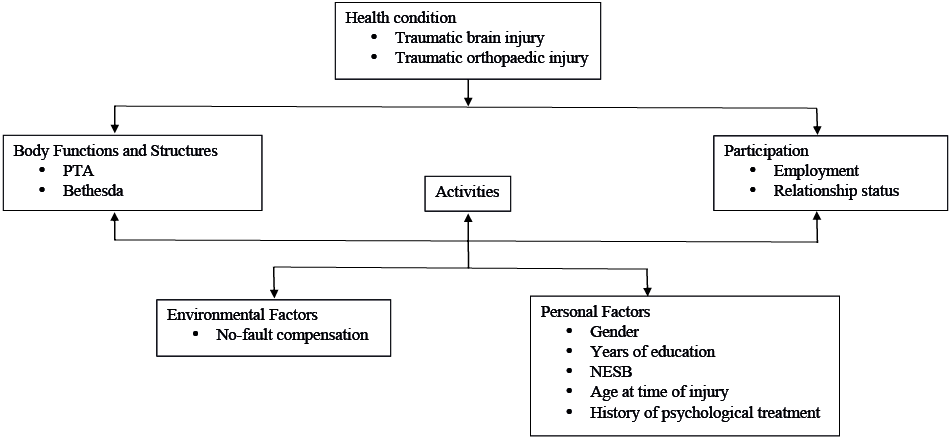
Measures were contextualized within the biopsychosocial framework of the ICF (1), as outlined in Fig. 2. Body Functions and Structures were operationalized as measures of injury severity. Personal pre-injury factors comprised gender, age at injury, non-English speaking background (NESB), years of education, and history of psychological treatment. Having received rehabilitation in the context of a no-fault compensation scheme was an environmental factor for all participants in this study. Participation was measured at each time-point in terms of being in a relationship and the major life area of employment.
Injury measures. The Injury Severity Score (ISS) (18) is an anatomical injury measure calculated from the sum of squares of the Abbreviated Injury Score for the 3 most severely injured body regions. Possible scores range from 0 to 75. ISS excluding brain injury was also calculated to provide a measure of orthopaedic and other injury severity.
Severity of TBI was measured using duration of PTA, determined prospectively in days using the Westmead PTA Scale (19). TBI severity was classified as mild to moderate for PTA up to 24 h, severe 1–7 days, very severe 1–4 weeks, and extremely severe more than 4 weeks (20).
Orthopaedic injury was measured using the Bethesda Scale of Fracture Severity, which has been reported as having good inter-rater reliability (Bethesda, 16). This scale was developed and validated to rate the severity of the worst orthopaedic injury, with scoring as shown in Table I.
|
Table I. Bethesda Scale of Fracture Severity |
|
|
Score |
Criteria |
|
0 |
No orthopaedic injury |
|
1 |
An uncomplicated fracture with no major joint disruption, no motor loss and no significant tissue injury |
|
2 |
Multiple uncomplicated fractures, excluding joint surface disruption or nerve lesion |
|
3 |
A fracture involving major joint surface, including minor nerve lesions |
|
4 |
A severe crush fracture or major soft tissue lesion, including severe nerve lesions |
Employment measures. Employment status was recorded pre-injury and at 1, 2, 5 and 10 years post-injury. Categories of employment were full-time, part-time and casual employment; unemployed; non-vocational (unable to work); student; retired or homemaking. This measure was dichotomized, with an individual considered as employed if they were engaged in paid employment of any type. Individuals not in the labour force, due to retirement or homemaking, and students were included in the not employed category.
Each participant’s pre-injury occupation was classified into 1 of 8 groups according to the Australian and New Zealand Standard Classification of Occupations (21), which were then aggregated into white-collar and blue-collar occupations. An additional category of student was included, to incorporate those studying pre-injury.
For individuals employed 10 years post-injury, employment characteristics were recorded (e.g. hours worked per week, stability of employment as number of months with current employer and number of jobs in previous year) as well as self-reported difficulties at work compared with pre-injury.
Data analysis
Data analysis was conducted using Stata/IC Version 13 (StatCorp LP, Texas, US). For bivariate analyses, Pearson’s and Spearman rank correlations, independent t-tests, and χ2 were used. Multinomial logistic regression was used to model being employed as a function of personal and injury-related factors at 10 years post-injury. Random effects regression was utilized to model employment status from pre-injury to 10 years post-injury as a function of time and biopsychosocial factors. All participants were pooled for regression analyses, with measures of TBI and orthopaedic injury severity as independent variables. This enabled investigation of the contribution of brain and orthopaedic injuries that may be coexistent.
RESULTS
Participants, group comparisons and injury profile
Participant demographic and injury-related details are shown in Table II. Preliminary analyses identified no significant difference between TBI and TOI groups in terms of gender, education, NESB, pre-injury employment status, or age at time of injury. ISS for the TBI group was greater than that for the TOI group (t = 6.70, p < 0.001), although there was no difference between groups for ISS excluding brain injury (t = 1.67, p = 0.10). Thus, using conventional injury severity scoring, there was no difference between groups for injuries other than TBI. Bethesda scores indicated that the TOI group had sustained more severe orthopaedic injuries (t = 5.84, p < 0.001).
|
Table II. Demographic and injury profile of participants in each injury group |
||
|
TOI (n = 79) |
TBI (n = 79) |
|
|
Age at injury, years, mean (SD) |
39.0 (13.9) |
35.0 (13.1) |
|
Male gender, n (%) |
44 (56) |
49 (62) |
|
Years of education, mean (SD) |
12.5 (3.1) |
12.2 (2.5) |
|
Non-English speaking background, n (%) |
8 (10) |
9 (11) |
|
Pre-injury psychological treatment, n (%) |
13 (17) |
9 (11) |
|
Cause of injury, n (%) Traffic accidents Falls Other |
71 (90) 4 (5) 4 (5) |
72 (91) 2 (3) 5 (6) |
|
Brain injury severitya, n (%) Nil Uncomplicated mild TBIb Complicated mild–severe TBI Very severe TBI Extremely severe TBI ISS, mean (SD) ISS excluding TBI, mean (SD) Bethesda, mean (SD) |
41 (52) 38 (48) – – – 14.4 (8.0) 13.3 (8.1) 2.6 (0.9) |
– – 29 (37) 20 (25) 30 (38) 24.2 (10.2) 10.9 (9.6) 1.5 (1.3) |
|
AIS extremity, mean (SD) Locations of injury, n (%) Face Chest Abdomen/pelvis Spine Limb |
2.5 (0.9) 31 (41) 25 (32) 30 (38) 17 (22) 73 (92) |
1.5 (1.4) 42 (53) 33 (42) 15 (19) 22 (28) 55 (70) |
|
aBrain injury severity classified according to PTA duration: mild to moderate < 1 day, severe 1 to 7 days, very severe > 7–28 days, extremely severe > 28 days. Nil = orthopaedic injury without any brain injury. bUncomplicated mild TBI: GCS score of 13–15 on acute hospital admission, PTA< 24 h, with no abnormal CT findings. TOI: traumatic orthopaedic injury; TBI: traumatic brain injury; ISS: Injury Severity Score; Bethesda: Bethesda Scale of Fracture Severity score; AIS: Abbreviated Injury Score; SD: standard deviation; PTA: post-traumatic amnesia; GCS: Glasgow Coma Scale. |
||
Participants were further classified according to severity of brain injury, as summarized in Table II. The number of individuals with complicated mild or moderate TBI was small (n = 8) so these were combined with the severe TBI group for subsequent analyses. There was a significant correlation between brain injury severity categories and Bethesda score, with higher TBI severity associated with lower severity of orthopaedic injury (rs= –0.30, p < 0.001).
Pre-injury employment
Pre-injury employment and occupation classifications and categories are presented in Table III. There were no significant group differences in pre-injury employment status (χ2 = 5.02, p = 0.29), occupation classification (χ2 = 7.52, p = 0.48), or type (χ2 = 3.38, p = 0.19).
|
Table III. Pre-injury employment status and occupation classifications for individuals with traumatic orthopaedic injury (TOI) and traumatic brain injury (TBI) |
||
|
TOI n (%) |
TBI n (%) |
|
|
Employment status |
||
|
Employed |
69 (87) |
65 (82) |
|
Full-time employment |
55 (70) |
56 (71) |
|
Part-time employment |
6 (8) |
7 (9) |
|
Casual employment |
8 (10) |
2 (3) |
|
Not employed |
10 (13) |
14 (18) |
|
Unemployed |
4 (5) |
8 (10) |
|
Student |
6 (8) |
6 (8) |
|
Homemaking |
0 |
0 |
|
Occupation type |
|
|
|
White-collar |
47 (60) |
36 (46) |
|
Managers |
10 (13) |
6 (8) |
|
Professionals |
17 (22) |
16 (20) |
|
Community and personal service workers |
8 (10) |
4 (5) |
|
Clerical and administrative workers |
10 (13) |
10 (13) |
|
Sales workers |
2 (3) |
0 (0) |
|
Blue-collar |
26 (33) |
37 (47) |
|
Technicians and trade workers |
10 (13) |
18 (23) |
|
Machinery operators and drivers |
8 (10) |
7 (9) |
|
Labourers |
8 (10) |
12 (15) |
|
Student |
6 (8) |
6 (8) |
|
TOI: traumatic orthopaedic injury; TBI: traumatic brain injury. |
||
Employment 10 years post-injury
Employment status at 10 years post-injury is shown in Table IV. Compared with pre-injury, employment rates for both groups had reduced. No participants were students; however, employment status now included being non-vocational (i.e. unable to work because of the injury) and not in the labour force due to retirement or homemaking, reflecting injury and life stage changes. Whilst the difference in employment rate between groups was not significant (χ2 = 0.67, p = 0.41), reasons for not being employed differed, with more individuals with TOI having transitioned out of the labour force, and more individuals with TBI being non-vocational or unemployed.
Considering only those individuals in the labour force at 10 years post-injury, there was a significant difference between injury groups (χ2 = 14.71, p = 0.01), with a substantially lower proportion of the TBI group employed than the TOI group. Notable differences were twice as many participants with TBI than TOI being non-vocational, and 4 times as many being unemployed. National unemployment rates over a corresponding time-frame were between 5.2% and 8.1% (22).
|
Table IV. Employment status at 10 years post-injury for each injury group |
||
|
TOI n (%) |
TBI n (%) |
|
|
Whole sample |
n = 79 |
n = 79 |
|
Employed Full-time Part-time |
51 (65) 36 (46) 15 (19) |
46 (58) 30 (38) 16 (20) |
|
Unemployed |
2 (3) |
8 (10) |
|
Non-vocational |
9 (11) |
18 (23) |
|
Not in the labour force Retired Homemaking |
17 (22) 10 (13) 7 (9) |
7 (9) 7 (9) 0 (0) |
|
Subset of individuals in the labour force |
n = 62 |
n = 72 |
|
Employed Full-time Part-time |
51 (82) 36 (58) 15 (24) |
46 (64) 30 (42) 16 (22) |
|
Unemployed |
2 (3) |
8 (11) |
|
Non-vocational |
9 (15) |
18 (25) |
|
TOI: traumatic orthopaedic injury; TBI: traumatic brain injury. |
||
Multinomial regression analysis was used to model the probability of each employment status at 10 years post-injury for the total sample. The model comprised being in a relationship pre-injury as well as at 10 years post-injury, pre-injury occupation type, age at injury, education, NESB, history of psychological treatment, TBI severity, and severity of orthopaedic injuries. Gender and education were excluded from the analysis due to their associations with other factors; specifically, individuals with more severe TBI were more likely to be male (80% of those with very severe and 70% with extremely severe TBI), individuals with blue-collar occupations were 6 times more likely to be male, and there was a strong correlation between higher education and white-collar occupation (r = 0.51, p < 0.001). The overall model was significant (χ2 = 181.06, p < 0.001, log likelihood = –152.59), with relative risk ratios for each employment status against a reference of full-time employment shown in Table V.
|
Table V. Relative risk ratios for model predicting employment status at 10 years post-injury against a reference of full-time employment (n = 158) |
|||||
|
Part-time |
Unemployed |
Non-vocational |
Not in labour force |
||
|
Homemakinga |
Retired |
||||
|
Age at time of injury |
1.06* |
1.06 |
1.10** |
0.76* |
1.66*** |
|
NESB |
0.98 |
1.57 |
1.07 |
< 0.001 |
1.53 |
|
Pre-injury psychological treatment |
9.14* |
56.60** |
20.76** |
15.44 |
12.39 |
|
Relationship at time of injury |
2.49 |
0.30 |
2.19 |
8.92 |
2.38 |
|
Relationship at 10 years post-injury |
1.11 |
3.74 |
0.34 |
1.64 |
1.56 |
|
Occupation (reference white-collar) Blue-collar Student |
1.87 5.65 |
33.95** 116.76** |
6.48** 15.74* |
0.07 11.69 |
2.15 0.002 |
|
Bethesda |
1.16 |
0.97 |
1.44 |
0.87 |
0.30 |
|
TBI severity |
1.36 |
2.49* |
2.11** |
0.09 |
0.95 |
|
*p < 0.05, **p < 0.01, ***p < 0.001. aAll 7 participants in this category were female. NESB: non-English speaking background; TBI: traumatic brain injury; Bethesda: Bethesda Scale of Fracture Severity score. |
|||||
As reported in Table VI, comparison of employment characteristics at 10 years post-injury showed little difference between injury groups, except for individuals with TOI reporting more months with their current employer and being more likely to report a change in responsibilities since the injury; generally an increase in responsibility. Given that age could contribute to difficulties experienced at work, the analyses were repeated using analysis of variance (ANOVA), controlling for age with no change in the results.
|
Table VI. Comparison between injury groups of employment characteristics at 10 years post-injury |
|||
|
TOI (n = 79) |
TBI (n = 79) |
Significance level |
|
|
Hours of work per week, mean (SD) median (range) |
35.3 (18.5) 40 (0–90) |
33.9 (16.0) 38 (3–60) |
t = 0.41, p = 0.68 |
|
Months with current employer, mean (SD) median (range) |
128.2 (148.3) 72 (0–528) |
65.2 (72.0) 36 (1–360) |
t = 2.58, p = 0.01 |
|
Number of jobs in the last year, mean (SD) |
1.3 (0.8) |
1.7 (1.8) |
t = 1.63, p = 0.11 |
|
Responsibilities changeda, % |
86 |
66 |
χ2 = 5.27, p = 0.02 |
|
Make more mistakes, % |
14 |
18 |
χ2 = 0.25, p = 0.61 |
|
More trouble getting on with people, % |
16 |
22 |
χ2 = 0.59, p = 0.44 |
|
More difficulty keeping up, % |
27 |
17 |
χ2 = 1.40, p = 0.24 |
|
More fatigue, % |
59 |
51 |
χ2 = 0.58, p = 0.45 |
|
Satisfied with work, % |
16 |
11 |
χ2 = 0.54, p = 0.46 |
|
Opportunities for promotion or career advancement, % |
49 |
54 |
χ2 = 0.20, p = 0.66 |
|
aParticipants responded whether responsibilities had changed or not. Descriptions of the nature of change indicated that in most cases responsibilities increased. TOI: traumatic orthopaedic injury; TBI: traumatic brain injury; SD: standard deviation. |
|||
Changes in employment over time
Personal and pre-injury information was available for all participants. For participants in the TOI group, 72 completed questionnaires at 1 year, 57 at 2 years, 35 at 5 years, and 79 at 10 years post-injury. For participants in the TBI group, 42 completed questionnaires at 1 year, 63 at 2 years, 48 at 5 years, and 79 at 10 years post-injury. The number of observations per participant ranged from 2 to 5, with a mean value of 4. All data-points were used in the random effects regression modelling dichotomized employment from pre-injury to 10 years post-injury. Fig. 3A shows the proportion employed at each time-point for each level of TBI severity, while Fig. 3B shows the proportion employed after excluding those not in the labour force.
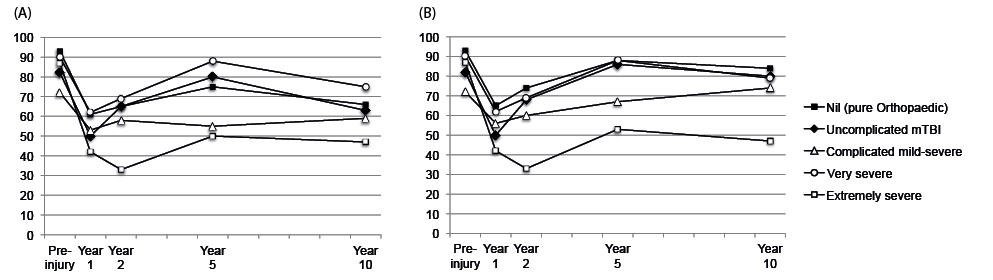
Fig 3. (A) percentage of all participants employed and (B) percentage of all participants in the labour force employed at each time point, grouped by TBI severity.
Preliminary investigation suggested that the pattern over time was not linear. A coefficient of year squared was subsequently included in the model together with year post-injury. Constant factors were age at injury, NESB, prior psychological treatment, pre-injury occupation type, severity of TBI, and severity of orthopaedic injuries. Being in a relationship was included in the model at each time-point. Table VII shows the results of the analysis. The overall model was significant, (χ2 = 66.44, p < 0.001). Factors significantly associated with reduced likelihood of being employed were older age at injury, having pre-injury psychological treatment, studying or having a blue-collar rather than white-collar occupation pre-injury, and having a more severe TBI. There was a linear decline in post-injury employment from pre-injury levels, as indicated in Table VII by the odds ratio for year post-injury being less than 1, together with a positive non-linear (quadratic) trajectory, as indicated in Table VII by the odds ratio for year post-injury squared being greater than 1. The significant personal factors were the same as those associated with being unemployed or non-vocational in the multinomial regression analysis at 10 years post-injury (see Table V).
|
Table VII. Summary of mixed effects logistic regression of being employed on time, personal factors and injury-related factors |
|||
|
OR |
p |
95% CI |
|
|
Time |
|||
|
Year |
0.59 |
< 0.001 |
0.46–0.76 |
|
Year2 |
1.04 |
< 0.001 |
1.02–1.07 |
|
Age at injury |
0.96 |
0.001 |
0.94–0.98 |
|
NESB |
0.74 |
0.52 |
0.29–1.86 |
|
In a relationship |
1.40 |
0.20 |
0.84–2.35 |
|
Pre-injury psychological treatment |
0.29 |
0.003 |
0.13–0.65 |
|
Pre-injury occupation type (reference white-collar) Blue-collar Student |
0.38 0.02 |
0.002 < 0.001 |
0.21–0.70 0.01–0.08 |
|
Brain injury severitya (reference Nil) Uncomplicated mild TBI Complicated mild to severe TBI Very severe TBI Extremely severe TBI |
0.64 0.61 0.60 0.22 |
0.28 0.28 0.36 0.001 |
0.29–1.43 0.25–1.50 0.20–1.81 0.09–0.54 |
|
Bethesda fracture severityb (reference Nil) Uncomplicated Multiple uncomplicated Major joint Severe |
0.41 0.40 0.60 0.23 |
0.08 0.08 0.26 0.02 |
0.15–1.11 0.14–1.13 0.25–1.46 0.07–0.81 |
|
Based on 628 observations of 158 participants. aSeverity of TBI categorized according to PTA duration. bBethesda Scale of Fracture Severity score. Year: the number of years post-injury; Year2: the number of years post-injury squared; NESB: non-English speaking background; OR: odds ratio; CI: confidence interval; TBI: traumatic brain injury. |
|||
DISCUSSION
At 10 years post-injury, individuals in the labour force with TBI were more likely to be unemployed or non-vocational than those with TOI (Table VIII). Furthermore, individuals with TBI who were employed at 10 years post-injury had spent less time with their current employer and were less likely to have experienced increased responsibility since the injury than those with TOI. More severe TBI, as well as personal factors of older age, pre-injury psychological treatment and studying or having a blue-collar occupation at time of injury were associated with poorer employment outcomes. Despite this, a key positive finding of the current study is the potential for ongoing improvements in employment status up to 10 years following traumatic injury.
|
Table VIII. Percentage of participants in the labour force employed at each time-point by injury group |
|||
|
Time-point |
TOI (n = 62) % |
TBI (n = 72) % |
|
|
Pre-injury |
87 |
82 |
|
|
Post-injury, years |
|||
|
1 |
57 |
54 |
|
|
2 |
71 |
52 |
|
|
5 |
87 |
65 |
|
|
10 |
82 |
64 |
|
The employment rate at 10 years post-injury for the total sample in this study is consistent with rates of 49–66% reported at 5 or more years following moderate to severe trauma (10–14, 23, 24). Considering only individuals with TBI in the current study, employment rates are consistent with some studies (4, 5, 25), but higher than other previous reports, with differences probably influenced by different proportions of individuals leaving the labour force (6, 7, 26) and greater injury severity (7, 26). It is also possible that approaches to vocational rehabilitation have improved since earlier studies (7, 26).
Consistent with previous long-term studies, having a more severe TBI was associated with being unemployed or non-vocational, especially evident following extremely severe TBI (24, 25). Studies of younger samples with severe TBI have suggested a declining influence of injury severity over 6–23 years post-injury (7, 27), although a restricted range of TBI severity in these studies may have limited the apparent contribution of PTA. In a broader sample, however, no association between PTA and employment was identified at 15 years post-injury, perhaps due to retrospective PTA measurement (28). An unexpected finding was a higher employment rate following very severe TBI than complicated mild to severe TBI (see Fig. 3). Subsequent investigation revealed that this might have been influenced by a higher pre-injury employment rate for the very severe TBI category compared with other TBI severities.
After controlling for TBI severity and personal factors, there was no evidence of orthopaedic injuries contributing to employment status over 10 years post-injury. This is in accordance with previous suggestions of reduced contribution of other injuries to long-term employment outcomes for individuals with TBI (4, 9). Difficulties with physical functioning and motor deficits have, however, been associated with poorer employment outcomes 7 or more years following moderate to severe TBI (29, 30) and general major trauma (11).
Having a blue-collar occupation at the time of injury was associated with being unemployed or unable to work. This is consistent with reviews by Crépeau & Scherzer (31) and Ownsworth & McKenna (32), although Saltychev et al. (33) described the evidence as weak. In long-term studies at least 5 years post-TBI, the influence of occupation type has been mixed (7, 24, 26), and 2 studies of major trauma excluding severe TBI found that education, but not occupation type, was significant in predicting employment at 5–7 years post-injury (10, 11). Apart from one study (34), higher education has not generally been associated with better long-term employment following TBI (7, 24, 28, 28, 35). Given the likely correlation between education and occupation type, as was evident in the current study, it is possible that each of these factors contributes to an individual’s cognitive reserve (36) in coping with traumatic injury.
Previous studies of employment following traumatic injury have not specifically focused on individuals who were students at time of injury. This study has highlighted poorer employment outcomes over the 10-year time-frame for this group. In addition to the longer time that may be required to complete their studies, it is possible that vocational skills and experience, which would provide some buffer or reserve in transition to the labour force, have not been developed. Given there were only 6 students in each injury group, further investigation with a larger sample size would be warranted.
Older age at injury was associated with less likelihood of employment over the time-frame of the current study, with older individuals more likely to be retired or non-vocational at 10 years post-injury, highlighting the influence of life stage as well as injury. This is consistent with previous findings following TBI (30, 34) and severe lower extremity trauma (10). Studies that have not found a significant contribution of older age to employment following TBI have included relatively younger samples (7, 24, 27, 28, 35) or controlled for physical and cognitive functioning at follow-up (29).
Having a history of psychological treatment was associated with being unemployed or non-vocational. There have been few reports of the influence of pre-injury psychological disorders on long-term employment outcomes, although pre-injury behavioural problems, incorporating psychiatric problems, are predictive of lower productivity at 7–24 years post-TBI (29). Given that pre-injury psychological disorders are associated with increased incidence of psychiatric disorders following TBI (37), which, in turn, have a negative association with employment (32), the influence of pre-injury history may be indirect (8), although this has not been explored over an extended period.
Contrary to previous studies of long-term employment status following traumatic injury (e.g. 10, 34), being of minority cultural background was not significant after controlling for other factors. This may be partly due to the definition of minority culture as NESB in the current study rather than the more usual racial composition of US studies. The relationship between cultural background and employment status may be mediated by other factors, such as socio-economic status. Participants in the present study had access to rehabilitation and vocational support regardless of socio-economic status, which is not the case in the US, and this may have influenced the finding.
Being in a relationship was not associated with employment status. There have been mixed findings regarding the influence of being in a relationship on long-term employment status (24, 34), with some indication that the strength of this association may reduce over time (7). The current study incorporated changes in relationship status over time, and suggests that relationships per se are not significantly associated with long-term employment outcomes in the context of other factors.
Difficulties at work, such as making mistakes, having trouble getting on with people, keeping up, and fatigue, were equally prevalent in both injury groups. Such difficulties might be expected as sequelae of TBI; however, further investigation is required to identify the causes following TOI. Whilst individuals with uncomplicated mTBI may be at risk of post-concussive symptoms, subsequent analysis showed no differences on these measures between individuals with pure orthopaedic trauma and uncomplicated mTBI. Furthermore, there was no difference between these subgroups with respect to employment status at 10 years post-injury. Of particular concern was the reporting of greater fatigue at work by at least half of each group, which would be an important consideration in employment participation. It is possible that the TOI group is reporting physical fatigue, whereas the TBI group is reporting mental fatigue. Further investigation will help with understanding the nature of the fatigue and identifying appropriate supportive strategies.
Evidence of increasing employment rates over an extended period following traumatic injury was encouraging, with the trajectory more apparent when considering only individuals in the labour force (see Fig. 3B). This finding differs from the stable, or even reducing, levels of employment found in most studies over 5 or more years following TBI (e.g. 6, 7, 24, 38), although an increase over 5 years following multiple trauma has been reported (11) and the trajectory of employment hours over a 10-year time-frame following TBI has been described as cubic, with the most rapid increase from 1 to 2 years (39). Factors contributing to these differences will include incorporation of pre-injury as a time-point in the current analysis, as well as the wide range of injury severities and ages.
This study prospectively reported the trajectory of employment and associated factors for 10 years following traumatic injury. In doing so, the particular contribution of TBI in the context of other injuries has been identified, together with pre-injury factors and life stages. The findings need to be considered in the context of some limitations. Most participants had sustained their injuries in transport or work-related accidents and received extensive rehabilitative support for return to employment and study. Long-term gains in employment outcomes may depend on the ongoing availability of vocational therapy. The results may therefore not generalize to other settings and it was also not possible to assess the influence of compensation status.
There was, unfortunately, high loss to follow-up in each of the groups, as is frequently the case in long-term longitudinal studies. The resulting sampling bias may limit the extent to which the outcomes of each group are representative of the cohorts from which they were drawn, and cautious interpretation is warranted. Participants in both injury groups were older than their original cohorts, suggesting that the bias may be non-differential; however, the older age of the samples may contribute to poorer outcomes. Other variables on which the samples differed from the original cohort (i.e. a lower proportion of females and higher ISS in the TOI sample; higher education and GCS in the TBI sample) were not included in the analyses and the impact should therefore be minimal. It is noted, however, that the more severe TBI in the TBI sample, as measured by GCS, may contribute to poorer outcomes, although the sample did not differ from the original cohort on PTA duration used in the analyses.
The reliance on self-report in the current study provides an important indication of employment outcomes from the individual’s perspective. This may differ, however, from objective reports by clinicians. Furthermore, factors investigated in this study were those known in the acute setting. Concurrent measures of cognitive and physical functioning at each time-point would provide valuable information in future studies, especially since self-awareness has been shown to contribute to better employment outcomes 5 years or more following TBI (40) and was not considered in the current study.
These findings suggest that individuals with TBI are less likely to be competitively employed for up to 10 years post-injury compared with individuals with TOI, with poorer outcomes evident following more severe TBI. Given the psychosocial and economic benefits of employment following TBI and general trauma (5, 14), and the potential for employment gains over an extended time-frame, ongoing access to vocational rehabilitation would assist in supporting life changes as they occur. Despite suggestions of insufficient evidence for the benefits of vocational rehabilitation (33), the possibility of improving the lives of individuals and their families is a substantial driver for understanding successful employment. Identifying individuals at risk of not being employed and designing individualized interventions is crucial. Particular areas of focus would include managing fatigue, psychiatric disorders, and exploring supported occupational activity for all levels of injury severity.
ACKNOWLEDGEMENTS
Information for individuals with TBI was accessed from data collected for the Longitudinal Head Injury Study funded by the Transport Accident Commission (TAC; www.tac.vic.gov.au), through the Institute for Safety, Compensation and Recovery Research (ISCRR; www.iscrr.com.au).
The authors acknowledge the contribution of Bridget Hill, who calculated ISS and Bethesda scores for all participants.
Conflicts of interest: The authors declare that they have no competing financial interests.
REFERENCES

