Nienke S. Tielemans, PhD1,2, Johanna M. A. Visser-Meily, MD, PhD2, Vera P. M. Schepers, MD, PhD2, Patricia E. Passier, MD, PhD3,4, Ingrid G. L. van de Port, PhD5, Judith D. M. Vloothuis, MD6, Pieter A. A. Struyf, MD7 and Caroline M. van Heugten, PhD1,8
From the 1School for Mental Health and Neuroscience, Department of Psychiatry and Neuropsychology, Maastricht University Medical Centre, Maastricht, 2Brain Center Rudolf Magnus and Center of Excellence for Rehabilitation Medicine, University Medical Center Utrecht and De Hoogstraat Rehabilitation, Utrecht, 3Merem Treatment Centres, Rehabilitation Centre De Trappenberg, Almere, 4Department of Rehabilitation Medicine, St Antonius Hospital, Nieuwegein, 5Revant Rehabilitation Centre Breda, Breda, 6Department of Neurorehabilitation, Amsterdam Rehabilitation Research Centre Reade, Amsterdam, 7Orbis Rehabilitation, Orbis Medical Centre, Sittard and 8Faculty of Psychology and Neurosciences, Department of Neuropsychology and Psychopharmacology, Maastricht University, Maastricht, The Netherlands
OBJECTIVE: To investigate the effectiveness of a self-management intervention aimed at proactive coping for stroke patients and partners, compared with an education intervention.
DESIGN: Multicentre randomized controlled trial.
PARTICIPANTS: The study included 113 stroke patients (mean age 57.0 years (standard deviation (SD) 9.0), mean 18.8 months after stroke (SD 28.4)) and 57 partners (mean age 59.2 years (SD 8.3)).
METHODS: Participants were randomized to a self-management intervention, or an education intervention, both 10 weeks’ duration, outpatient, stroke-specific, and group-based. Main patient inclusion criteria were symptomatic stroke (≥ 6 weeks previously) and reporting ≥ 2 restrictions on the Restriction subscale of the Utrecht Scale for Evaluation of Rehabilitation Participation. Measurements were performed immediately after intervention, and at 3 and 9 months follow-up. Primary patient and partner outcomes were proactive coping and participation restrictions. Analyses were based on linear mixed modelling.
RESULTS: A significant effect was found only in partners’ increased proactive coping at T2 (compared with education intervention). Beneficial trends were found for the self-management intervention in partners’ self-efficacy and patients’ health-related quality of life, mood complaints and participation restriction.
CONCLUSION: Little convincing evidence was found favouring our self-management intervention over the education intervention; therefore, the self-management intervention should not be implemented yet in clinical practice. Further research is needed to explore beneficial trends.
Key words: quality of life; self-management; coping; RCT.
J Rehabil Med 2015; 00: 00–00
Correspondence address: Caroline M. van Heugten, Maastricht University, Department of Psychiatry and Neuropsychology Faculty of Health, Medicine and Life Sciences, PO Box 616, NL-6200 MD Maastricht, The Netherlands. E-mail: c.vanheugten@maastrichtuniversity.nl
Accepted Aug 20, 2015; Epub ahead of print Oct 1, 2015
INTRODUCTION
Worldwide incidence of stroke is high, with 257.96 new cases per 10,000 people in 2010 (1). Increasing numbers of patients survive a stroke and face long-term impairments in physical, cognitive, emotional and/or social functioning (2, 3). Chronic healthcare makes increasing demands on the patient’s abilities to manage the consequences, given a shifting perspective from paternalistic to patient-centred care (4). In addition, the increasing numbers of stroke survivors also has an economic impact. Enhancing a patients’ own role in condition management is therefore also desirable from an economic perspective. Thus, both the patient’s and economic perspectives support the development and evaluation of interventions to enhance self-management abilities.
Self-management abilities are abilities to manage medical, lifestyle, physical, emotional, and psychosocial consequences of a chronic condition, and its impact on daily life (5). Several self-management interventions enhance patients’ self-management abilities in asthma, chronic obstructive pulmonary disease, and diabetes mellitus type 2 (6). However, while self-management tasks for these conditions mainly concern adequate symptom monitoring, medical treatment, and lifestyle changes, stroke patients must mainly learn strategies to deal with cognitive, emotional and behavioural stroke consequences (7). Self-management interventions for stroke patients should therefore be stroke-specific.
Education-based interventions have been developed to support stroke patients and their partners. However, these interventions do not result in actual behavioural changes, even though they can improve stroke patients’ and partners’ knowledge and satisfaction (8). Other approaches are therefore needed to teach patients and partners strategies for adapting to stroke consequences in daily life. Self-management interventions are a likely candidate, as their effectiveness has been shown in other diseases (5).
Most effective stroke-specific self-management interventions aim at adjusting life goals and underlying psychological processes, such as self-efficacy (9–13). Thus, these interventions aim to change psychological processes that influence goal-setting. However, patients often fail to achieve their adjusted goals, hampered by unanticipated stroke consequences, such as cognitive problems (14). Stroke patients are easily overwhelmed, due to cognitive impairments, such as mental slowness, and reduced flexibility (15). It would seem better to teach stroke patients not only to adjust their goals, but also to anticipate potential consequences of stroke that hinder goal achievement.
Proactive coping strategies post-stroke are patients’ and partners’ efforts to anticipate potentially hampering physical, cognitive, emotional or behavioural stroke consequences during goal-setting and, if necessary, plan actions to prevent the occurrence or adjust the outcomes of these hampering consequences beforehand (16). Studies among healthy elderly people and people with type 2 diabetes have shown potential benefits of teaching people proactive coping strategies when confronted with a chronic condition (17, 18). Such strategies might benefit stroke patients and partners as well. Therefore, we developed the stroke-specific intervention entitled “Plan Ahead!”, a group-based self-management intervention aimed at teaching stroke patients and their partners action planning strategies for proactive coping (19).
This study examined the effectiveness of our stroke-specific self-management intervention, based on teaching proactive coping action planning strategies to stroke patients and partners, compared with a stroke-specific, education-based intervention. Primary outcomes measures for both stroke patients and partners were proactive coping and participation restrictions. The study was part of the Dutch national consortium Restore4Stroke, which aims to improve the quality of life of stroke patients and their partners.
METHODS
Study design
This multicentre randomized controlled trial had a 2-group parallel design, using a balanced randomization stratified by institute (1:1 ratio). The study was approved by the medical ethics committee of the University Medical Center Utrecht and the ethics committees of participating institutes. All patients and partners provided written informed consent. The study was registered in the Dutch Trial Register as NTR3051. Study details are described elsewhere (20).
Participants
The study was conducted at outpatient facilities of 3 hospitals and 5 rehabilitation centres in the Netherlands, between February 2012 and May 2014.
Eligible stroke patients were adults (≥18 years) who had had a first or recurrent symptomatic stroke (i.e. ischaemic or intracerebral haemorrhagic lesion), as confirmed by a neurologist. A rehabilitation physician or nurse confirmed patients’ experienced participation problems in vocational, social or leisure domains by endorsing at least 2 items on the Restriction scale of the Utrecht Scale for Evaluation of Rehabilitation-Participation (USER-Participation) (21). Exclusion criteria comprised clinical judgement to have insufficient mental abilities to understand the intervention, disturbance in production or comprehension of language (score below 5 on Shortened version of the Aphasia Scale of the Dutch Aphasia Foundation (SAN) (22)), behavioural problems hampering group functioning, major depression, or receiving structured psychological counselling for proactive coping post-stroke at recruitment. A rehabilitation physician or nurse practitioner clinically judged these criteria at recruitment. Patients could partake in the study without a partner.
Partners (≥ 18 years) were invited to partake in the study if they cohabited with a stroke patient participating in the study. Partners were excluded when clinically judged as having behavioural problems hampering group functioning, or insufficient command of Dutch to understand the intervention and/or complete questionnaires. A rehabilitation physician or nurse practitioner clinically judged these criteria.
Interventions
The study compared the effectiveness of a self-management intervention with that of an education intervention in stroke patients and partners. Table I describes both interventions.
|
Table I. Description of both the self-management intervention and education intervention |
||
|
Structure |
Self-management intervention 7 × 2-h sessions in 10 weeks |
Education intervention 4 × 1-h sessions in 10 weeks |
|
Components |
Proactive action planning Peer support Education about: stroke consequences dealing with negative emotions social relations and support societal participation |
Peer support Education about: stroke consequences the brain and a stroke prevention of stroke |
|
Participants |
Four stroke patients living at home and their partners |
Four stroke patients living at home and their partners |
|
Therapists |
Two healthcare professionals with the tasks to provide information leading group discussions coaching participants in proactive goal-setting |
One healthcare professional with the tasks: to provide information leading group discussions |
|
Means |
1-day therapist training about the content of the intervention the importance of following the treatment protocol explicitly coaching participants Guides and presentations for therapists Workbooks for participants |
1.5 h therapist training about the content of the intervention the importance of following the treatment protocol explicitly Guides and presentations for therapists Workbooks for participants |
The 10-week self-management intervention consisted of 7 sessions, 6 × 2-h sessions in the first 6 weeks and 1 × 2-h booster session in week 10. It was provided to groups of 4–8 participants by 2 rehabilitation professionals (e.g. psychologist or occupational therapist) at hospitals and rehabilitation centre outpatient facilities. The intervention aimed to teach proactive action planning strategies within 4 themes: “handling negative emotions”, “social relations and support”, “participation in society”, and “less visible stroke consequences”. A more detailed description of the intervention is found elsewhere (19).
The 10-week education intervention consisted of 3 × 1-h sessions in the first 6 weeks and 1 × 1-h booster session in week 10. It was provided in groups of 4–8 participants by one rehabilitation professional (e.g. occupational therapist or psychologist) at hospital and rehabilitation centre outpatient facilities. This intervention aimed to provide information about “the brain and a stroke”, “general stroke consequences”, and “preventing a recurrent stroke” (20).
Procedure
Rehabilitation physicians and nurse practitioners selected eligible stroke patients through case finding. Patients were invited to participate in the study during regular consultation at outpatient facilities of participating centres. Patients interested in participating in the study received an information letter, and their partners were also invited to participate. After 5 days, the researcher called patients and partners to gauge their willingness to participate. If 8 patients in a centre consented, the researcher/research assistant conducted baseline measurements at the patients’ homes or participating centre. Afterwards, patients were randomized to either self-management intervention or education intervention, partners being placed in the same group. Upon intervention completion, measurements were performed immediately (T1) and at 3 (T2) and 9 months (T3) of follow-up. Participants could complete a digital or paper version of these questionnaires autonomously at home within 2 weeks, or make an appointment with a research assistant (blinded to the assigned condition) if necessary.
To prevent contamination across groups, different therapists were assigned to either self-management or education intervention, and received intervention-specific training only. Therapists were instructed not to discuss intervention content with colleagues, and to ask intervention-related questions to the researcher. In addition, interventions were provided at different times in all institutes. Furthermore, patients receiving interventions aimed at proactive coping at the start of the intervention were excluded.
Measurements
Baseline characteristics. At baseline, patients’ and partners’ demographic characteristics were collected using open questions about age, sex, educational level, marital status, employment status, and ethnicity.
Patients’ stroke characteristics were collected using a questionnaire for rehabilitation physicians about the number of months since stroke, and stroke type.
During the baseline measurements, the researcher or research assistant assessed patients’ activities of daily living (Barthel Index, 0–20) (23), general cognitive functioning with the Montreal Cognitive Assessment (24), and communicative abilities using SAN (22).
Primary outcomes. Proactive coping was used as a process-oriented primary outcome measure, assessed with the Utrecht Proactive Coping Competence (UPCC) scale in both patients and partners. This self-assessment scale consists of 21 items scored on a 4-point scale ranging from “not competent at all” to “competent”. Averaging item scores provided the total score (range 1–4). Higher scores indicate higher proactive coping levels. Good psychometric properties of this scale were shown for stroke patients and healthy elderly people (mean age 62.3 (SD 5.4) years) (25, 26).
Experienced participation restrictions in vocational, social and leisure activities, measured with the Restriction subscale of the USER-Participation instrument, was used as the primary outcome measure, assessing intervention benefits for participants. This self-assessment scale consists of 10 items scored on a 4-point scale, ranging from “not possible at all” to “independent without difficulty”. For example “does your stroke currently limit you in doing household duties?” Transforming the sum of all items to a 0–100 scale resulted in the total score. Participants could also choose “not applicable” for inapplicable activities, or for experienced restrictions unrelated to stroke. Higher scores indicated lower participation restriction levels. Psychometric properties prove satisfactory for rehabilitation outpatients, including stroke patients (21).
Secondary outcomes. Both patients’ and partners’ general self-efficacy was assessed with the Dutch version of the General Self-Efficacy scale (GSES). This self-assessment scale comprises 10 items scored on a 4-point scale, ranging from “completely incorrect” to “completely correct”. Adding item scores resulted in the total score (range 10–40). Higher scores indicated greater self-efficacy (27).
Patients’ disease-specific health-related quality of life was assessed with the short version of the Stroke-Specific Quality of Life Scale (SSQoL12). This self-assessment scale comprises 6 items covering the physical domain and 6 items covering the psychosocial domain. Averaging item scores resulted in total scores (range 1–5). Higher scores indicated higher quality of life (28).
Patients’ and partners’ frequency of and satisfaction with participation in vocational, social and leisure activities were assessed with 2 remaining USER-Participation self-assessment subscales (11 and 10 items, respectively). For example: “How often did you do household activities in the last 4 weeks?” or “How satisfied are you with your outdoor mobility?”. Adding items of each subscale separately and transforming the resulting sums to a 0–100 scale resulted in the total score for each subscale. Higher scores represented greater frequency of and satisfaction with participation (21).
Patients’ and partners’ emotional functioning were assessed with the Hospital Anxiety and Depression Scale (HADS). This self-assessment scale consists of 7 items assessing anxiety symptoms and 7 items assessing depression symptoms. Adding item scores resulted in total scores for both subscales and overall (range of subscales 0–31; range of total score 0–42). Higher scores represented greater anxiety or more depressive symptoms (29).
Patients’ subjective well-being was assessed with 2 self-assessment questions measuring patient’s perception of their current life satisfaction (6-point scale ranging from “very unsatisfactory” to “very satisfactory”), and the difference from pre-stroke life satisfaction (7-point scale ranging from “much worse” to “much better”). Adding these 2 scores resulted in the total score (range 2–13), referred to in this study as 2LS. Higher scores indicated greater life satisfaction (30). Contrasting the intention in our original study protocol, in consultation with the scale developer, we decided not to use the question asking patients to assess satisfaction level before stroke (20).
Partners’ burden was assessed with the Caregiver Strain Index (CSI) (31). Adding all 13 item scores resulted in a total score (range 0–13). We decided to omit the expanded CSI from this study, as recent research showed lower internal consistency in terms of positive caregiving aspects (32).
Sample size. Sample size calculations based on UPCC indicated that a minimum of 45 stroke patients per treatment group were needed to demonstrate standardized differences of 0.6, with p = 0.05 and 80% power (26, 33). This number of patients was also sufficient to demonstrate a standardized difference of 0.5 on the Restriction subscale of USER-Participation, with a p = 0.05 and 80% power (34). Expecting a 15% drop-out rate, at least 106 patients had to be recruited.
Randomization. When 8 stroke patients were recruited at the same centre, patients selected 1 out of 8 blank envelopes containing an invitation for either the self-management intervention or the education intervention (1:1 ratio). Partners were assigned to the same intervention as the patient.
Blinding. Participants were told that 2 education-based interventions were being compared. Randomization took place directly after T0. A research assistant visiting participants to assist in completing the questionnaires did not know if the participant followed either the self-management or education intervention.
Statistical analysis. Differences between self-management and education intervention groups at baseline were checked with independent t-tests, Mann Whitney U tests and χ2 tests. For patients, baseline differences were checked in terms of demographic characteristics, general functioning and stroke characteristics, and outcome measures. For partners, baseline differences were checked in terms of demographic characteristics and outcome measures. From the literature we decided to include educational level, level of proactive coping at baseline, communicative impairment (yes/no) and time since stroke as covariates in the analyses (25, 35).
Unlike our original study protocol, we used linear mixed modelling to determine differences in effectiveness between the interventions (20). More sophisticated than repeated measures of variance, linear mixed modelling includes participants with incomplete data-sets (36). For patients, 12 models were calculated, each with 1 of the 2 primary outcome measures or 10 secondary outcome measures as dependent variable. For partners, 9 models were calculated, each with 1 of the 2 primary outcome measures or 7 secondary outcome measures as dependent variable.
Intervention effectiveness was determined according to the intention-to-treat principle. Effectiveness was also examined using “on-treatment analysis”, including only patients and partners who took part in at least 5 self-management intervention sessions, or at least 3 education intervention sessions (> 75% attendance). Time, group, covariate(s) and the time × group interaction term were added as fixed terms to the models. Time, group, communicative impairment and educational level at baseline (high/low) were considered categorical variables. Proactive coping levels at baseline and time since stroke were taken as continuous variables. The primary and secondary outcome measures were included as dependent variables. Parameters were estimated with the REML maximum likelihood estimation method.
The need for random slopes and appropriate covariance structures was estimated based on Akaike’s Information Criterion (AIC). Lower AIC values indicated a better model given the data.
Data were analysed with IBM SPSS Statistics 21. Statistical tests were performed 2-sided. We used adjusted significance thresholds based on the Bonferroni correction for multiple testing. A p-value < 0.025 for both primary outcome measures was considered statistically significant, along with a p-value < 0.005 for 10 secondary outcome measures.
For both primary outcome measures we reported descriptive statistics on each measurement separated per group (i.e. mean, SD) As we were interested in the effectiveness of our self-management intervention compared with the education intervention over time, we reported only statistics for time × group interaction effects (i.e. estimated mean differences including 95% confidence intervals and p-values). All time × group interaction effects were calculated relative to T0. Secondary outcome statistics were reported only for significant time × group interaction effects.
RESULTS
Participant characteristics
Fig. 1 depicts the flowchart of 113 stroke patients and 57 partners included in this study. Of 58 patients assigned to the self-management intervention, 56 started the intervention and 46 attended at least three-quarters of the intervention sessions (i.e. ≥ 5 sessions). One patient who did not start the self-management intervention was also lost to follow-up, due to his physical condition during the intervention. In addition, 3 “self-management intervention” patients were lost to follow-up, as they dropped out of the intervention due to dissatisfaction (n = 2) or communicative impairment (n = 1). Of 55 patients assigned to the education intervention, 53 started the intervention and 38 attended at least three-quarters of the intervention sessions (i.e. ≥ 3 sessions). One patient who did not start the education intervention was also lost to follow-up due to other commitments. In addition, “education intervention” patients were unable to complete the questionnaires due to other commitments (n = 1) or unknown reasons (n = 2).
Of 28 partners assigned to the self-management intervention, 25 started the intervention and 24 attended at least three-quarters of the intervention sessions. One partner who did not start with the self-management intervention was lost to follow-up due to other commitments during the intervention. Of 29 partners assigned to the education intervention, 26 started the intervention and 23 attended at least three-quarters of the intervention sessions (i.e. ≥ 3 sessions).
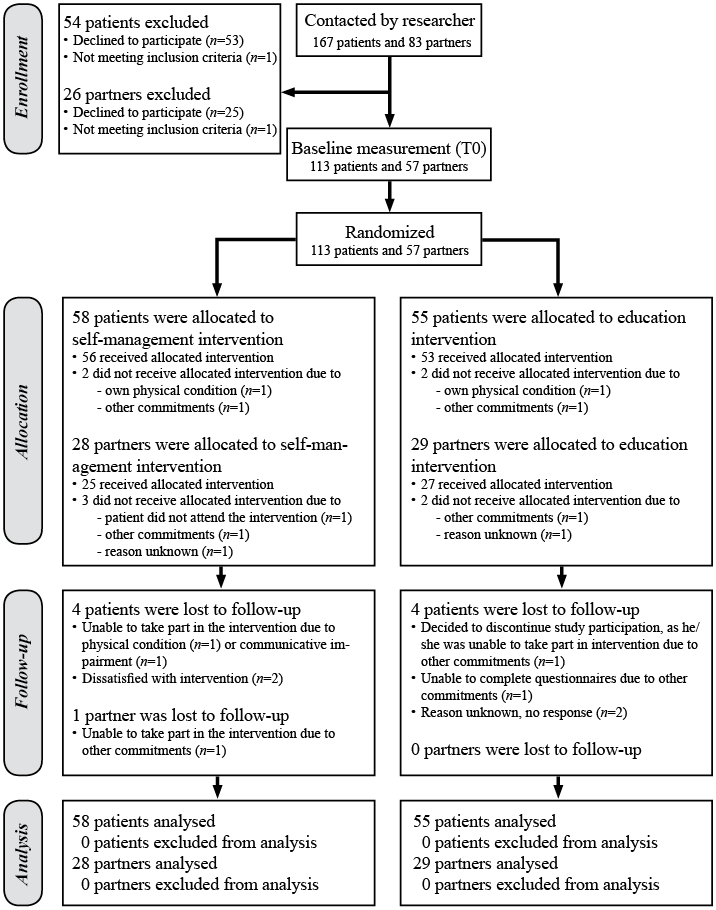
Fig. 1. Flow of patients and partners through the study.
Table II presents characteristics of the participating patients and partners. At baseline, patients in the self-management intervention condition were significantly younger than patients in the education intervention condition (F = 0.58; p = 0.034). On all other demographic and stroke characteristics, general functioning and outcome measures, patients in the 2 conditions were comparable. At baseline, no significant differences were found between partners in the self-management intervention condition and the education intervention condition in terms of demographic characteristics or outcome measures.
|
Table II. Patients’ and partners’ characteristics (n = 113) |
|||||||||
|
Patient |
Partner |
||||||||
|
Self-management intervention (n = 58) n |
Education intervention (n = 55) n |
Self-management intervention (n = 29) n |
Education intervention (n = 28) n |
||||||
|
Demographic characteristics |
|||||||||
|
Age, years, mean (SD) |
58 |
55.2 (8.9)* |
55 |
58.8 (8.7)* |
29 |
57.2 (7.8) |
28 |
61.1 (8.5) |
|
|
Sex, % man |
58 |
44.8 |
55 |
60.0 |
29 |
50.0 |
28 |
37.9 |
|
|
Educational level, % low |
56 |
69.6 |
54 |
63.0 |
25 |
24.0 |
28 |
31.0 |
|
|
Living with partner, % |
57 |
73.7 |
55 |
76.9 |
29 |
100 |
28 |
100 |
|
|
Employment status, % employed |
58 |
22.4 |
55 |
23.6 |
29 |
57.1 |
28 |
51.7 |
|
|
Ethnicity, % Dutch nationality |
58 |
98.3 |
54 |
100.0 |
29 |
100 |
28 |
100 |
|
|
Participating with partner in intervention, % |
58 |
48.3 |
55 |
54.5 |
29 |
100 |
28 |
100 |
|
|
Functioning |
|
|
|
|
|
|
|
|
|
|
Barthel Index (0–20), mean (SD) |
58 |
18.9 (2.7) |
54 |
18.4 (2.8) |
– |
– |
– |
– |
|
|
Cognitively impaired, % MoCA < 26 |
58 |
55.2 |
54 |
63.0 |
– |
– |
– |
– |
|
|
Communicatively impaired, % SAN < 7 |
58 |
43.1 |
55 |
50.9 |
– |
– |
– |
– |
|
|
Stroke characteristics |
|||||||||
|
Time after stroke in months, mean (SD) |
54 |
15.6 (20.9) |
55 |
21.9 (34.1) |
– |
– |
– |
– |
|
|
Type of stroke (% infarction) |
55 |
78.2 |
55 |
87.3 |
– |
– |
– |
– |
|
|
Affected hemisphere (% right) |
54 |
44.4 |
55 |
45.5 |
– |
– |
– |
– |
|
|
Stroke history (% recurrent) |
54 |
13.0 |
55 |
21.8 |
– |
– |
– |
– |
|
|
Outcome measures |
|
|
|
|
|
|
|
|
|
|
UPCC (1–4) |
58 |
2.9 (0.6) |
55 |
2.9 (0.5) |
28 |
3.1 (0.4) |
29 |
3.1 (0.4) |
|
|
USER-Participation Restriction (0–100) |
58 |
70.9 (15.5) |
54 |
73.4 (16.6) |
26 |
86.6 (16.0) |
28 |
86.6 (14.0) |
|
|
GSES (1–40) |
58 |
28.4 (6.5) |
54 |
27.9 (6.4) |
28 |
32.2 (4.3) |
29 |
32.1 (4.0) |
|
|
USER-Participation Frequency (0–100) |
58 |
31.2 (10.3) |
54 |
30.4 (10.2) |
28 |
36.1 (9.9) |
29 |
34.0 (8.7) |
|
|
USER-Participation Satisfaction (0–100) |
58 |
59.1 (16.1) |
54 |
62.6 (18.1) |
28 |
69.3 (14.5) |
29 |
68.6 (17.1) |
|
|
HADS depression (0–21) |
58 |
6.3 (3.8) |
54 |
6.6 (3.6) |
28 |
4.2 (4.0) |
29 |
5.2 (4.2) |
|
|
HADS anxiety (0–21) |
58 |
6.7 (4.2) |
54 |
6.7 (4.0) |
28 |
6.7 (4.1) |
29 |
6.8 (4.6) |
|
|
HADS total (0–42) |
58 |
12.9 (7.1) |
54 |
13.3 (6.7) |
28 |
10.9 (7.5) |
29 |
12.0 (8.3) |
|
|
2LS (2–13) |
58 |
6.4 (2.7) |
54 |
7.0 (2.4) |
– |
– |
– |
– |
|
|
SSQOL12 physical (1–5) |
58 |
3.9 (0.6) |
54 |
3.8 (0.7) |
– |
– |
– |
– |
|
|
SSQOL12 psychological (1–5) |
58 |
3.2 (1.1) |
54 |
3.4 (1.0) |
– |
– |
– |
– |
|
|
SSQOLtotal (1–5) |
58 |
3.6 (0.8) |
54 |
3.6 (0.8) |
– |
– |
– |
– |
|
|
CSI (0–13) |
– |
– |
– |
– |
28 |
4.9 (3.5) |
29 |
6.2 (3.1) |
|
|
*p-value <0.05 was considered statistically significant. SD: standard deviation; BI: Barthel Index; MoCA: Montreal Cognitive Assessment; SAN: Shortened version of the Aphasia Scale of the Dutch Aphasia Foundation; UPCC: Utrecht Proactive Coping Competence scale; GSES: General Self Efficacy Scale; USER-Participation Restriction: Restriction subscale of the Utrecht Scale for Evaluation of Rehabilitation-Participation; USER-Participation Frequency: Frequency scale of the Utrecht Scale for Evaluation of Rehabilitation-Participation; USER-Participation Satisfaction: Satisfaction scale of the Utrecht Scale for Evaluation of Rehabilitation-Participation; HADS Depression: Depression subscale of the Hospital Anxiety and Depression Scale; HADS Anxiety: Anxiety subscale of the Hospital Anxiety and Depression Scale; HADS Total: Total scale of the Hospital Anxiety and Depression Scale; 2LS=2 life satisfaction questions; SSQOL12 Physical: Physical subscale of the Short Stroke-Specific Quality of Life scale; SSQOL12 Psychosocial: Psychosocial subscale of the Short Stroke-Specific Quality of Life scale; SSQOL12 Total: total scale of the Short Stroke-Specific Quality of Life scale; CSI: Caregiver Strain Index. |
|||||||||
Patients who were lost to follow-up (n = 8) during the study had lower levels of self-efficacy (F = 16.6; p < 0.001), health-related quality of life (F = 4.7; p = 0.033), psychological quality of life (F = 5.9; p = 0.016), and cognitive functioning (F = 5.0; p = 0.028) than those who did not. As only one partner was lost to follow-up, it was not necessary to calculate whether this person differed from the partners who completed the study.
Treatment effects
Tables III and IV present descriptive statistics on primary outcomes for on-treatment as well as intention-to-treat analyses. Furthermore, time × group interaction effects (comparing group differences in T1, T2, and T3 to T0) were reported.
|
Table III. Mean scores and treatment effects on the primary outcome measures for patients |
|||||||
|
Self-management intervention Mean (SD) |
Education intervention Mean (SD) |
Estimated mean difference |
Lower 95% |
Upper 95% |
p-value interaction effect |
||
|
Intention-to-treat analyses (n = 113) |
|||||||
|
UPCC |
|||||||
|
T0 |
2.9 (0.6) |
2.9 (0.5) |
|||||
|
T1 |
2.9 (0.6) |
2.9 (0.6) |
0.0 |
–0.2 |
0.2 |
0.937 |
|
|
T2 |
3.0 (0.6) |
2.9 (0.5) |
0.1 |
–0.1 |
0.3 |
0.292 |
|
|
T3 |
3.0 (0.7) |
2.9 (0.6) |
0.1 |
–0.1 |
0.3 |
0.344 |
|
|
USER-Participation Restriction |
|||||||
|
T0 |
70.9 (15.5) |
73.4 (16.6) |
|||||
|
T1 |
70.9 (15.1) |
71.5 (18.8) |
1.3 |
–3.8 |
6.4 |
0.612 |
|
|
T2 |
70.3 (16.2) |
70.5 (18.4) |
1.0 |
–4.4 |
6.4 |
0.714 |
|
|
T3 |
73.1 (17.0) |
67.6 (20.2) |
6.1 |
0.6 |
11.6 |
0.030 |
|
|
On-treatment analyses (n = 84) |
|||||||
|
UPCC |
|||||||
|
T0 |
2.8 (0.6) |
2.9 (0.5) |
|||||
|
T1 |
2.9 (0.6) |
2.9 (0.6) |
0.1 |
–0.2 |
0.3 |
0.613 |
|
|
T2 |
3.0 (0.6) |
2.9 (0.5) |
0.1 |
–0.1 |
0.4 |
0.223 |
|
|
T3 |
3.0 (0.7) |
2.8 (0.6) |
0.2 |
–0.1 |
0.4 |
0.181 |
|
|
USER-Participation Restriction |
|||||||
|
T0 |
69.8 (15.8) |
73.4 (16.4) |
|||||
|
T1 |
69.1 (14.9) |
71.5 (17.6) |
0.4 |
–5.4 |
6.3 |
0.881 |
|
|
T2 |
69.3 (16.5) |
69.8 (18.8) |
1.5 |
–4.2 |
7.2 |
0.599 |
|
|
T3 |
72.7 (17.3) |
67.4 (20.0) |
6.5 |
0.78 |
12.3 |
0.026 |
|
|
*p-value < 0.0042 was considered statistically significant. Measurements were performed at baseline (T0), immediately after the intervention (T1), at 3 months of follow-up (T2), and 9 months (T3) of follow-up. SD: standard deviation; UPCC: Utrecht Proactive Coping Competence scale; USER-Participation Restriction: Restriction subscale of the Utrecht Scale for Evaluation of Rehabilitation-Participation. |
|||||||
|
Table IV. Mean scores and treatment effects on the primary outcome measures for partners |
||||||
|
Self-management intervention Mean (SD) |
Education intervention Mean (SD) |
Estimated mean difference |
Lower 95% |
Upper 95% |
p-value interaction effect |
|
|
Intention-to-treat analyses (n = 57) |
|
|
|
|
|
|
|
UPCC |
||||||
|
T0 |
3.1 (0.4) |
3.1 (0.5) |
||||
|
T1 |
3.3 (0.5) |
3.3 (0.3) |
–0.0 |
–0.1 |
0.1 |
0.926 |
|
T2 |
3.4 (0.5) |
3.1 (0.5) |
0.2 |
–0.0 |
0.3 |
0.024* |
|
T3 |
3.3 (0.6) |
3.3 (0.5) |
0.1 |
–0.1 |
0.3 |
0.511 |
|
USER-Participation Restriction |
||||||
|
T0 |
86.6 (16.0) |
86.6 (14.0) |
||||
|
T1 |
91.5 (9.2) |
88.7 (11.9) |
4.1 |
–1.6 |
9.7 |
0.156 |
|
T2 |
89.1 (12.3) |
83.0 (16.3) |
7.4 |
–0.0 |
14.7 |
0.051 |
|
T3 |
87.9 (18.8) |
85.3 (16.3) |
3.1 |
–4.7 |
10.8 |
0.435 |
|
On-treatment analyses (n = 47) |
|
|
|
|
|
|
|
UPCC |
||||||
|
T0 |
3.0 (0.4) |
3.1 (0.4) |
||||
|
T1 |
3.3 (0.5) |
3.3 (0.4) |
0.0 |
–0.2 |
0.3 |
0.832 |
|
T2 |
3.3 (0.6) |
3.1 (0.5) |
0.2 |
–0.1 |
0.5 |
0.156 |
|
T3 |
3.3 (0.5) |
3.3 (0.5) |
0.0 |
–0.2 |
0.3 |
0.738 |
|
USER-Participation Restriction |
||||||
|
T0 |
86.4 (16.0) |
86.8 (14.8) |
||||
|
T1 |
90.3 (9.8) |
89.1 (11.2) |
2.6 |
–4.1 |
9.3 |
0.435 |
|
T2 |
86.5 (13.1) |
81.3 (17.3) |
6.0 |
–3.5 |
15.5 |
0.211 |
|
T3 |
86.9 (20.8) |
85.5 (14.6) |
1.1 |
–9.1 |
11.4 |
0.826 |
|
*p-value < 0.05 was considered statistically significant. Measurements were performed at baseline (T0), immediately after the intervention (T1), at 3 months of follow-up (T2), and 9 months (T3) of follow-up. SD: standard deviation; UPCC: Utrecht Proactive Coping Competence scale; USER-Participation Restriction: Restriction subscale of the Utrecht Scale for Evaluation of Rehabilitation-Participation. |
||||||
In patients, both the intention-to-treat analyses and the on-treatment analyses showed no significant differences between self-management and education intervention, on either primary or secondary outcome measures (p > 0.025 and p > 0.005, respectively.)
Nevertheless, trends toward a difference were seen regarding the USER-Participation Restriction subscale at T3 in both analyses. Furthermore, as shown in Table V, trends were found in the HADStotal at T1 and SSQOL12total at T3 in on treatment analyses, favouring the self-management intervention.
|
Table V. Important outcomes of on-treatment analyses of secondary outcome measures in patients and partners |
||||||
|
Measurement |
Outcome measure |
Estimated mean difference |
p-value |
Self-management intervention Mean (SD) |
Education intervention Mean (SD) |
|
|
Patient |
T1 vs T0 |
HADStotal |
–2.1 |
0.038 |
T0: 13.2 (7.3) |
T0: 12.8 (6.6) |
|
T1: 12.1 (7.4) |
T1: 14.0 (6.8) |
|||||
|
T3 vs T0 |
SSQOL12 total |
0.3 |
0.037 |
T0: 3.6 (0.7) |
T0: 3.6 (0.8) |
|
|
T3: 3.8 (0.8) |
T3: 3.5 (0.9) |
|||||
|
Partner |
T2 vs T0 |
GSES |
2.0 |
0.030 |
T0: 32.3 (4.5) |
T0: 32.1 (4.0) |
|
T2: 34.6 (4.9) |
T3: 31.9 (4.7) |
|||||
|
Measurements were performed at baseline (T0), immediately after the intervention (T1), at 3 months of follow-up (T2), and 9 months (T3) of follow-up. SD: standard deviation. |
||||||
In partners, a significant effect was found in UPCC at T3 in the intention-to-treat analyses (estimated mean difference = 0.2; p = 0.024). In the self-management intervention alone, partners showed an increase in their UPCC score at T2 in comparison with T0. On treatment analyses showed no significant differences between self-management intervention and education intervention on both primary outcome measures and most secondary outcome measures (p > 0.05). A difference in self-efficacy was found only at T2 (estimated mean difference= 2.4; p = 0.038), as partners in the self-management intervention showed an increase in general self-efficacy (meanT0 (SD) = 32.3 (4.5); meanT2 (SD) = 34.6 (4.9)), while a decrease was seen in the education intervention (mean T0 (SD) = 32.1 (4.0); mean T2 (SD) = 31.9 (4.7)).
DISCUSSION
This study found little compelling evidence in favour of our self-management intervention compared with the education intervention among stroke patients. As for partners, the self-management intervention was effective in terms of proactive coping and self-efficacy levels, 3 months after the intervention ended. That is, partners who had attended at least three-quarters of the intervention sessions reported higher proactive coping and self-efficacy compared with partners in the education intervention. Also, we found some beneficial trends in patients, in terms of mood, health-related quality of life and experienced restrictions in participation favouring the self-management intervention.
We used the rule of thumb of a 10% difference in outcome measure being considered clinically relevant. Thus, for clinical relevance, a difference is needed of 10 on the USER-Participation restriction subscale and of 0.4 on the UPCC. No 95% CI lower bound reached or approached these clinical thresholds for both respective primary measures, thus impeding clinical inferences.
Our study outcomes contrast to earlier studies showing the effectiveness of stroke-specific self-management intervention (9–13). Our study differed from earlier studies in our aim to teach stroke patients proactive coping strategies. Stroke-specific impairments may have influenced our trial outcomes. For instance, earlier research showed many stroke patients reporting reduced self-awareness after stroke (37). Reduced self-awareness often results in overestimation of own capacities (14, 38). Associations between realistic goal setting and proactive coping have been reported in healthy adults, so unrealistic goal-setting may have hampered participants in proactive coping (17). This study did not measure self-awareness; further research might verify this potential explanation.
In partners, our study differed from a study aimed at enhancing healthy adults’ proactive coping strategies in dealing with their own future problems (17). In contrast, partners in our study were invited for patients’ post-stroke participation problems, instead of their own. This might have demotivated partners to learn proactive coping strategies. Moreover, partners in our study reported low participation restrictions at study onset, which may also imply less room for improving participation.
Earlier studies showing effectiveness of interventions targeting stroke-specific self-management and proactive coping compared these interventions with care as usual conditions or a waiting list (9–13). Therefore, these studies might not have controlled for non-specific effects of general therapeutic approaches, such as peer support or stroke-related information provision, to patients in the control condition. These generic components might have been responsible for the effectiveness of these earlier interventions, rather than specific self-management components.
The current study showed a favourable trend for our self-management intervention compared with the education intervention, among patients and partners. Significant improvements were also observed in partners. However, as argued above, proactive coping might not have caused this trend. Therefore, on the one hand, we recommend further research into proactive coping facilitators in stroke patients and partners, as proactive coping is associated with quality of life post-stroke (25). On the other hand, we think, in line with other researchers, that insufficient knowledge exists about the success of self-management interventions, such as contextual factors, therapeutic approaches, and patient characteristics (6, 39). Further research into these factors is recommended, to identify conditions needed to successfully provide self-management interventions to stroke patients and partners.
In addition, a response shift bias in the self-management intervention participants might have masked our results, as proactive coping was measured through self-assessment. Thus, although participants enhanced proactive coping strategies after the self-management intervention, they perhaps did not rate themselves as more competent because they realized the extent to which they still needed to learn how to cope with the post-stroke situation, and possible future challenges.
We excluded patients who were clinically judged as not having the mental ability to profit from and understand the intervention, having inadequate Dutch fluency or having behavioural problems interfering with adequate group functioning. Using these exclusion criteria might have flattened our study effects. The education intervention might have been enough for patients who are minimally challenged by stroke consequences. However, we expect that patients excluded from our study might face more challenging issues. It could be that these patients are actually the ones that need our self-management intervention more. Thus, our study findings do not generalize to these more severely affected stroke patients.
Strengths of our study included the considerable patient sample size, and multiple-site patient as well as partner recruitment. In addition, both patients and partners were condition blinded. Also, drop-out rate during trial was low. Finally, we analysed our results using linear mixed modelling, allowing for inclusion of incomplete data-sets.
The present study was limited since patients were not selected based on their own experiences and intrinsic motivation to change their situation. Physicians and specialized nurses assessed experienced participation problems or study eligibility. Secondly, the trial was conducted alongside usual care in participating hospitals and rehabilitation centres, which may have influenced the outcomes, as it was not possible to control for the content of care-as-usual programmes. Thirdly, the sample size was too small to detect outcome differences in partners. Finally, outcome measures in this trial may have been too generic to detect changes in participants’ concrete coping behaviours. That is, stroke patients might have achieved goals they set during the self-management intervention, but the impact of this goal achievement may have been too specific for our measures to detect.
In conclusion, little compelling evidence was found favouring the self-management intervention over education in stroke patients and partners; thus, the self-management intervention should not be implemented in clinical practice yet. However, we should also not abandon the intervention or idea of enhancing stroke patients’ and their partners’ proactive coping, given beneficial trends in partners’ proactive coping and self-efficacy, and patients’ quality of life, mood complaints, and participation restrictions. Such improvements matter both to individuals and society, as reduced healthcare costs might be the result. Research is needed into ways to facilitate proactive coping, and into contextual and personal factors that influence intervention outcomes such as ours.
ACKNOWLEDGEMENTS
This work was supported by the Dutch VSBFonds (#89000004); and the Dutch Heart Foundation. The funding sources had no involvement in the study design, collection, analysis and interpretation of data, writing the report, or in the decision to submit the paper for publication.
The authors would like to thank the participants in this study, the healthcare professionals involved, and the participating Dutch hospitals and rehabilitation centres University Medical Centre Utrecht; Merem Treatment Centres, Rehabilitation Centre De Trappenberg; Heliomare, Amsterdam; Orbis Medical Centre, Sittard; Revant Rehabilitation Centre Breda; Amsterdam Rehabilitation Research Centre Reade, Amsterdam; and Roessingh, Enschede.
The authors declare no conflicts of interest.
REFERENCES

