Rachel Milte, BNutDiet, BSc (Hons), PhD1,2, Michelle D. Miller, BSc, MNutDiet, PhD, AdvAPD1, Maria Crotty, BA, BMed, MPH, PhD, FAFRM (RACP), FAFPHM, FRACGP2, Shylie Mackintosh, BAppSc (Physio), MSc, PhD3, Susie Thomas, BAppSc (Physio) (Hons), PhD2, Ian D. Cameron, MBBS, PhD, FACRM, FAFRM (RACP)4, Craig Whitehead, BMBS (Hons), FRACP2, Susan Kurrle, MBBS, PhD5 and Julie Ratcliffe, BA (Hons), MSc, PhD6
From 1Nutrition and Dietetics, 2Rehabilitation, Aged, and Extended Care, Flinders University, Adelaide, South Australia, 3School of Health Sciences, University of South Australia, South Australia, 4John Walsh Centre for Rehabilitation Research, University of Sydney, 5Division of Rehabilitation and Aged Care, Hornsby Ku-ring-gai Hospital, New South Wales and 6Flinders Clinical Effectiveness, Flinders University, South Australia, Australia
OBJECTIVE: To undertake a cost-utility analysis of the Individual Nutrition Therapy and Exercise Regime: A Controlled Trial of Injured, Vulnerable Elderly (INTERACTIVE) trial.
DESIGN: Cost-utility analysis of a randomized controlled trial.
SUBJECTS: A total of 175 patients following a hip fracture were allocated to receive either alternate weekly visits from a physical therapist and dietitian (intervention group), or social visits for 6 months (control group).
METHODS: Costs for utilization of hospitals, health and community services were compared with quality-adjusted life years gained, calculated from responses to the Assessment of Quality of Life instrument.
RESULTS: There were minimal differences in mean costs between the intervention ($AUD 45,331 standard deviation (SD): $AUD 23,012) and the control group ($AUD 44,764 SD: $AUD 20,712, p = 0.868), but a slightly higher mean gain in quality-adjusted life years in the intervention group (0.155, SD: 0.132) compared with the control group (0.139, SD: 0.149, p = 0.470). The incremental cost-effectiveness ratio was $AUD 28,350 per quality-adjusted life year gained, which is below the implied cost-effectiveness threshold utilized by regulatory authorities in Australia.
CONCLUSION: A comprehensive 6-month programme of therapy from dietitians and physical therapists could be provided at a relatively low additional cost in this group of frail older adults, and the incremental cost-effectiveness ratio indicates likely cost-effectiveness, although there was a very high level of uncertainty in the findings.
Key words: hip fracture; rehabilitation; cost-utility analysis; nutrition therapy.
J Rehabil Med 2016; 48: 378–385
Correspondence address: Rachel Kathleen Milte, Rehabilitation, Aged and Extended Care, Flinders University, 5001 Adelaide, Australia. E-mail: rachel.milte@flinders.edu.au
Accepted Jan 20, 2016; Epub ahead of print Mar 17, 2016
INTRODUCTION
The devastating effect of hip fractures on function and independence has been well documented. The cost to the community for treating and providing community support was estimated as $AUD 227 million in 1994 (1). Given the high costs to society of managing the ongoing effects on mobility, function and independence, strategies are needed to promote maximum possible recovery of health, function and independence.
Given the impact of fragility fractures on the health system and society, there has been a focus on developing programmes to promote maximum recovery following hip and other fractures. One approach is to use multidisciplinary rehabilitation strategies, which typically involve increased coordination and cooperation between a wider variety of healthcare workers than in usual care, development of shared goals between the therapy team and the patient, and increasing the intensity or duration of therapy provided. Previous reviews of multidisciplinary rehabilitation strategies have highlighted benefits of such programmes through increased return of patients to the community, less decline in function, reduced length of hospital stay, rate of complications, and “poor outcome” (a pooled outcome of mortality or admission to a nursing home) (2, 3). Although implementing multidisciplinary rehabilitation strategies could result in increased expenditure through greater staff input into these programmes, in practice previous studies have identified cost savings through providing multidisciplinary rehabilitation strategies (4, 5) or only small increases in care costs (6). Exercise or physical therapy to prevent and treat functional decline and frailty experienced by this group has formed a key part of treatment in most multidisciplinary strategies previously implemented. Extended physical therapy provided in the community following discharge has been shown to improve mobility, function, strength, balance, and quality of life (QoL) compared with standard in-patient provided rehabilitation (7).
Malnutrition is common among hip fracture patients and has been shown to increase hospitalization costs and length of stay, as well as function, strength and mobility outcomes (8–14). Nutritional therapy is a key component in the treatment of malnutrition, and a recent meta-analysis of nutritional therapy identified improvements in weight status, reduced risk of complications and reduced risk of mortality in malnourished older adults following treatment with nutrition therapy (15). Currently there are no cost-effectiveness studies published evaluating the use of combined nutrition and exercise therapy for rehabilitation following a hip fracture (16). While physical therapy has become a standard aspect of rehabilitation treatment, explicit inclusion of nutrition therapy in the multidisciplinary rehabilitation strategies described in the Cochrane Review of multidisciplinary rehabilitation following hip fracture is rare (2). Therefore, the aim of this study was to conduct an economic evaluation of individualized nutrition and exercise therapy programmes for rehabilitation following hip fracture.
METHODS
Study design
A protocol for the design of the study has been published previously (17). Briefly, a randomized controlled trial with blinded outcome assessment was undertaken in patients following a fall-related hip fracture. Participants were randomly allocated to either: (i) an individualized nutrition and exercise programme; or (ii) attention control for 6 months. The primary results for the study have not yet been published.
Recruitment
Participants with a fall-related hip fracture were recruited from 3 acute care settings in South Australia and New South Wales and 1 rehabilitation setting in South Australia. Eligibility criteria included age 70 years or above, absence of severe cognitive impairment (Mini-Mental State Examination (MMSE) score of 18 or above out of 30), and a body mass index (BMI) of between 18.5 and 35 kg/m2. Exclusion criteria included presence of a pathological fracture, admitted from a residential aged care facility, unable to communicate with staff in English, non-ambulatory pre-fracture or limited to stand transfers only post-surgery, or not deemed to be medically stable within 14 days post-surgery. All participants gave informed consent to participate in the trial with additional third party consent gained for those participants with an impaired cognitive state (MMSE between 18 and 23) (18).
Intervention
The intervention (commenced within 14 days following survey and lasting 6 months) involved a coordinated and individualized care plan for each participant, focusing on strength and balance exercises and nutritional therapy. The exercises were based on the Otago exercise programme, combining strength, balance, and walking training undertaken 3 times per week (19). Participants were visited by the trial physical therapist every 14 days to progress exercises. The nutrition therapy aimed at improving dietary intake to meet estimated requirements (especially for energy and protein). Dietary strategies included dietary counselling focusing on timing, size, and frequency of meals, recommendations of nutrient-rich foods and recipes, referral to community meal programmes, and provision of commercial oral nutritional supplements or commercial protein powders as deemed appropriate. Participants were visited by the trial dietitian every 14 days (alternately to physical therapist visits) to review dietary intake and modify strategies. The control group received access to usual rehabilitation programmes recommended during hospitalization, social visits weekly from trial staff and generic nutrition, exercise and falls prevention information.
Healthcare costs
A cost-utility analysis was performed combining a measurement of the healthcare-related costs associated with the intervention with a measure of benefits over the 6 months’ study time-period. Methods recommended by the Pharmaceutical Benefits Advisory Committee on preparing economic evaluations were utilized (20). The perspective of the analysis was of the costs to the healthcare sector, including use of community services, such as residential care. Healthcare costs were determined by applying accepted unit costs to utilizations of health services recorded at the individual level. An overview of the unit costs for the healthcare resources included in the analysis is shown in Table I. Healthcare utilization was collected from questionnaires provided to the patient at weekly visits by trial staff for the duration of the 6-month intervention. Utilization of medical and pharmaceutical benefits items were requested from the Medical Benefits Scheme and the Pharmaceutical Benefits Scheme, which included claims for eligible pharmaceuticals, medical and other health worker consultations, laboratory and radiological procedures, and other medical procedures.
Unit costs for hospital admission and ambulatory and day rehabilitation services were based on Australian data from the National Hospital Cost Data Collection (NHCDC) (21–23). A “cost per day” was calculated, which included hotel, supply, pharmacy, allied health, imaging, pathology, ward nursing, medical, and non-clinical salaries and a “once off cost”, which included emergency department, operating room, critical care, specialist procedure suites, and prostheses. Unit costs per day were then multiplied by the actual length of stay recorded for each individual admission. Unit costs for visits from allied health practitioners in the community were taken from rebates specified by Department of Veterans Affairs (24). Costs were adjusted to 2010 prices using the relevant consumer price index, as this was the final year of recruitment to the study.
|
Table I. Unit costs for health resources utilized |
|||
|
Healthcare resource |
Unit |
Cost per unit updated to 2010 ($AUD) |
Source |
|
Community allied health visits |
1 visit |
Range between 26.25 up to 122.50 |
DVA |
|
Trial dietetic or physical therapy visit |
Per min |
2.00 |
DVA |
|
Trial travel time |
Per min |
2.00 |
DVA |
|
Car maintenance |
Per km |
0.63 |
Flinders University |
|
Oral nutritional supplements |
1 tetra pack |
2.60 |
Retail price |
|
Protein powder supplement |
1 week supply |
7.10 |
Retail price |
|
Ankle/wrist weights |
1 weight |
22.00 up to 57.40 size dependant |
Retail price |
|
Hospitalizations |
1 day |
Based on DRG codes ranging from 642 + 212/day up to 23,353 + 733/day |
NHCDC |
|
Drugs, laboratory tests, doctors and other health worker consultations, procedures claimed on Medicare |
1 item |
Based on item numbers ranging from 0.07 to 3,7291 |
Medicare |
|
Residential transitional care programme |
1 day |
262.88 |
Literature |
|
Ambulatory and day rehabilitation programme |
1 day |
3,700 + 283.13 |
NHCDC |
|
High-level care residential care facility |
1 day |
193.81 |
DOHA Report |
|
Low-level care residential care facility |
1 day |
107.85 |
DOHA Report |
|
Respite at a residential care facility |
1 day |
72.52 |
Literature |
|
DRG: diagnostic-related group; DVA: Department of Veterans’ Affairs; NHCDC: National Hospital Cost Data Collection; DOHA: Department of Health and Aging. |
|||
Quality of life
Health-related quality of life (HRQoL) of the study participants was measured using the Assessment of Quality of Life (AQoL) instrument, now known as the AQoL-4D (25). The AQoL is a generic preference-based measurement of HRQoL across 5 domains. Participants completed the 15-item questionnaire at baseline to give a retrospective analysis of HRQoL in the 6 months prior to fracture, and in the past week at 6-month follow-up. This was to determine the rate of return to pre-fracture HRQoL.
Cost-utility analysis
Effectiveness was measured in terms of quality adjusted life years (QALY) gained. The preference-based scoring algorithm developed by Hawthorne et al. (25) was used to calculate individual utility scores for participants at baseline and at 6 months. The algorithm creates a utility value based on the responses to 12 of the 15 items of the AQoL. The utility value is created on a scale where zero represents a health state equivalent to death and 1 represents perfect or full health. Negative values are possible, indicating a very poor health state considered worse than death. The valuations for the preference based scoring algorithm were based on the preference weights of 350 members of the Australian general population.
The economic evaluation was undertaken on an intention to treat basis. Discounting of costs was not undertaken, as the time horizon of the study was less than 1 year. A utility value of zero was imputed for those participants who were deceased at the 6-month follow-up point. For the healthcare costs of those who died, a single mean imputation method was utilized, which has been identified as an appropriate method to utilize in cases where the overall rate of missingness is small, i.e. less than 5% (26). The QALY gain over the 6-month period was calculated using the area under the curve method (27). The difference in healthcare costs between the intervention and the control group was divided by the difference in QALY gain to give an incremental cost-effectiveness ratio (ICER) of cost per QALY gained (i.e. ICER=Ca–Cb/Ea–Eb, where Ca is the cost of the intervention, Cb is the cost of the control, Ea is the effectiveness of the intervention, Eb is the effectiveness of the control). For calculation of QALY gain, baseline AQOL utility scores were imputed based on the scores derived in a similar population of older people immediately post hip fracture participating in an intervention study (see (28) for the study protocol).
Statistical analysis
Statistical analysis was undertaken using IBM SPSS Statistics Version 19.0. Although the likely skewed nature of cost data collected for economic evaluations is well described, the standard arithmetic mean and t-test were used to compare differences in the costs between the groups, as recommended previously (29). Findings are presented as mean values with standard deviations, and differences between groups as mean difference with 95% confidence intervals. Probabilistic sensitivity analysis (PSA) was undertaken using bootstrapping to provide an estimate of the uncertainty surrounding the ICER (30). This was achieved through re-sampling the original data to replicate the results of the ICER 1000 times, giving an empirical estimate of the sampling distribution.
RESULTS
All patients admitted with a hip fracture were screened at the 4 eligible hospitals over the recruitment period from June 2007 to April 2010. A total of 1,514 patients were admitted across the 4 sites during this period and, of these, 319 were eligible. A total of 175 patients (55%) were recruited to the trial. Eighty-six participants were randomly allocated to receive the intervention, while 89 were allocated to the attention control. Demographic characteristics were very similar across both groups (Table II).
|
Table II. Baseline characteristics of participants |
|||
|
Characteristic |
Intervention (n = 86) |
Control (n = 89) |
p-value |
|
Age, years, mean (SD) |
82.4 (5.7) |
83.0 (6.2) |
0.506 |
|
Female, n (%) |
58 (67.4) |
77 (86.5) |
0.002 |
|
MMSE score, mean (SD) |
26 (4) |
26 (4) |
1 |
|
Surgical procedure n (%) Internal fixation Replacement |
53 (61.6) 33 (38.4) |
44 (49.4) 45 (50.6) |
0.105 0.143 |
|
SD: standard deviation; MMSE: Mini-Mental State Examination. |
|||
Ten participants out of the 175 (5.7%) refused to complete an AQoL assessment or had withdrawn from the study at the 6-month time-point, and were therefore excluded from the cost-utility calculations. Those participants (n = 8, intervention n = 4 and control n = 4) who died during the 6-month follow-up were allocated a utility score of 0 for the 6-month time-point.
Costs
Utilization of healthcare resources for the intervention and control group over 6 months are shown in Table III. The results of the independent samples t-test for comparisons between the groups are also shown. An overview of the mean costs for the control and intervention groups across the 6-month time-period is shown in Table IV. There was little difference in the overall healthcare costs between the 2 groups, with a mean difference of $AUD 575 (95% CI –5,876 to 7,025, p = 0.861). It can be seen that by far the greatest proportion of total costs for both intervention and control groups is attributable to hospitalizations, accounting for a mean of over $AUD 30,000. Overall, the additional cost of providing the intervention to the participants was approximately $AUD 1,000. The intervention group used less resources in post-hospital rehabilitation (ambulatory and day rehabilitation) services, other allied health providers, and residential and transitional care services than the control group, although this did not reach statistical significance.
|
Table III. Mean utilizations of healthcare resources over 6 months for the intervention and control groups |
|||
|
Resource |
Utilizations for the intervention Mean (SD) |
Utilizations for the control Mean (SD) |
Difference in utilizations Mean (95% CI) |
|
Community dietetics visit |
0.0 (0.1) |
0.0 (0.3) |
0.0 (–0.1 to 0.0) p = 0.263 |
|
Community physical therapist visit |
1.1 (2.2) |
1.2 (2.1) |
–0.1 (–0.8 to 0.5) p = 0.657 |
|
Other allied health visit |
0.3 (0.9) |
0.5 (1.3) |
–0.2 (–0.6 to 0.1) p = 0.205 |
|
Trial dietetics visit (min) |
420.9 (126.0) |
273.4 (101.0) |
147.5 (113.5 to 181.5) p = 0.000 |
|
Trial physio visit (min) |
371.0 (98.0) |
221.5 (96.8) |
149.4 (120.4 to 178.5) p = 0.000 |
|
Trial staff travel time (min) |
396.4 (417.2) |
318.4 (318.4) |
77.9 (–39.1 to 195.0) p = 0.191 |
|
Oral nutritional supplements |
108.9 (91.4) |
0.0 (0.0) |
108.9 (89.3 to 128.5) p = 0.000 |
|
Protein powder supplement |
0.4 (1.1) |
0.0 (0.0) |
0.4 (0.1 to 0.6) p = 0.004 |
|
Ankle and wrist weights recommended |
1.3 (1.2) |
0.0 (0.0) |
1.3 (1.1 to 1.6) p = 0.000 |
|
Number of days in hospital |
32.7 (19.9) |
32.5 (20.3) |
0.3 (–5.7 to 6.3) p = 0.932 |
|
Drugs claimed on Medicare |
27.6 (23.9) |
22.6 (17.7) |
5.0 (–1.4 to 11.3) p = 0.124 |
|
Medical tests claimed on Medicare |
21.4 (34.1) |
22.6 (29.8) |
–1.1 (–10.7 to 8.5) p = 0.817 |
|
Doctor consultations at home or hospital claimed on Medicare |
2.5 (4.5) |
3.6 (6.5) |
–1.1 (–2.8 to 0.6) p = 0.198 |
|
Doctor consultations in consulting rooms claimed on Medicare |
13.8 (14.2) |
15.6 (17.7) |
–1.8 (–6.7 to 3.0) p = 0.456 |
|
Residential care facilities consults claimed on Medicare |
0.7 (2.9) |
0.6 (2.7) |
0.1 (–0.7 to 1.0) p = 0.780 |
|
Procedures claimed on Medicare |
4.2 (6.9) |
4.4 (6.9) |
–0.2 (–2.3 to 1.8) p = 0.821 |
|
Other claims on Medicare |
0.8 (2.1) |
1.0 (3.0) |
–0.2 (–1.0 to 0.6) p = 0.577 |
|
Number of days in residential transitional care programme |
4.2 (15.7) |
4.2 (17.2) |
–0.1 (–5.0 to 4.9) p = 0.984 |
|
Number of days in the day rehabilitation programme |
2.6 (10.2) |
2.9 (12.9) |
–0.3 (–3.8 to 3.2) p = 0.863 |
|
Number of days in the ambulatory rehabilitation programme |
2.6 (7.8) |
3.7 (9.0) |
–1.1 (–3.6 to 1.4) p = 0.379 |
|
Number of days in HLC residential care |
4.0 (23.3) |
3.7 (20.5) |
0.2 (–6.3 to 6.8) p = 0.944 |
|
Number of days in LLC residential care |
3.3 (21.5) |
4.9 (27.1) |
–1.6 (–9.0 to 5.7) p = 0.659 |
|
Number of days in respite in residential aged care facility |
0.4 (2.6) |
1.1 (5.8) |
–0.7 (–2.0 to 0.7) p = 0.334 |
|
CI: confidence interval; LLC: low-level care; HLC: high-level care; SD: standard deviation. |
|||
|
Table IV. Mean costs for control and intervention groups over 6 months ($AUD) |
|||
|
Resource |
Across 6 months |
||
|
Cost for the intervention (n = 86) Mean (SD) |
Cost for the control (n = 89) Mean (SD) |
Difference in cost Mean (95% CI) |
|
|
Total healthcare plus residential care costs |
44,840 (22,757) |
44,265 (20,448) |
575 (–5,876 to 7,025) p = 0.861 |
|
Total healthcare only excluding residential care costs |
42,626 (19,341) |
41,906 (18,364) |
719 (–4,906 to 6,346) p = 0.801 |
|
Hospitalizations |
34,037 (18,114) |
33,942 (16,566) |
95 (–5,081 to 5,271) p = 0.971 |
|
Community, allied health and rehabilitation services |
1,747 (4,575) |
2,175 (4,874) |
–427 (–1,839 to 984) p = 0.551 |
|
Residential and transition care services |
2,242 (6,675) |
2,435 (7,042) |
–193 (–2,242 to 1,856) p = 0.853 |
|
Drugs |
993 (1,505) |
691 (930) |
302 (–76 to 681) p = 0.116 |
|
Tests |
583 (810) |
681 (960) |
–98 (–366 to 169) p = 0.470 |
|
Consultations |
1,179 (1,435) |
1,405 (1,737) |
–226 (–706 to 254) p = 0.354 |
|
Procedures |
1,097 (2,058) |
1,128 (2,013) |
–32 (–644 to 581) p = 0.919 |
|
Other |
54 (176) |
69 (234) |
–16 (–78 to 47) p = 0.621 |
|
Intervention |
1,125 (1,222) |
– |
1,125 (760 to 1,490) p = 0.000 |
|
AUD: Australian dollar; CI: confidence interval; SD: standard deviations. |
|||
Outcomes
The utility of the participant’s self-reported QoL, as measured using the AQoL tool, is shown in Table V. There is a small difference between the groups at 6 months in favour of the intervention indicating the intervention group reported a higher mean QoL than the control group, although this did not reach statistical significance.
|
Table V. Utility score for the intervention and control groups across 6 months |
|||
|
Time-point |
Intervention Mean (SD) |
Control (n = 88) Mean (SD) |
Difference (95% CI) in mean |
|
6 months prior to baseline (n = 174) |
0.595 (0.245) |
0.592 (0.244) |
0.003 (–0.070 to 0.076) p = 0 .93 |
|
Imputed baseline1 |
0.188 (0.192) |
0.188 (0.192) |
– |
|
6 months (n = 165)2 |
0.498 (0.264) |
0.466 (0.297) |
0.032 (–0.055 to 0.118) p = 0.47 |
|
Regain in utility from baseline to 6 months (n = 164)2 |
0.157 (0.376) |
0.084 (0.379) |
0.073 (–0.435 to 0.190) p = 0.218 |
|
1Imputed based upon baseline AQoL scores within 7 days following hip fracture from a similar population (n = 99). 2Including imputed value of 0 for participants who were deceased at the time-point. AQoL: Assessment of Quality of Life; CI: confidence interval; SD: standard deviation. |
|||
Overall both groups saw a decrease in utility score for HRQoL at 6 months compared with recollections of QoL prior to fracture. The mean difference in utility score recollected prior to surgery between the groups was extremely small (0.003), indicating that both groups recollect their health states prior to the fracture as similar.
Cost-utility analysis
The incremental cost effectiveness ratio (ICER) for the intervention is presented in Table VI, using QALY gain based on the utility scores derived from the AQoL. Calculation of utilities excluded the small number of participants (n = 10) who refused assessment or withdrew from the study at the 6-month time-point. For those participants who died during the follow-up period, given that this was a relatively small number of participants (8/165 or 4.9% of total participant group), the single mean imputation method was used to impute costs for this group (26).
|
Table VI. Differences in quality adjusted life years (QALY) gain and cost effects and incremental cost-effectiveness ratio between the intervention and control groups over 6 months |
|||
|
Variable |
Intervention Mean (SD) |
Control Mean (SD) |
Difference in means |
|
Health resource cost ($AUD) (n = 165)a |
45,331 (23,012) |
44,764 (20,712) |
567 (–6,166 to 7,300) p = 0.868 |
|
QALY-gain (AQoL) (n = 165)b |
0.155 (0.132) |
0.139 (0.149) |
0.02 (–0.027 to 0.059) p = 0.470 |
|
ICER ($AUD) imputation |
– |
– |
28,350 (intervention dominates to 51,768) |
|
aIncluding n = 165 participants with complete AQOL data at 6 months. bIncluding imputed value of 0 for participants who were deceased at the time-point. AUD: Australian Dollars; AQoL: Assessment of Quality of Life; CI: confidence interval; ICER: incremental cost-effectiveness ratio; SD: standard deviation. |
|||
At 6 months the programme was associated with a small additional cost and a gain in QALY relative to usual care with social visits. The incremental cost-effectiveness ratio (ICER) for the intervention is positive, with a mean of $AUD 28,350 at 6 months. This ICER is well below the threshold of $AUD 50,000 estimated as likely to be considered cost-effective by the Pharmaceutical Benefits Advisory Committee (PBAC) (31).
The validity of the base case results at the 6-month time-point was confirmed by a PSA using bootstrapping where the original data were used to provide an empirical estimate of the sampling distribution through repeated re-sampling from the observed data (30). The results of the probabilistic sensitivity analysis are represented graphically through a cost-effectiveness plane (Fig. 1) and cost-effectiveness acceptability curve (Fig. 2).
In interpreting the results of the cost-effectiveness plane, observations falling in the north-west quadrant indicate that the existing treatment is less costly and more effective than the new treatment, and in the south-east quadrant indicate that the new treatment is less costly and more effective than the existing treatment. Observations falling in the north-east quadrant indicate that the new intervention is more effective, but also more costly than the existing treatment, and in the south-west quadrant that the new treatment is considered less effective but also less costly than the existing treatment. Decision of cost-effectiveness for the north-east and south-west quadrants is dependent on whether society considers the change in health outcomes or costs acceptable for the change in the alternative.
For the current study, the cost-effectiveness acceptability plane indicates the majority of the observations are in the north-east (38.02% of observations) and south-east quadrants (38.38% of observations) of the plane. Therefore, the majority of the observations generated through the sensitivity analysis indicate either that the intervention provides more health outcomes at a lower cost than the existing treatment or provides more health outcomes, but at a higher cost than the existing treatment. The remainder of the observations are spread in the north-west (17.66%) and south-west (5.94%) quadrants of the plane.
However, the large spread of the data-point cloud in Fig. 1 indicates the uncertainty in this data. Fig. 2 shows the cost-effectiveness acceptability curve. Assuming a willingness to pay threshold for a QALY of $AUD 50,000, the curve indicates a probability that the ICER would fall under this threshold of approximately 50%. The relatively flat cost-effectiveness acceptability curve (Fig. 2) also indicates a high level of uncertainty in the cost-effectiveness result based on this data. This is partly reflective of the relatively small sample size for the randomized control trial coupled with the frail population under consideration. In this study, the mean estimates mask a wide variation mainly in relation to the frequency of hospital admissions and associated lengths of stay. The results range from a lower limit whereby the intervention dominates (i.e. it is associated simultaneously with a lower costs and a higher health gain) relative to a higher limit of $AUD 51,768, which is just above the implied Australian societal willingness to pay threshold value for a QALY of $AUD 50,000 (31).
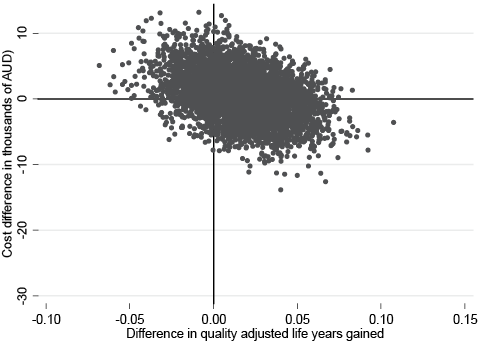
Fig. 1. Cost-effectiveness plane for the difference in quality adjusted life years (QALY). Percentage of observations in each quadrant: north-east = 38.02%, south-east = 38.38%, south-west = 5.94%, north-west = 17.66%. AUD: Australian dollars.
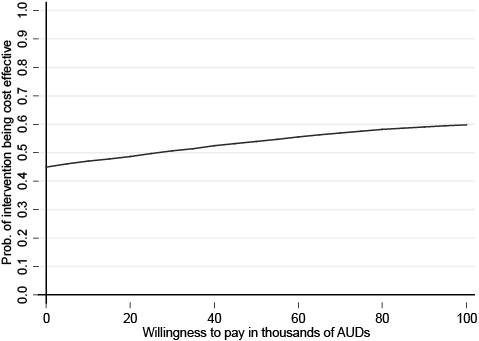
Fig. 2. Cost-effectiveness acceptability curve for difference in quality adjusted life years (QALY). AUD: Australian dollars.
DISCUSSION
While previous studies have evaluated the costs and benefits of providing multidisciplinary geriatrician-led care for hip fracture patients (4–6, 32), our study is the first to evaluate the specific combination of nutrition and exercise therapy over a 6-month follow-up period.
A cost-benefit analysis of high-intensity strength training in 114 patients following a hip fracture found cost savings of $US 150,974 in the intervention group compared with the control through reduced health and social care costs (33), although in the current study no significant difference in healthcare costs was found (33, 34).
One cost-utility study of nutrition therapy post hip fracture has been published, and this identified an ICER Cost/QALY of approximately $AUD 54,000 (35). Little change in the QALY gain was found between the 2 groups, with a difference in means of –0.02 (95% CI –0.12 to 0.08, p > 0.05), which accounts for the larger ICER in comparison with the current study despite their smaller intervention costs (€613). The study used the EQ-5D as their measurement of QoL in the population, which the authors hypothesized may not be sensitive enough to identify changes in elderly patients. For our study we have utilized the AQOL tool, which has the most comprehensive descriptive system of any current existing generic preference-based instrument for the calculation of QALYs and, as such, this may have resulted in a more sensitive measurement of QoL.
The majority of previously identified economic evaluations of nutrition or exercise therapy utilize a cost-effectiveness or cost-benefit methodology for their analysis (33, 34, 36) comparing cost data with a wide variety of monetary or clinical outcomes, such as changes to body composition, length of stay, falls and medical complications. These all form important outcomes in a rehabilitation or nutritional sense, but reported individually show only a portion of the benefits to be gained in improving the health and wellbeing of patients. On the other hand, the benefit of conducting a cost-utility study is that it provides a standardized measure of benefits in the QALY, which measures the benefits of the intervention broadly, and allows comparisons in a unit that maintains its meaning across different populations and health sectors, making it the preferred method of economic evaluation of regulatory bodies in Australia and around the world (20, 27, 37). It has been estimated that in Australian Pharmaceutical Benefits Advisory Committee (PBAC) considers interventions evaluated to give a cost per QALY of under $AUD 50,000 as highly likely to be cost-effective and more likely to be recommended for funding (31). Therefore, the individualized nutrition therapy and resistance exercise intervention, by providing improved utility for the intervention group compared with the control group across 6 months at a ICER of $AUD 28,000, is likely to be considered cost-effective. However, this result should be interpreted with caution, as the results of the cost-effectiveness acceptability curve indicate just over 50% certainty that the ICER would fall under the accepted $AUD 50,000/QALY range. Another factor to be considered in interpreting the results is that the control group included social visits that impacted on the costs and QoL for this group, and therefore the ICER in an intervention with these social visits may or may not also indicate likely cost-effectiveness.
Our study has some limitations. It is evident that there is wide variability in the cost data in our sample, with the probabilistic sensitivity analysis indicating that the true value for the ICER for QALY probably lies somewhere between the intervention dominating (i.e. provides both an improvement in QoL and reduction in costs) ranging up to a cost of $AUD 51,000 per QALY gained, which is just above the accepted upper threshold of cost-effectiveness in Australia. This probably eventuates from the wide range in the total costs for the participants, linked to the wide variation in number of hospital admissions, length of stay, and complications experienced. However, this situation is not unusual in economic analysis of treatment studies where the majority of participants will produce a moderate cost, but a few participants may experience more severe and rare health problems, which can have an exponential effect on costs (27) and is especially known to occur in populations of frail older adults, such as in this study (38, 39). Whilst the variability in the cost outcomes for the sample is reflected in the confidence intervals for the base case ICER, it is also important to note that the majority of the data-points estimated through the PSA remain under the upper implied threshold limit for the cost-effectiveness ratio in Australia (31).
A second limitation is the use of an imputed value for QoL at baseline. The QoL of the participants at baseline was measured as the QoL in the 6 months prior to the intervention. However, for calculating QALY gain between the 2 groups, an assessment of utility at the commencement of the intervention was required (27). Therefore, the mean utility score taken from a similar population of patients in the first 2 weeks following surgery for hip fracture was imputed for all participants in the QALY calculation (28). While this allows us to calculate the QALY gain for each group, it does not allow us to account for any differences in utility at baseline that may have been present in the 2 groups. Therefore, it is important to acknowledge that a difference in utility between the groups at baseline many have existed, which could influence differences in utility at the 6-month time-point. When asked about their utility in the 6 months prior to fracture, there was virtually no difference between the 2 groups. In addition, socio-demographic factors shown to influence QoL, such as age and cognitive status (40, 41), were similar between the 2 groups. Hence it may be reasonable to conclude that utility in the groups at the baseline time-point was also similar.
In summary, the aim of this study was to conduct a cost-utility study of a multidisciplinary nutrition and exercise therapy rehabilitation programme in patients following surgery for hip fractures. The results indicate that the intervention delivered an incremental QALY gain relative to usual care with attention control at a small additional cost, and hence demonstrates likely cost-effectiveness. However, future research should focus on larger samples of participants to provide more precision to the economic estimates and to provide more definitive evidence on the effectiveness of combined nutrition and exercise therapy. Longer time-frames of follow-up are also important to economic trials in this area, as the benefits of providing this therapy may lie not only with the effects on the current admission to healthcare services, but also in preventing subsequent admissions, or in reducing complicated care needs during those admissions. The potential effect of nutrition and exercise therapy in this age group as a moderator of hospital length of stay and complications experienced also provides a strong basis to measure resource use in micro-level approaches such as using diagnostic-related group-based costing in future studies. In addition, given the large impact that residential care admission made to total costs despite the relatively few patients who were admitted to care, resource use in this sector should be included in future economic evaluations in this population.
ACKNOWLEDGEMENTS
The trial was supported by a grant from the National Health and Medical Research Council (426758). Rachel Milte was supported by an Australian Postgraduate Award and Flinders University Research Scholarship. The authors would like to thank Dr Billingsley Kaambwa of Flinders Health Economics Group, Flinders University for assistance with analysis for this study.
REFERENCES

