Sigrid Skatteboe, MD1, Cecilie Røe, MD, PhD1, Paul B. Perrin, PhD3, Håkon Dalen, MD2, Erik Bautz-Holter, MD, PhD1, Astrid Nyquist, PhD1 and Martin Saebu, PhD2
From the 1Deparment of Physical Medicine and Rehabilitation, Oslo University Hospital, Oslo, 2Beitostølen Health Sports Centre, Beitostølen, Norway and 3Department of Psychology, Virginia Commonwealth University, Richmond, VA, USA
OBJECTIVE: To assess trajectories of autonomous and controlled motivation and physical activity over one year in subjects with chronic disabilities receiving rehabilitation. In addition, to assess whether improvements in motivation and clinical variables during rehabilitation predict physical activity.
DESIGN: Prospective interventional design.
METHODS: A total of 214 subjects with physical disabilities admitted to a 4-week rehabilitation stay were included in the study. Multi-level models were performed examining the trajectories of autonomous motivation, controlled motivation and physical activity over one year. Changes in motivation, pain, fatigue, physical and mental functioning and self-efficacy (clinical factors) from admission to discharge from rehabilitation were analysed using paired samples t-tests. Multiple linear regressions were applied to evaluate the influence of changes in clinical factors during rehabilitation on the level of physical activity after one year.
RESULTS: A significant effect of time on autonomous motivation was observed over one year. Higher exercise efficacy, physical functioning and education predicted a higher level of physical activity. However, improvement in autonomous motivation, self-efficacy, pain, fatigue, mental and physical functioning during rehabilitation did not predict the level of physical activity after 4 weeks or one year.
CONCLUSION: Rehabilitation based on adapted physical activity is associated with improvement in autonomous motivation. However, improvement in motivation was not related to short- or long-term effects on physical activity.
Key words: motor activity; disabled people; motivation; rehabilitation.
J Rehabil Med 2016; 48: 00–00
Correspondence address: Sigrid Skatteboe, Ullveien 19b, NO-0357 Oslo, Norway. E-mail: sjskatte@medisin.uio.no
Accepted Jan 20, 2016; Epub ahead of print Mar 2, 2016
INTRODUCTION
Chronic disability is generally defined as difficulty in functioning at a body, person, or societal level, in one or more life domains (1). A wide variety of diseases, trauma and other factors may contribute to disability. Common to many disabilities are reduced physical functioning and activity limitations. It is therefore not surprising that individuals with disabilities are half as active as able-bodied individuals (2). As for the general population, there are health benefits of physical activity among individuals with disabilities (3). The gap between the acknowledged benefits and the disadvantageous low activity level should make activity a prioritized goal of rehabilitation (4).
Motivation is essential for physical activity in the general population (5) and among individuals with disabilities (6). Self-determination theory (SDT) (7) divides motivation into 2 components. Controlled motivation is derived from external sources, such as physicians, trainers or media (8), while autonomous motivation is derived from oneself across 3 basic psychological needs: autonomy, relatedness and competence (9). Recent research has shown the importance of autonomous motivation for adherence to physical activity (8), and that it is associated with increased activity in people with physical disabilities (10). It is also noteworthy that maintenance of behaviours over time requires autonomous motivation for that behaviour (11). Conversely, controlled motivation is unrelated to long-term adherences and is less malleable (10).
Autonomous motivation is closely associated with motivation for a change in behaviour, and is a person’s confidence in the ability to perform new activities (12). This notion is often termed “self-efficacy” and is defined by Bandura as the perceived capability of a person to perform a specific action required to achieve a concrete goal (13). Self-efficacy has been shown to be a strong predictor of physical activity in individuals with disabilities (14).
In addition, the degree of impairment is closely related to physical activity in individuals with disabilities (15). However, it is challenging to reach a common assessment of impairment across different diseases and disabilities. The Medical Outcomes Study Form Health Survey family of patient-reported measurements are cross-culturally validated and have been applied in multiple medical conditions (16). The physical and mental component scores (PCS/MCS) reflect subjects’ overall perception of physical and mental functioning (17). Pain (18) and fatigue (19) are associated with disability, but may play a unique role for motivation in physical activity (20).
Adapted Physical Activity (APA)-based rehabilitation (21) includes physical activities adapted to the specific needs of each individual with a disability. The goal is to enhance the subject’s autonomy, motivation and ability to engage in physical activities, and ultimately increase physical activity over time. Although this type of rehabilitation is beneficial with respect to pain and functioning (22), we have less knowledge about its influence on motivation and physical activity levels over time.
Aims
The primary aim of the present study was to assess the trajectories of autonomous and controlled motivation and physical activity over 1 year in subjects with chronic disabilities receiving adapted physical activity (APA)-based rehabilitation. The secondary aim was to assess whether improvements in motivation and clinical variables during rehabilitation predicted physical activity after one year.
MATERIAL AND METHODS
Study design and ethics
The study has a prospective interventional design (ClinicalTrials.gov NCT01788397) and was approved by the Regional Medical Committee for Research Ethics in Norway (S-08837c 2008/21144). The trajectory of physical and mental functioning over 1 year is reported by Preede et al. (23).
Participants
People attending Beitostølen Health Sports Centre (BHC, Beitostølen, Norway) are all in need of rehabilitation due to physical disabilities. They are either referred from specialist healthcare (60%) or from general practitioners (40%). The duration of standard rehabilitation programmes is approximately 18–25 days. All patients aged 18–73 years admitted during the period 1 July 2010 to 1 August 2012 were eligible for the study. Exclusion criteria were: presence of severe cognitive dysfunction, inability to speak Norwegian, or not providing consent.
The reasons for disability included musculoskeletal problems with rheumatic diseases, which were the most frequent diagnostic entities, as well as neurological problems with cerebrovascular diseases, cerebral palsy, multiple sclerosis and inherited muscle disorders as the most frequent diagnostic entities. Other diseases causing disabilities included cardiovascular diseases, spinal cord injuries and visual impairments.
Procedure
Eligible subjects received written information about the study. Those who accepted the invitation signed an informed consent. Participants completed questionnaires at 6 time-points: at home 8 weeks before the rehabilitation programme (baseline), 4 weeks before rehabilitation, at admission to the rehabilitation facility, at discharge from rehabilitation, 4 weeks after rehabilitation and at the 1-year follow-up.
Rehabilitation programme at Beitostølen Health Sports Centre
The rehabilitation programme at BHC is based on the vision of Adapted Physical Activity (APA) (21), with the intent of quality physical activity adjusted to the specific needs of each individual with a disability. The activities offered by the rehabilitation centre range from daily activities, such as walking, stair-climbing and daily movements, to more sport-related activities, such as swimming, cross-country skiing, alpine skiing, horseback riding, aerobics, and kayaking, among others, with the intention to allow each individual to determine the activities that best suit the user. In addition, adaptation of the environment, technical aids, and individual instruction are included. The programme is intensive; between 2 and 5 h of physical activity a day, 6 days a week. Patients are not over-challenged, but rather helped to experience mastery in terms of the health behaviour change that needs to be engaged. An interdisciplinary team is organized for each subject, including a medical doctor, physiotherapists, nurses, social worker and sports pedagogues. The team establishes a detailed plan for rehabilitation. Goal planning is an essential part of the rehabilitation process, directed at enhancing subject autonomy, treatment adherence, and feelings of self-efficacy. The subject is an active participant, and the activity of the rehabilitation team aims to take into account the preferences of the individual, to enhance the patient’s autonomous motivation though autonomy-supportive behaviour. The plan, goals and schedules are continuously assessed, and adjusted if necessary. The rehabilitation includes social and cultural activities and extensive use of outdoor natural facilities on a year-round basis. Most of the activities are arranged in groups. The group arrangement is considered important because participants are facilitated to cooperate and exchange feedback and experiences. The patients’ feelings of relatedness to the rest of the group may also be important for the outcome of the rehabilitation stay, through an increased level of autonomous motivation. Overall, the 3 factors important for increased autonomous motivation (autonomy-support, experience of relatedness and the possibility to demonstrate competence (9)) are emphasized.
Primary outcomes
The 12-item Physical Activity Scale for Individuals with Physical Disabilities (PASIPD) (24) was used to measure physical activity. This scale assesses frequency of physical activity over the last 7 days in leisure activities, home activities, and at work. The PASIPD has been shown to correlate with objective measurements of physical activity in subjects with disabilities (25). Frequency of activity level is scored on a 4-point scale, representing never (zero days), seldom (1–2 days), sometimes (3–4 days) and often (5–7 days). The mean time duration of a performed activity is scored on a separate 4-point scale (< 1, 1–2, 2–4 and > 4 h). The scoring for PASIPD was created by multiplying the mean hours per day for each item by the metabolic equivalent of the task (MET) associated with the intensity of the activity, rendering scoring units in MET h/day, ranging from 0 to 199.5 (24). The PASIPD was translated into Norwegian by a bilingual researcher, with back-translation into English by a second bilingual translator to ensure conceptual accuracy.
Motivation towards physical activity and exercise was assessed by the 19-item Behavioral Regulation in Exercise Questionnaire (BREQ-2) (26). The scale comprises 5 subscales: amotivation with 4 items (e.g. “I don’t see why I should have to exercise”), external regulation with 4 items (e.g. “I exercise because other people say I should”), introjected regulation with 3 items (e.g. “I feel guilty when I don’t exercise”), identified regulation with 4 items (e.g. “I value the benefits of exercise”), and intrinsic motivation with 4 items (e.g. “I exercise because it’s fun”). The items are scored on a 5-point Likert scale, ranging from 0 “Not true for me,” to 4 “Very true for me.” The 2 BREQ-2 subscales “Identified regulation” and “Intrinsic regulation” were merged into the variable autonomous motivation, and “External regulation” and “Introjected regulation” were merged into the variable called controlled motivation (8). Mean item scores are reported for each subscale. The scale was originally tested in a sample with 194 subjects, shown to have an acceptable internal consistency, and reliability was confirmed with Cronbach’s alpha scores ranging from 0.73 to 0.86 for each item. The instrument has been tested recently in a Norwegian population (27).
Assessments
Demographic data were recorded during an interview with the medical doctor on arrival at the rehabilitation institution, including age, gender, education, residence and employment. Diagnoses were obtained from the participant’s application for the rehabilitation stay. The main reasons for disability were grouped according to disorders of the nervous system, disorders of the musculoskeletal system and other disorders.
Perceived physical and mental functioning was measured by the Medical Outcomes Study 12-item Short Form Health Survey (SF-12) (28), license number QM027126, Norwegian version by Loge et al. (29). The SF-12 consists of 12 items and yields a Physical Component Summary (PCS) and Mental Component Summary (MCS), which are intended to reflect perceived physical and mental health, respectively. The SF-12 has been shown to account for almost 90% of the variance in the SF-36, reflects the same dimensions, and is less time-consuming than the SF-36 (28). The answers were given on a Likert-type scale, with 3 or 5 scoring levels for the different items. The PCS and MCS norm-based scores for the SF-12 were calculated using the reversed scores of questions 1, 8, 9 and 10 (30). Pain and fatigue were measured on visual analogue scales (VAS) (31) from zero (no pain/fatigue is no problem) to 100 mm (worst imaginable pain/ fatigue is a major problem) over the past week (32).
Efficacy for managing chronic disease (Chronic disease – efficacy) was measured by the “Self-Efficacy for Managing Chronic Disease 6-Item Scale” (33). A sample item is: “How confident are you that you can keep the fatigue caused by your disease from interfering with the things you want to do?” Responses were given on a 10-point Likert-type scale, ranging from not at all confident (score 1) to totally confident (score 10). The scale has been tested for validity in a sample of 605 subjects with a variety of chronic diseases and has demonstrated high internal consistency, with a Cronbach’s alpha of 0.91 (33). Efficacy for regular exercise (Exercise – efficacy) was measured by the Exercise Regularly Scale (3-item scale) in the Stanford Chronic Disease Self-Efficacy Scales (34). A sample item is: “How confident are you that you can do aerobic exercise such as walking, swimming, or bicycling 3 to 4 times each week?” Responses were given on a 10-point Likert-type scale, ranging from not at all confident (1) to totally confident (10). The scale has been tested for validity in a sample with 478 subjects with chronic diseases; internal consistency was 0.83, and test-retest reliability was 0.86 (34).
Efficacy for social/recreational activities (social-efficacy) was measured by the Social/Recreational Activities Scale (2-item scale) in the Stanford Chronic Disease Self-Efficacy Scales (34). A sample item is: “How confident are you that you can continue to do your hobbies and recreation?” Responses were given on a 10-point Likert-type scale, ranging from not at all confident (1) to totally confident (10). The scale has been tested for validity in a sample with 478 subjects with chronic disease; internal consistency was 0.84, and test-retest reliability was 0.84 (34).
Statistics
Multi-level models (MLMs) (35) were utilized choosing the mixed model option in SPSS, to examine whether linear trajectories of autonomous and controlled motivation (BREQ-2 scores) and physical activity (PASIPD) over 1 year could be predicted by any of the following: time, sex, age, type of disability, education, social status, employment, pain, fatigue, physical and mental functioning, and self-efficacy. The respective mean was subtracted from all continuous variables for the purpose of centring them. The disability categories were merged into 2 groups (neurological and other) for the purpose of the MLMs analysis. Intercept for random effect, variance components covariate type and maximum likelihood methods were used in the MLM models, otherwise no random effects were included at the patient level. Separate models were run with autonomous and controlled motivation at 6 time-points (8 weeks before the rehabilitation programme, 4 weeks before rehabilitation, at admission to rehabilitation, at discharge from rehabilitation, 4 weeks after rehabilitation, and at a 1-year follow-up) as the dependent variables. A third model with physical activity as the dependent variable at 5 time-points (omitting the time of discharge from rehabilitation) was also conducted. The 3 MLMs were then accompanied by a second set of MLMs, to examine whether any of the statistically significant fixed effects in the first models interacted significantly with time. MLM handles missing data by full information maximum likelihood (FIML) estimation (35) and therefore is able to solve several problems associated with traditional linear regression by providing a better estimate of standard errors and extremely accurately accommodating for missing data, maximizing predictive precision.
Paired sample t-tests were conducted to evaluate the change between admission and discharge from the rehabilitation intervention for pain, fatigue, efficacy and MCS and PCS, and autonomous and controlled motivation, as well as to evaluate whether changes remained at the 1-year follow-up.
Multiple linear regression analysis was used to assess the relationship between the level of physical activity at 4 weeks and 1 year after rehabilitation (dependent variables), and the independent variables age, sex and education, type of disability, social status and employment (dichotomous), and changes in pain, fatigue, physical and mental functioning, self-efficacy and autonomous and controlled motivation (continuous) during rehabilitation. Spearman’s correlation analysis was applied, and only predictors correlating below < 0.7 were entered. All analyses controlled for baseline level of physical activity. The regression analysis was also evaluated regarding multi-collinearity and homoscedasticity. Explained variance for the unadjusted and adjusted models (R2) is reported.
All data were analysed using SPSS version 22 (36).
RESULTS
A total of 321 subjects admitted to rehabilitation were assessed for eligibility. Of the 304 eligible subjects, 246 consented to participation. The non-consenting subjects had a mean age 49 years and 55% were females; there was no significant difference between consenting and non-consenting subjects with regard to age or gender (p > 0.180). A total of 32 subjects dropped out before or during the intervention, and 6 of these did not return any questionnaires. This resulted in 214 subjects who completed rehabilitation and were included in the analysis. The gender (56% females) and age (47 years) of the 32 subjects who dropped out did not differ significantly from the subjects included in the data analysis (p > 0.087) (Table I). Table I shows the characteristics of the included subjects (n = 214) and the 32 drop-outs.
|
Table I. Characteristics of the 214 included subjects and 32 drop-outs |
||
|
|
Included subjects (n = 214) n (%) |
Drop-outs (n = 32) n (%) |
|
Sex (female) |
120 (56) |
18 (56) |
|
Education (university level) |
95 (44) |
14 (44) |
|
Employed |
76 (36) |
10 (31) |
|
Living in township > 30,000 |
120 (56) |
15 (48) |
|
Living condition (alone) |
74 (35) |
14 (44) |
|
Target group |
|
|
|
Nervous system |
102 (48) |
16 (50) |
|
Musculoskeletal |
64 (30) |
10 (31) |
|
Others |
48 (22) |
6 (18) |
|
|
(n = 185) Mean (SD) |
(n = 24) Mean (SD) |
|
Pain (VAS) |
36.64 (26.24) |
51.24 (30.32) |
|
Tiredness (VAS) |
49.37 (30.61) |
53.33 (32.94) |
|
Physical Component Score |
37.20 (9.62) |
35.82 (7.82) |
|
Mental Component Score |
49.31 (10.50) |
42.80 (10.70) |
|
Exercise efficacy |
7.53 (2.09) |
6.89 (2.00) |
|
Social efficacy |
6.95 (2.39) |
6.29 (2.36) |
|
Efficacy chronic disease |
6.55 (1.83) |
6.64 (1.70) |
|
SD: standard deviation; VAS: visual analogue scale. |
||
In the MLM with autonomous motivation as the dependent variable, time yielded a statistically significant effect (p < 0.001), suggesting that motivation improved with time (Table II). In particular, the increase took place during rehabilitation, and declined markedly from 4 weeks to the 1-year follow-up (Fig. 1), with the 1-year follow-up not being significantly different from baseline (p = 0.24). Participants with a higher exercise efficacy (p = 0.05) had a higher level of autonomous motivation. None of the predictors showed significant interactions with time.
|
Table II. Multilevel models with time, demographic factors, self-efficacy, fatigue and pain as predictors for autonomous motivation (BREQ-2), controlled motivation (BREQ-2) and physical activity (PASIPD) |
|||||||||||
|
|
Autonomous motivation |
|
Controlled motivation |
|
Physical activity |
||||||
|
Estimate |
95% CI |
p |
|
Estimate |
95% CI |
p |
|
Estimate |
95% CI |
p |
|
|
Age |
0.00 |
0.00 to 0.00 |
0.91 |
|
0.00 |
0.00 to 0.00 |
0.70 |
|
0.01 |
–0.15 to 0.16 |
0.95 |
|
Sex (female) |
0.02 |
–0.07 to 0.11 |
0.68 |
|
0.06 |
–0.03 to 0.15 |
0.20 |
|
1.96 |
–1.94 to 5.86 |
0.32 |
|
Higher education |
0.04 |
–0.06 to 0.14 |
0.44 |
|
0.01 |
–0.09 to 0.10 |
0.87 |
|
–4.92 |
–8.98 to –0.85 |
0.02* |
|
Living in township >30,000 |
0.04 |
–0.06 to 0.13 |
0.46 |
|
0.02 |
–0.07 to 0.12 |
0.62 |
|
0.51 |
–3.51 to 4.53 |
0.80 |
|
Employment |
–0.09 |
–0.19 to 0.01 |
0.09 |
|
–0.05 |
–0.15 to 0.04 |
0.29 |
|
0.93 |
–3.26 to 5.11 |
0.66 |
|
Living alone |
–0.01 |
–0.11 to 0.09 |
0.85 |
|
0.00 |
–0.10 to 0.09 |
0.92 |
|
0.33 |
–3.70 to 4.35 |
0.87 |
|
Target group (nervous system) |
0.03 |
–0.07 to 0.12 |
0.54 |
|
0.03 |
–0.06 to 0.12 |
0.53 |
|
–3.22 |
–7.12 to 0.68 |
0.10 |
|
Time |
0.02 |
0.01 to 0.02 |
0.00* |
|
0.00 |
0.00 to 0.01 |
0.37 |
|
0.14 |
–0.66 to 0.93 |
0.74 |
|
Tiredness (VAS) |
0.00 |
0.00 to 0.00 |
0.89 |
|
0.00 |
0.00 to 0.00 |
0.94 |
|
–0.01 |
–0.08 to 0.07 |
0.84 |
|
Pain (VAS) |
0.00 |
0.00 to 0.00 |
0.54 |
|
0.00 |
0.00 to 0.00 |
050 |
|
0.06 |
–0.03 to 0.15 |
0.18 |
|
Mental Component Score |
0.00 |
0.00 to 0.01 |
0.46 |
|
0.00 |
–0.01 to 0.01 |
0.96 |
|
–0.08 |
–0.31 to 0.15 |
0.51 |
|
Physical Component Score |
0.00 |
0.00 to 0.01 |
0.16 |
|
0.00 |
0.00 to 0.01 |
0.44 |
|
0.44 |
0.18 to 0.69 |
0.00* |
|
Exercise efficacy |
0.03 |
0.00 to 0.05 |
0.05* |
|
0.02 |
0.00 to 0.05 |
0.09 |
|
1.47 |
0.40 to 2.54 |
0.01* |
|
Social efficacy |
–0.02 |
–0.04 to 0.01 |
0.20 |
|
0.00 |
–0.02 to 0.02 |
0.95 |
|
–0.48 |
–1.43 to 0.47 |
0.32 |
|
Efficacy chronic disease |
0.00 |
–0.04 to 0.03 |
0.88 |
|
–0.02 |
–0.05 to 0.02 |
0.36 |
|
–0.27 |
–1.74 to 1.20 |
0.72 |
|
*Significant p ≤ 0.05. VAS: visual analogue scale; CI: confidence interval. |
|||||||||||
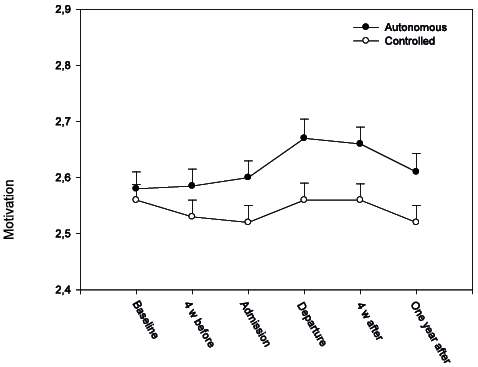
Fig. 1. Multilevel models of autonomous and controlled motivation (Behavioral Regulation in Exercise Questionnaire; BREQ-2) at baseline, 4 weeks before rehabilitation (4 weeks before), at admission, at departure, 4 weeks after rehabilitation (4 weeks after) and after 1 year. Mean and standard error (SE) reported.
Controlled motivation was unchanged over the 6 time-points (Table II, Fig. 1). No statistically significant predictors were found.
The third MLM with physical activity as the dependent variable demonstrated that subjects with higher physical functioning (PCS) (p < 0.001) and higher exercise efficacy (p = 0.01) had higher physical activity. In addition, subjects with higher education were more physically active. However, none of the predictors significantly interacted with time (Table II, Fig. 2).
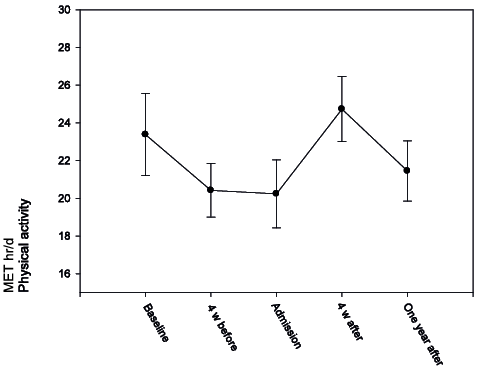
Fig. 2. Multilevel models of physical activity (Physical Activity Scale for Individuals with Physical Disabilities; PASIPD) at baseline, 4 weeks before rehabilitation (4 weeks before), at admission, 4 weeks after rehabilitation (4 weeks after) and after 1 year. Mean and standard error (SE) reported.
During rehabilitation, autonomous motivation increased significantly (p = 0.01), while controlled motivation remained unchanged (p = 0.15). The levels of pain and fatigue were significantly reduced during rehabilitation (p < 0.001), whereas physical and mental functioning increased (p < 0.001). Self-efficacy improved, as indicated by significant increases in all 3 subscales (p < 0.001) (Table III).
|
Table III. Changes in clinical factors during rehabilitation scores and paired-sample t-tests values |
|||
|
|
Admission Mean (SD) |
Discharge Mean (SD) |
p-value |
|
Pain (VAS) |
36.46 (27.66) |
28.07 (24.99) |
0.00* |
|
Tiredness (VAS) |
47.87 (30.21) |
37.11 (28.37) |
0.00* |
|
Physical Component Score |
38.47 (9.39) |
42.26 (8.28) |
0.00* |
|
Mental Component Score |
50.91 (10.48) |
56.12 (8.37) |
0.00* |
|
Exercise efficacy |
7.48 (2.07) |
7.99 (1.74) |
0.00* |
|
Social efficacy |
7.18 (2.26) |
8.32 (1.78) |
0.00* |
|
Efficacy chronic disease |
6.68 (1.88) |
0.41 (1.92) |
0.00* |
|
Autonomous motivation |
2.59 (0.43) |
2.65 (0.41) |
0.01* |
|
Controlled motivation |
2.54 (0.43) |
2.56 (0.40) |
0.15 |
|
SD: standard deviation; VAS: visual analogue scale; CI: confidence interval. |
|||
As changes in autonomous and controlled motivation correlated (Spearman’s rho = 0.890), only autonomous motivation was included in the regression analysis. However, the improvement in clinical factors during rehabilitation did not influence the level of physical activity at 4 weeks (n = 200) or at 1-year follow-up (n = 185). Data for the 1-year follow-up are reported in Table IV. Moreover, these changes explained only 14.2% of the variance in physical activity level and 4% when omitting PASIPD at baseline. The PASIPD level at admission to rehabilitation was similar for the 185 who completed the 1-year follow-up and the 29 non-completers (p = 0.909).
|
Table IV. Multiple regression model with demographic factors and changes in clinical factors during rehabilitation as predictors of physical activity at – year follow-up. The model is controlled for physical activity (PASIPD) at baseline (n = 185) |
||||||
|
|
Unstandardized |
|
Standardized |
|||
|
Beta |
SE |
|
β |
p |
95% CI |
|
|
Sex (female) |
–0.05 |
0.11 |
|
–0.04 |
0.63 |
–0.27 to 0.16 |
|
Age |
3.02 |
2.95 |
|
0.08 |
0.31 |
–2.81 to 8.84 |
|
Higher education |
–1.35 |
2.91 |
|
–0.03 |
0.64 |
–7.09 to 4.39 |
|
Physical activity (PASIPD) baseline |
0.32 |
0.06 |
|
0.40 |
0.00* |
0.21 to 0.43 |
|
Tiredness (VAS) |
0.98 |
1.00 |
|
0.09 |
0.33 |
–0.14 to 0.07 |
|
Pain (VAS) |
–0.45 |
0.94 |
|
–0.04 |
0.63 |
–0.12 to 0.13 |
|
Physical Component Score |
–0.09 |
1.07 |
|
–0.01 |
0.93 |
–0.59 to 0.33 |
|
Mental Component Score |
–0.04 |
0.06 |
|
–0.05 |
0.52 |
–0.44 to 0.32 |
|
Exercise efficacy |
0.00 |
0.06 |
|
0.00 |
0.99 |
–1.00 to 2.96 |
|
Social efficacy |
–0.13 |
0.23 |
|
–0.05 |
0.57 |
–2.31 to 1.41 |
|
Efficacy chronic disease |
–0.06 |
0.19 |
|
–0.03 |
0.74 |
–2.21 to 2.03 |
|
Autonomous motivation |
–4.07 |
4.21 |
|
–0.07 |
0.34 |
–12.38 to 4.24 |
|
R2 0.185, R2 adjusted 12.8. *p < 0.05. 95% CI: 95% confidence interval; SE: standard error; VAS: visual analogue scale; PASIPD: Physical Activity Scale for Individuals with Physical Disabilities. |
||||||
DISCUSSION
The time effect on autonomous motivation suggested an increase during rehabilitation and 4 weeks after, declining to baseline level after 1 year. This supports findings by Saebu et al. that autonomous motivation is modifiable (10). Their study found a similar increase in autonomous motivation with a similar population, but few other studies have examined motivation among individuals with physical disabilities, and the size of a clinically important change in motivation is unknown. Not surprisingly, subjects with a higher educational level and higher efficacy for exercise tended to be more autonomously motivated. This is in accordance with the results of Hellstrom et al. showing that efficacy at discharge predicted prognosis in the follow-up period for stroke patients (37). Hence, self-efficacy as well as autonomous motivation should be emphasized in rehabilitation programmes. The declining autonomous motivation from 4 weeks to 1-year follow-up should be of major concern regarding the influence of behaviour over time. In addition, the changes in motivation were rather modest, and their clinical significance can be questioned.
The current study found that controlled motivation was unchanged during the 1-year follow-up. This was expected, as the rehabilitation did not focus on controlled motivation, and the trajectories of controlled motivation support the literature on controlled motivation as an external source of motivation (8). In addition, no variables were significantly different, probably because all participants received a comparable rehabilitation intervention and thus were subject to similar external influences and surroundings.
Subjects with a higher educational level and greater physical functioning (PCS) were more physically active. In addition, subjects with a higher efficacy for exercise had higher physical activity scores (PASIPD), which is in accordance with the results of Kinne et al. (38).
Pain and fatigue were reduced after the present study’s rehabilitation programme, and physical and mental functioning and self-efficacy increased. However, these changes did not appear to influence physical activity. Nor did we succeed in increasing physical activity from a 1-year perspective. This is in contrast to the results of Preede et al., who found success in improving mental and physical functioning over a longer time-frame after rehabilitation (23). However, increasing physical activity over time is challenging in the context of disability, and van der Ploeg et al. (39) also reported a failure to enhance physical activity over time. Habits of activity are probably heterogeneous and thought to be based on more than autonomous motivation and clinical improvement. Environmental barriers may be of particular importance in disability and override the effects of increased motivation and clinical improvement (40). In addition, a closer follow-up after rehabilitation may be needed to achieve long-term improvement in activity.
The clinical implications of the present study are that even when motivation and clinical improvement during rehabilitation is achieved, the goal of long-term improvement in physical activity may fail. Greater emphasis should be placed on environmental factors, as well as on more long-term support after discharge from rehabilitation.
Study limitations
In the present study, 13% of the included subjects never completed rehabilitation. This population did not differ from participants in terms of demographics and clinical parameters at baseline. The 7% and 13% not responding at 4-week and 1-year follow-ups were imputed using full information maximum likelihood (FIML) estimation by the MLM analysis, which is the state-of-the-art approach for handling missing data. Although this procedure was unlikely to reduce the variance in the longitudinal analysis in comparison to simpler approaches, such as mean substitution, FIML is not available for regression analysis and had to use a listwise deletion instead. However, physical activity was similar at admission to rehabilitation in subjects completing and not completing the 1-year follow-up. Hence, we consider that drop-out and non-completion at the 1-year follow-up was random and did not influence our conclusions. Nonetheless, to provide evidence of validity for the current HLMs, it could be beneficial to use cross-validation in additional samples with more complete data or in specific rehabilitation populations.
Physical activity was measured with a self-reported instrument; PASIPD. An objective outcome would have been desirable, but patients with disabilities are highly heterogeneous, and the type of activities varies, challenging generalization. This is also clearly demonstrated by the large variations in PASIPD scores, which may have concealed the effect of rehabilitation on this measure. The PASIPD has been compared with objective measurements by van der Ploeg et al. (25), and although a correlation coefficient of 0.3 is not impressive, it is one of the best validated self-report measurements and has been validated in a mixed case disability population, similar to that in the present sample. Lack of supported follow-up after discharge from rehabilitation, and not recording environmental barriers to physical activity are further limitations of the present study (6).
ACKNOWLEDGEMENTS
The authors would like to thank Oddlaug Hovi Gullaksen and Bjørg Anita Gustavsen Riste for their valuable support and help with data collection and administration of the study.
This study was supported by The Sophies Minde Foundation.
The authors declare no conflicts of interest.
REFERENCES

