Shamay S. M. Ng, PhD1, Bobby K. C. Lau, MPT1, Gilbert T. C. Law, MPT1, Choco W. K. Wom, MPT1, Tai-Wa Liu, MSc1,2, Eric W. C. Tam, PhD3, Mimi M. Y. Tse, PhD4 and Shirley S.M. Fong, PhD5
From the 1Department of Rehabilitation Sciences, Faculty of Health and Social Sciences, The Hong Kong Polytechnic University, Hung Hom, 2School of Science and Technology, The Open University of Hong Kong, Ho Man Tin, 3Interdisciplinary Division of Biomedical Engineering, Faculty of Engineering, 4School of Nursing, Faculty of Health and Social Sciences, The Hong Kong Polytechnic University, Hung Hom and 5School of Public Health, Li Ka Shing Faculty of Medicine, The University of Hong Kong, Hong Kong (SAR), China
OBJECTIVES: To investigate (i) the intra-rater, inter-rater and test-retest reliability of sideways walk test times and counts in individuals with stroke; (ii) their correlations with stroke-specific measures of impairment; (iii) the cut-off sideways walk test times and counts between stroke survivors and healthy controls; and (iv) the minimum detectable changes in the sideways walk test times and counts.
DESIGN: Cross-sectional study.
SETTING: University-based rehabilitation centre.
SUBJECTS: Twenty-nine older adults with stroke and 32 healthy controls.
METHODS: The sideways walk test was conducted together with Fugl-Meyer motor assessments of the lower extremities, lower limb muscle strength tests, the Five-Times-Sit-To-Stand test, Berg Balance Scale, Timed Up-and-Go test, and Activity-based Confidence and Community Integration Measure questionnaires.
RESULTS: The sideways walk test times and counts demonstrated good to excellent intra-rater, inter-rater, and test-retest reliabilities. The sideways walk test times and counts were significantly correlated with motor control and ankle dorsiflexor and plantarflexor strength of the affected leg, balance performance and functional mobility. The cut-off sideways walk test time and count that best discriminated between individuals with stroke and controls were 10.74 s and 8.83 steps, respectively. The minimal detectable change in the sideways walk test time in that situation was 1.85 s, and the count minimum detectable change was 1.12 steps.
CONCLUSION: The sideways walk test is a reliable and easy-to-administer clinical test for assessing sideways walking ability of individuals with chronic stroke.
Key words: stroke; walking; rehabilitation.
J Rehabil Med 2016; 48: 657–665
Correspondence address: Shamay S. M. Ng, Department of Rehabilitation Sciences, The Hong Kong Polytechnic University, Hung Hom, Kowloon, Hong Kong (SAR), China. E-mail: Shamay.Ng@polyu.edu.hk
Accepted Jun 16, 2016; Epub ahead of print Aug 22, 2016
INTRODUCTION
Moving in narrow or otherwise restricted spaces is common in cities, where the home and even public areas are often small and crowded. An ability to walk sideways is an essential daily living skill in such places, needed to manoeuvre inside the kitchen or getting over obstacles (1). Being able to walk sideways steadily also facilitates people’s participation in the community. They can take public transport with greater confidence and pass through crowded corridors. This ability is also important to in order to participate in various sports, such as football (2).
Individuals with stroke typically have neurological impairments, muscle weakness and sensation deficits, contributing to impaired performance in walking and daily activities (3, 4). As the metabolic cost of walking sideways is 3 times greater than that of walking forwards (5), after stroke individuals use more energy in postural control and walking than healthy persons performing the same task (6). Thus, their sideways walking ability may serve as an indicator of their general functional capability in walking sideways and their participation in daily activities at home and in the community (7). Improving sideways walking is thus a useful goal in stroke rehabilitation.
The sideways walk test (SWT) was firstly developed to evaluate dynamic walking balance in sideways walking of individuals with Parkinson’s disease (PD) (8). Individuals are instructed to walk sideways at their self-selected pace towards the right and left for 5 m. The completion time and the step count are recorded. The SWT has demonstrated excellent inter-rater reliability, with intra-class correlation coefficients (ICCs) ranging from 0.87 to 0.99 for individuals with PD (8). Despite the potential use of the SWT in stroke rehabilitation, the intra-rater, inter-rater and test-retest reliabilities and the construct validity of the SWT time and count for individuals with stroke have not yet been established.
The objectives of this study were, therefore, to assess: (i) the intra-rater, inter-rater, and test-retest reliabilities of the SWT times and counts generated by individuals with stroke; (ii) the construct validity of SWT times and counts for characterizing stroke-specific impairments; (iii) the cut-off time and count that most effectively discriminate individuals with stroke from healthy controls; and (iv) the minimal detectable changes (MDCs) of the SWT times and counts of individuals with stroke.
METHODS
This study was a cross-sectional clinical trial. A previous study has demonstrated excellent intra-rater and inter-rater reliabilities of the SWT for individuals with PD, yielding ICCs ranging from 0.87 to 0.99 (8). Assuming the ICC for individuals with stroke is 0.90, to detect a statistically significant difference at a significance level of 0.05, a power analysis shows that a sample size of 26 subjects would be required to achieve a power of 81% (9).
Twenty-nine individuals with stroke aged over 55 years were recruited from a local self-help group. This age threshold was chosen because the incidence of stroke approximately doubles each decade after the age of 55 years (10). Subjects were included if they were: (i) at least 12 months post-stroke; (ii) medically stable; (iii) able to walk at least 10 m independently with or without using any assistive device; (iv) able to score 7 or more on the Abbreviated Mental Test; and (v) able to understand and follow simple instructions. Subjects were excluded if they had any neurological disorder or other comorbid disabilities that would hinder proper assessment.
Thirty-two healthy controls aged over 55 years were recruited from the local community using poster advertising. Control candidates were excluded if they had any neurological or musculoskeletal problem affecting their mobility.
The study was approved by the ethics committee of the Hong Kong Polytechnic University and conducted according to the guidelines of the Declaration of Helsinki. Before the start of study, all of the eligible participants were informed about the objectives and procedures of the study, and written consent was obtained before the start of the study.
Outcome measures
Sideways walk test (SWT). The SWT was performed as described in a previous study (8). A 5-m walkway, with an extra of 2 m for deceleration, was marked out with coloured tape (8). Individuals were instructed to stand with the inner sides of their feet touching the starting line, and then walk sideways along the 5 m walkway at the self-selected speed. When the examiner announced “start”, the subject started to abduct the leading leg, followed by adduction of the trailing leg with the inner sides of feet touching each other. Both the time and the step count were recorded. Each subject performed 1 practice trial and then 3 timed trials toward both the affected and unaffected sides, in a randomized manner.
Fugl–Meyer Motor Assessment for the lower extremities (FMA-LE). The FMA-LE quantifies motor impairment of the lower extremities after stroke, including reflexes, movement synergies and coordination (15). It has demonstrated high inter-rater reliability (ICCs range 0.83–0.95) (9). The FMA-LE consists of 17 items, with a maximum score of 34.
Lower limb muscle strength. The isometric strength of the subjects’ hip abductors, ankle dorsiflexors and ankle plantarflexors were measured bilaterally using a Nicholas hand-held dynamometer (model 01160; Lafayette Instrument Company, Lafayette, IN, USA). Such hand-held dynamometer measurements have been shown to be objective and precise, with good to excellent intra-rater reliability (ICCs range 0.76–0.89) reported for individuals with stroke (12). The “make” test was used in this study (13, 14). One practice trial and 3 trials were performed for each muscle group, and each muscle contraction was held for 3–5 s, with a rest period of 2 min between trials.
A Cybex 6000 dynamometer (Cybex International Inc., Medway, MA, USA) was employed in measuring isokinetic contractile force generated by the knee flexors and extensors at 90°/s. The mean peak torque from 5 contractions was recorded (15).
Five-Times-Sit-To-Stand (FTSTS) test. The FTSTS test was initially designed to quantify frailty and disability and predict mortality among older adults (16, 17). It has shown excellent reliability in people with stroke, with ICCs in the range 0.97–1.00 (18). Subjects were required to complete 5 repetitions of a sit-to-stand manoeuvre as quickly as possible with their arms crossed on their chests. One practice trial and 3 timed trials were performed.
Berg Balance Scale (BBS). The BBS is a well-known clinical test of an individual’s ability to maintain balance (19). Excellent reliability (ICCs range 0.98–0.99) has been demonstrated among individuals with stroke (20). Subjects were tested on 14 tasks required in everyday living, and the quality and speed of their task completion were rated using a 5-point (0–4) scale, adding up to a maximum score of 56 (19).
Timed up and go (TUG) test. The TUG test was devised to quantify the functional mobility of frail elderly persons (21). The TUG test times delivers excellent test-retest reliability (ICCs > 0.95) for individuals after stroke (22). Subjects were instructed to stand up from a chair, walk 3 m forwards, turn in the direction of their choice, return to the chair and sit down. Each subject performed 1 practice trial and 3 timed trials.
Activities-specific Balance Confidence Scale (ABC-C). The ABC-C instrument is a self-administered questionnaire designed to assess subjective perceptions of balance confidence in performing various indoor and outdoor activities (23). The questionnaire is composed of 10 items, and the score range is from 0 to 100. A Chinese version of the questionnaire demonstrated very good inter-rater and test-retest reliabilities, with ICCs of 0.99 and 0.85, respectively (24).
Community Integration Measure – Cantonese version (CIM-C). The CIM-C instrument is a questionnaire assessing community integration, designed for individuals with stroke living in Hong Kong (25). The instrument has 10 items, with each item soliciting a rating on a 5-point scale, giving the total score from 10 to 50. The CIM-C has demonstrated high internal consistency (Cronbrach’s alpha = 0.84) with good test-retest reliability (an ICC of 0.84, significant at the 95% level of confidence) (25).
Testing procedures. The SWT was conducted on 2 separate days 7 days apart, to establish its test-retest reliability (Fig. 1). The times and counts were recorded simultaneously by 2 independent, trained raters in order to establish its inter-rater reliability, while the records of each over 3 trials were compared in order to quantify intra-rater reliability.
In addition to SWT, subjects with stroke completed FMA-LE, lower limb muscle strength measurement, FTSTS, BBS, TUG tests, ABC and CIM-C questionnaires in a random order to establish the correlations between SWT and other outcome measurements. At least 2-min rest was given between measurements to minimize the effect of fatigue. The mean values of the replicate trials were computed for data analysis. Both affected and unaffected SWT times and counts had been expected to have negative correlations with FMA-LE, muscle strength measurements and BBS scores. On the other hand, the SWT times and counts had been expected to have negative correlations with FTSTS, TUG times, ABC and CIM scores.
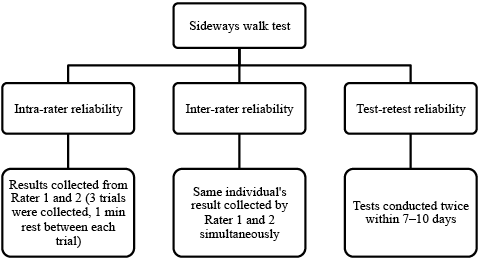
Fig. 1. Testing procedures for examining intra-rater, inter-rater and test-retest reliabilities of the sideways walk test.
The healthy controls completed the SWT in one session only. Their data were collected to identify the differences in SWT times and counts between individuals with stroke and healthy controls.
Statistical analysis
Data analysis was conducted using version 22 of the SPSS software (IBM Corp.).
Descriptive statistics were used to summarize demographic information. The Shapiro-Wilk test and Levene’s test was used to check the normality of the data and the homogeneity of variances, respectively. For computing between-group differences, independent t-tests and the Mann-Whitney U test were used for the parametric and non-parametric data, respectively (26).
ICCs were computed to measure intra-rater reliability (ICC3,1), inter-rater reliability (ICC2,2) and test-retest reliability (ICC3,2) (26). Correlations between SWT performance and other outcome measurements were quantified using Pearson correlation coefficients if the data were normally distributed and homogeneous; otherwise Spearman’s rho was used. The ρ value indicating significance was adjusted to 0.003 (0.05/16) after Bonferroni adjustment for all 16 outcome measures (27), as FMA-LE, affected lower limb muscle strength measurement, FTSTS, BBS, TUG tests, ABC and CIM-C were our primary outcome measures.
The MDCs were calculated as (26):
MDC = 1.96 × SEM × √2.
where SEM is the standard error of measurement of the SWT times or counts, calculated as
SEM = S√(1- r).
where S is the standard deviation of the SWT times or counts, and r is the reliability coefficient.
Receiver operating characteristic curves were plotted to determine the cut-off SWT times and counts best distinguishing individuals with stroke from healthy controls, with a trade-off between sensitivity and 1 minus specificity performed by Youden’s index (27).
RESULTS
Twenty-nine individuals with stroke were recruited (18 men, 11 women; mean age and standard deviation (SD), 60 years (SD 6.3); mean and SD years since stroke 9.2 years (SD 4.5)) (Table I). There were 32 healthy controls in this study (10 men, 22 women; mean age 61.8 years (SD 4.6)) (Table I).
|
Table I. Demographics of the individuals with stroke and the healthy controls |
|||
|
Characteristics |
Stroke (n = 29) |
Healthy (n = 32) |
p-value |
|
Age, years, mean (SD) |
60.0 (6.3) |
61.8 (4.6) |
0.265 |
|
Sex, male/female, n |
18/11 |
10/22 |
0.016* |
|
Height, cm, mean (SD) |
161.3 (7.3) |
157.3 (6.5) |
0.025* |
|
Weight, kg, mean (SD) |
66.2 (12.4) |
57.8 (7.4) |
0.008* |
|
Body mass index, kg/m2, mean (SD) |
25.2 (3.2) |
23.3 (2.5) |
0.011* |
|
Years since stroke, mean (SD) |
9.2 (4.5) |
NA |
NA |
|
Affected side, left/ right, n |
9/20 |
NA |
NA |
|
Abbreviated Mental Test, mean (SD) |
9.4 (0.8) |
NA |
NA |
|
*Indicates a significant difference at the p ≤ 0.05 level of confidence. NA: not applicable. SD: standard deviation. |
|||
The mean SWT times and counts of individuals with stroke and healthy controls are shown in Table II. In general, individuals with stroke took significantly longer times and more steps to complete the SWT than the healthy controls when moving toward both the affected and the unaffected side (Table II).
|
Table II. Mean sideways walk test (SWT) times and counts and stroke-specific impairment outcome measures for individuals with stroke and healthy controls |
|||||||||
|
Parameters |
Individuals with stroke (n = 29) |
|
Healthy (n = 32) Mean (SD) |
|
p (compared with healthy controls) |
|
p (affected side compared with unaffected) |
||
|
Affected Mean (SD) |
Unaffected Mean (SD) |
|
|
Affected |
Unaffected |
|
|||
|
Time (s) |
16.2 (6.7) |
15.2 (5.9) |
|
9.00 (2.5) |
|
< 0.001* |
< 0.001* |
|
0.549 |
|
Step count |
11.6 (3.8) |
10.9 (3.3) |
|
7.5 (1.3) |
|
< 0.001* |
< 0.001* |
|
0.438 |
|
FMA-LE score |
24.06 (6.17) |
|
|
|
|
|
|
|
|
|
Muscle strength |
|
|
|
|
|
|
|
|
|
|
Hip abductors (N) |
14.15 (4.36) |
16.37 (3.81) |
|
|
|
|
|
|
0.001* |
|
Knee flexors (Nm) |
10.00 (7.73) |
23.06 (9.97) |
|
|
|
|
|
|
0.001* |
|
Knee extensors (Nm) |
27.81 (17.91) |
47.28 (21.29) |
|
|
|
|
|
|
< 0.0001* |
|
Ankle dorsiflexors (N) |
9.69 (5.44) |
15.27 (3.23) |
|
|
|
|
|
|
< 0.0001* |
|
Ankle plantarflexors (N) |
14.16 (5.49) |
18.78 (4.33) |
|
|
|
|
|
|
< 0.0001* |
|
FTSTS (s) |
18.55 (9.28) |
|
|
|
|
|
|
|
|
|
BBS score |
48.91 (4.16) |
|
|
|
|
|
|
|
|
|
TUG (s) |
15.34 (5.59) |
|
|
|
|
|
|
|
|
|
ABC-C score |
78.55 (15.45) |
|
|
|
|
|
|
|
|
|
CIM-C score |
46.06 (3.68) |
|
|
|
|
|
|
|
|
|
Mean values were calculated from all the observations, including those from rater 1 and rater 2 on day 1. *Indicates a significant difference at the p ≤ 0.01 level of confidence. SD: standard deviation; FMA-LE: Fugl–Meyer Motor Assessment for the lower extremities; FTSTS: Five-Times-Sit-To-Stand test; BBS: Berg Balance Scale; TUG: Timed up and go test; ABC-C: Activities-specific Balance Confidence Scale; CIM-C: Community Integration Measure-Cantonese version. |
|||||||||
Good to excellent intra-rater, inter-rater and test-retest reliabilities were found for the SWT times and counts, with ICCs ranging from 0.866 to 0.970 for intra-rater reliability (Table III), 0.974 to 0.994 for inter-rater reliability (Table IV), and 0.974 to 0.990 for test-retest reliability (Table V).
|
Table III. Intra-rater reliability of the sideways walk test times and counts of individuals with stroke |
|||||
|
Leading limb/Rater |
Day 1 |
|
Day 2 |
||
|
Time (s) ICC3,1 (95% CI) |
Count ICC3,1 (95% CI) |
|
Time (s) ICC3,1 (95% CI) |
Count ICC3,1 (95% CI) |
|
|
Affected side |
|
|
|
|
|
|
Rater 1 |
0.970 (0.945–0.985) |
0.958 (0.924–0.978) |
|
0.956 (0.920–0.977) |
0.968 (0.942–0.984) |
|
Rater 2 |
0.962 (0.931–0.981) |
0.967 (0.939–0.983) |
|
0.957 (0.922–0.978) |
0.962 (0.931–0.981) |
|
Unaffected side |
|
|
|
|
|
|
Rater 1 |
0.924 (0.866–0.961) |
0.938 (0.889–0.968) |
|
0.915 (0.849–0.956) |
0.922 (0.862–0.960) |
|
Rater 2 |
0.939 (0.892–0.969) |
0.959 (0.925–0.979) |
|
0.926 (0.869–0.962) |
0.866 (0.769–0.930) |
|
95% CI: 95% confidence interval. |
|||||
|
Table IV. Inter-rater reliability of the sideways walk test times and counts of individuals with stroke |
|||||
|
Leading limb |
Day 1 |
|
Day 2 |
||
|
Time (s) ICC3,1 (95% CI) |
Count ICC3,1 (95% CI) |
|
Time (s) ICC3,1 (95% CI) |
Count ICC3,1 (95% CI) |
|
|
Affected side |
0.994 (0.990–0.997) |
0.992 (0.986–0.996) |
|
0.992 (0.987–0.996) |
0.993 (0.988–0.996) |
|
Unaffected side |
0.989 (0.981–0.994) |
0.987 (0.979–0.993) |
|
0.987 (0.978–0.993) |
0.974 (0.957–0.987) |
|
95% CI: 95% confidence interval. |
|||||
|
Table V. Test-retest reliability of the sideways walk test times and counts of individuals with stroke |
||
|
Leading limb/Rater |
Time (s) ICC3,1 (95% CI) |
Count ICC3,1 (95% CI) |
|
Affected side |
|
|
|
Rater 1 |
0.989 (0.981–0.994) |
0.988 (0.979–0.993) |
|
Rater 2 |
0.990 (0.982–0.995) |
0.989 (0.982–0.994) |
|
Unaffected side |
|
|
|
Rater 1 |
0.981 (0.968–0.990) |
0.974 (0.955–0.986) |
|
Rater 2 |
0.983 (0.971–0.991) |
0.975 (0.957–0.987) |
|
95% CI: 95% confidence interval; ICC: intraclass correlation coefficient. |
||
The MDCs of the SWT times were 1.85 s on the affected side and 2.13 s on the unaffected side, respectively. For the counts the corresponding MDCs were 1.12 and 1.48 steps, respectively. The best cut-off times for distinguishing between stroke and healthy subjects were 10.74 s travelling toward the affected side, and 10.19 s travelling toward the unaffected side (p ≤ 0.001).. For the step counts the corresponding cut-offs were 8.83 and 8.17 steps (p ≤ 0.001). Details of the area under the curve (AUC) are shown in Fig. 2.
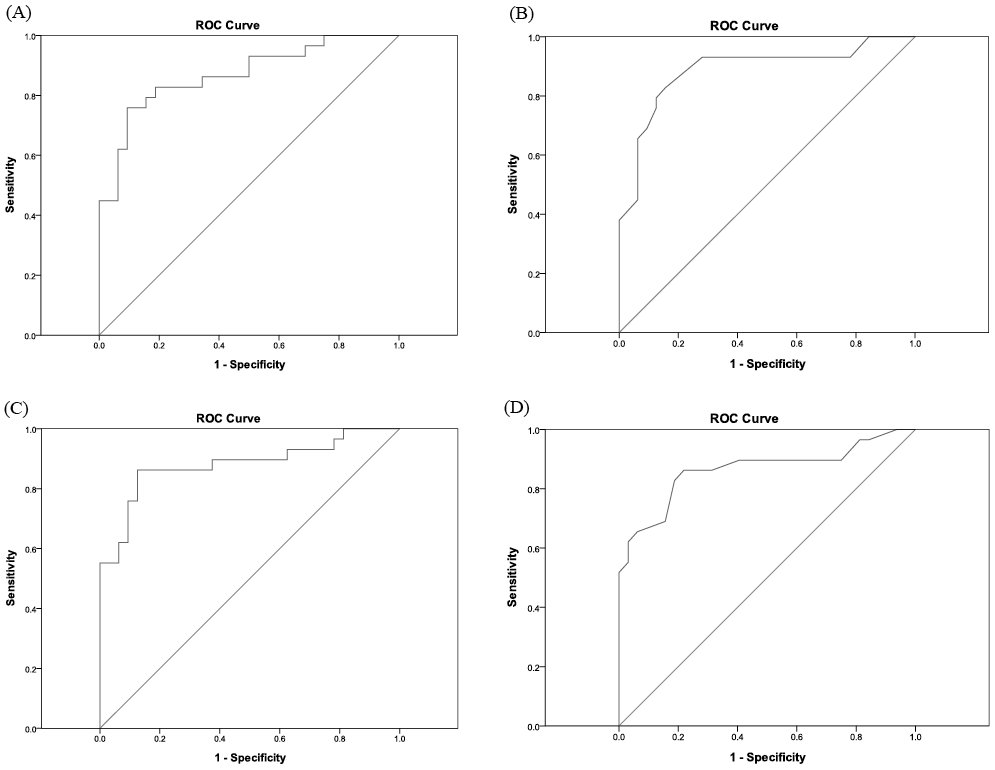
Fig. 2. Receiver operating characteristic (ROC) curves for the sideways walk test (SWT) times and counts when leading with the leg on the affected and unaffected sides. (A) ROC curve for unaffected SWT time (area under the curve (AUC) = 0.869; sensitivity, 81%; specificity, 81%; p < 0.001). (B) ROC curve for unaffected SWT count (AUC = 0.887; sensitivity, 83%; specificity, 84%; p < 0.001). (C) ROC curve for affected SWT time (AUC= 0 .880; sensitivity, 86%; specificity, 88%; p < 0.001). (D) ROC curve for affected SWT count (AUC = 0.864; sensitivity, 83%; specificity, 81%; p < 0.001).
The SWT times on both the affected and unaffected sides correlated significantly with FMA-LE scores, FTSTS times, BBS scores and TUG times (Table VI) (Figs 3 and 4). Ankle dorsiflexor and plantarflexor strength on the affected side correlated significantly with the SWT times and counts in both directions (Table VI, Figs 3 and 4).
|
Table VI. Correlations relating the sideways walk test times and counts with indicators of stroke-specific impairment |
|||||
|
Leading limb |
Affected |
|
Unaffected |
||
|
Time Spearman’s rho (ρ) |
Count Spearman’s rho (ρ) |
|
Time Spearman’s rho (ρ) |
Count Spearman’s rho (ρ) |
|
|
FMA-LE |
–0.742* (p ≤ 0.0001) |
–0.667* (p ≤ 0.0001) |
|
–0.660* (p ≤ 0.0001) |
–0.662* (p ≤ 0.0001) |
|
Muscle strength of lower limbs |
|||||
|
Affected side strength |
|||||
|
Hip abductor (N) |
–0.489 (p = 0.007) |
–0.500 (p = 0.006) |
|
–0.513 (p = 0.004) |
–0.419 (p = 0.024) |
|
Knee flexor (Nm) |
–0.510 (p = 0.005) |
–0.456 (p = 0.013) |
|
–0.499 (p = 0.006) |
–0.455 (p = 0.013) |
|
Knee extensor (Nm) |
–0.493 (p = 0.007) |
–0.418 (p = 0.024) |
|
–0.480 (p = 0.008) |
–0.458 (p = 0.013) |
|
Ankle dorsiflexor (N) |
–0.586* (p = 0.001) |
–0.639* (p < 0.0001) |
|
–0.561* (p = 0.002) |
–0.446 (p = 0.015) |
|
Ankle plantarflexor (N) |
–0.730* (p < 0.0001) |
–0.636* (p < 0.0001) |
|
–0.689* (p = 0.000) |
–0.587* (p = 0.001) |
|
Unaffected side strength |
|||||
|
Hip abductor (N) |
–0.385 (p = 0.039) |
–0.484 (p = 0.008) |
|
–0.409 (p = 0.027) |
–0.368 (p = 0.050) |
|
Knee flexor (Nm) |
–0.099 (p = 0.609) |
–0.144 (p = 0.457) |
|
0.003 (p = 0.989) |
–0.125 (p = 0.520) |
|
Knee extensor (Nm) |
–0.110 (p = 0.569) |
–0.166 (p = 0.390) |
|
–0.036 (p = 0.853) |
–0.183 (p = 0.341) |
|
Ankle dorsiflexor (N) |
–0.328 (p = 0.083) |
–0.399 (p = 0.032) |
|
–0.343 (p = 0.068) |
–0.358 (p = 0.057) |
|
Ankle plantarflexor (N) |
–0.130 (p = 0.502) |
–0.065 (p = 0.738) |
|
–0.180 (p = 0.351) |
–0.089 (p = 0.646) |
|
FTSTS (s) |
0.568* (p ≤ 0.001) |
0.597* (p ≤ 0.001) |
|
0.591* (p ≤ 0.001) |
0.621* (p ≤ 0.001) |
|
BBS |
–0.617*(p ≤ 0.0001) |
–0.617* (p ≤ 0.0001) |
|
–0.544* (p = 0.002) |
–0.659* (p ≤ 0.000) |
|
TUG test (s) |
0.673* (p < 0.0001) |
0.727* (p < 0.0001) |
|
0.662* (p < 0.0001) |
0.615* (p < 0.0001) |
|
ABC-C |
–0.297 (p = 0.118) |
–0.331 (p = 0.080) |
|
–0.341 (p = 0.070) |
–0.471 (p = 0.010) |
|
CIM-C |
–0.158 (p = 0.414) |
–0.026 (p = 0.894) |
|
–0.087 (p = 0.665) |
–0.056 (p = 0.771) |
|
*Significant correlation after Bonferroni adjustment at a p-value of 0.05/16 (p ≤ 0.003). FMA-LE: Fugl-Meyer Motor Assessment for the lower extremities; FTSTS: Five-Times-Sit-To-Stand test; BBS: Berg Balance Scale; TUG: Timed up and go test; ABC-C: Activities-specific Balance Confidence Scale; CIM-C: Community Integration Measure-Cantonese version. |
|||||
Fig. 3. Relationship between affected sideways walk test (SWT) times with: (A) Fugl-Meyer Assessment Lower Extremity scores (r = –0.742, p ≤ 0.0001); (B) affected ankle dorsiflexor strength (r = –0.586, p = 0.001); (C) affected ankle plantarflexor strength (r = –0.73, p ≤ 0.0001); (D) five time sit-to-stand test (r = 0.568, p ≤ 0.001); (E) Berg Balance Scale scores (r = –0.617, p ≤ 0.0001); (F) timed up and go times (r = 0.673, p ≤ 0.0001).
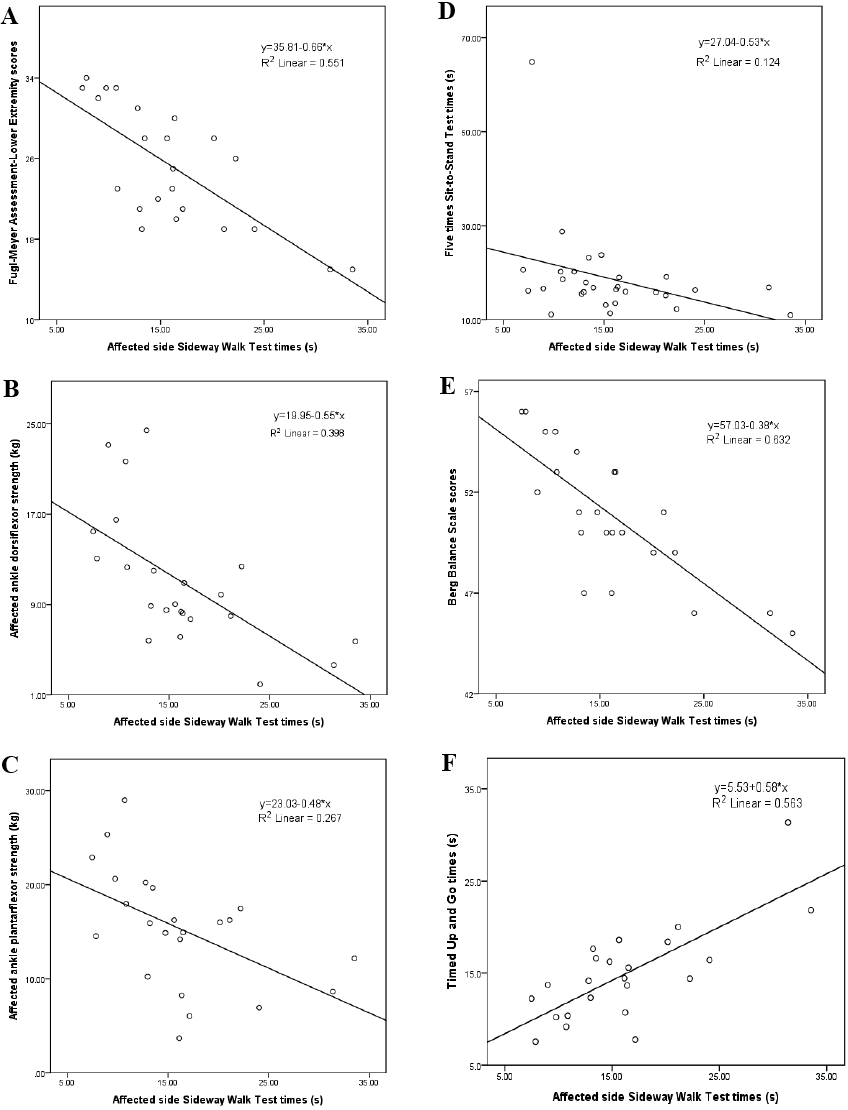
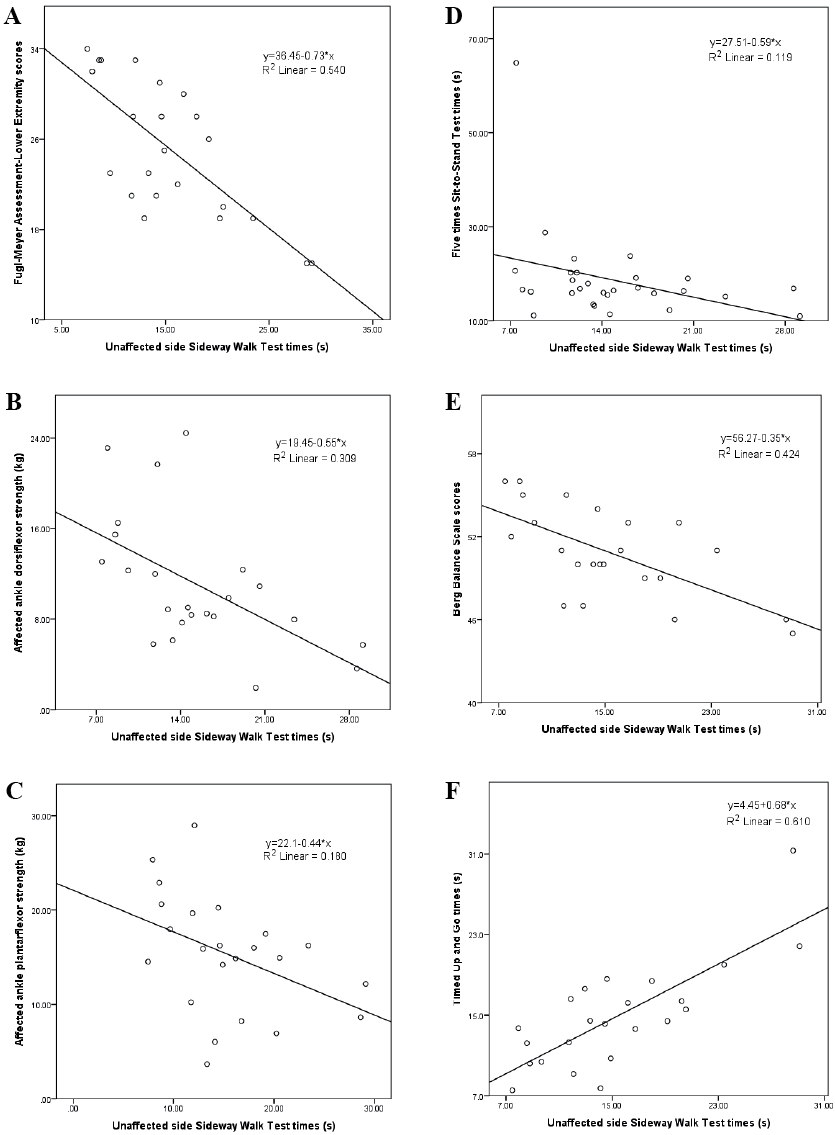
Fig. 4. Relationship between unaffected sideways walk test (SWT) times with: (A) Fugl-Meyer Assessment Lower Extremity scores (r = –0.66, p ≤ 0.0001); (B) affected ankle dorsiflexor strength (r = –0.561, p = 0.002); (C) affected ankle plantarflexor strength (r = –0.689, p ≤ 0.0001); (D) 5 time sit-to-stand test times (r = 0.591, p ≤ 0.001); (E) Berg Balance Scale scores (r = –0.544, p = 0.002); (F) timed up and go times (r = 0.6621, p ≤ 0.0001).
DISCUSSION
This is the first published study to investigate intra-rater, inter-rater and test-retest reliabilities and correlation SWT times and counts between stroke-specific measures of impairment. It was also the first to determine the cut-off times and counts best discriminating individuals with stroke from healthy controls.
Reliability of the sideways walk test
All SWT times and counts demonstrated good to excellent intra-rater, inter-rater and test-retest reliabilities. This probably resulted from the standardized instructions and set-up, and the well-trained raters who strictly followed the procedures. The 2 min resting time between trials seems to have been sufficient to minimize fatigue, also perhaps contributing to the satisfactory intra-rater reliability. In addition, the excellent test-retest reliabilities imply that 7 days was sufficiently long to minimize learning effects, yet short enough to avoid significant actual change in performance.
Performance of sideways walk test
As expected, the healthy controls recorded shorter SWT times and fewer SWT counts than the individuals with stroke. The substantial difference SWT times and counts between the 2 groups is presumably due to stroke-specific impairments, such as lower limb control and poor balance (28). Stroke survivors often display insufficient recruitment and decreased firing frequency of muscle motor units (29), localized adaption of paretic muscle fibres (30), and decreased voluntary activation (30).
The MDCs of the affected and unaffected SWT times were 1.85 s and 2.13 s, while those of the affected and unaffected SWT counts were 1.12 and 1.48 steps, respectively. Such values would indicate actual changes in capability rather than chance deviations. The mean difference in SWT times between individuals with stroke and the healthy controls was 7.2 s (affected) or 6.2 s (unaffected), while the differences in mean step count were 4.1 steps (affected) and 3.4 steps (unaffected). Since those differences were greater than the corresponding MDCs, the longer SWT times and the additional SWT counts represent true differences in performance.
It is interesting to note that the SWT times of these individuals with stroke (affected: 16.2s and unaffected: 15.2s) were longer than those for typical PD sufferers (9.3 s under medication or 11.9 s off medication) (8). This agrees with the results of a previous study, that individuals with PD demonstrated faster walking speed than those with stroke in a 10-m-walk test (30). In terms of step count, there was no significant difference from the counts of individuals with PD after medication (10.8 steps). This too agrees with the results of a previous study, which found that the stride lengths of individuals with PD and stroke are similar (31). Individuals with PD who are off medication require more steps (13.1 steps) to complete the SWT. This is probably related to bradykinesia (32). The differences in demographics among different studies, including ethnicity, age and types and severity of the disease, could also be variants contributing to these discrepancies.
Furthermore, those individuals with stroke require more count to complete the SWT. This could be due to stroke-specific impairment, including poor lower limb control and poor balance ability (28). In order to maintain dynamic balance and increase static stability while performing the SWT, those individuals with stroke might take shorter steps, resulting in a higher SWT count.
Correlations of the sideways walk test times and counts with other measures
The affected and unaffected SWT times and counts demonstrated significant negative correlation with FMA-LE scores (r = –0.742 to –0.660). The FMA-LE was designed to evaluate reflexes, isolated control and coordination of the lower limbs, all of which should be related to performance in the SWT in terms of both time and step count. Moreover, the FMA-LE scores have been shown to correlate with the (forwards) walking velocity and endurance of individuals with stroke, which additionally supports the correlation of the SWT times with the FMA-LE scores (33, 34).
The SWT performance was also significantly correlated with the strengths of the ankle dorsiflexors and plantarflexors on the affected side (r = –0.730 to –0.561). During sideways walking, the foot swing is initiated by pushing off through ankle plantarflexion and cleared off the ground with ankle dorsiflexion, while the supporting leg uses the ankle muscles for stabilization (35). Indeed, the strength of the ankle plantarflexors on the affected side showed the strongest correlation among all the muscle strength results and detailed inverse dynamics is warranted to reveal the role of push-off power in the leading and trailing legs correspondingly.
The affected and unaffected SWT times and counts significantly correlated with FTSTS completion times (r = 0.568 to 0.621). FTSTS completion times measures functional lower limb strength, which is well known to be correlated with gait velocity after stroke (35, 36).
The SWT times and counts significantly correlated with the BBS scores (r = –0.659 to –0.544). Although the BBS does not include sideways walking, the challenge to balance is similar in some of the BBS tasks, such as alternate stepping, which requires alternating weight shifting and single leg standing with changes in the base of support.
Both the SWT times and counts showed significant correlation with TUG time (r = 0.615 to 0.727). The rising from sitting and sitting from standing movements are similar to movements in the FTSTS test, while the turning movement coincides with the turning task in the BBS. It is therefore reasonable to expect significant correlation between performance of SWT and TUG times.
It is surprising to note that the SWT times and counts did not show any significant correlation with ABC-C and CIM-C scores, despite the fact that ABC-C results are known to correlate with BBS scores (37). Such discrepancy could be explained by the fact that the ABC-C was designed to measure self-perceptions of efficacy in daily living tasks calling for balance, while CIM-C evaluates subjective community participation and integration. This was different from the physical performance measured by the SWT. In addition, the current study was conducted in a secure and controlled environment, which is different from the real-life environment of the ABC-C and CIM-C.
The SWT cut-off times and counts could discriminate healthy controls from those with chronic stroke, with the AUC ranging from 0.864 to 0.887. The best cut-off times and counts were 10.74 s and 8.83 steps when leading with the affected leg, and 10.19 s and 8.17 steps with the unaffected leg leading. The AUC of 86.4–88.7% signifies the probability of identifying someone with impaired functional mobility using SWT times or counts.
Limitations
All of these results were generated by Chinese individuals aged over 55 years who met the inclusion criteria. The results may not, therefore, automatically generalize to all ages and ethnicities. Secondly, this study only measured SWT times and counts, not the quality of movement during sideways perambulation. Further research investigating gait and movement patterns seems justified to develop ways of quantifying the movement quality during sideways walking. Future work might also examine other possible neuromuscular factors, such as coordination, lower limb proprioception and tactile sensation.
The cut-off scores suggested may need to be interpreted with caution because of the uneven sex ratio and the significant difference in mean body weight, height and body mass index of the 2 groups. The significant gender difference in both muscle strength and functional task performance are well documented (38, 39). Any future study with larger sample sizes should take into account the effects of sex ratios on SWT performance.
Conclusion
The SWT is an easy-to-administer clinical test for assessing sideways walking ability in individuals with stroke. Both SWT times and counts demonstrated good to excellent intra-rater, inter-rater, and test-retest reliabilities in individuals after stroke. Performance of SWT significantly correlated with FMA-LE scores, ankle dorsiflexor and plantarflexor strength on the affected side, FTSTS times, TUG test times and BBS scores. Both SWT times and counts are able to differentiate reliably between individuals with stroke and healthy adults.
Conflicts of interest
No commercial party having a direct financial interest in the results of the research supporting this article has or will confer a benefit upon the authors or upon any organization with which the authors are associated.
REFERENCES

